Galaxy And Mass Assembly (GAMA): Mid-Infrared Properties and Empirical Relations from WISE
Abstract
The Galaxy And Mass Assembly (GAMA) survey furnishes a deep redshift catalog that, when combined with the Wide-field Infrared Explorer (WISE), allows us to explore for the first time the mid-infrared properties of galaxies over 120 deg2 to . In this paper we detail the procedure for producing the matched GAMA-WISE catalog for the G12 and G15 fields, in particular characterising and measuring resolved sources; the complete catalogs for all three GAMA equatorial fields will be made available through the GAMA public releases. The wealth of multiwavelength photometry and optical spectroscopy allows us to explore empirical relations between optically determined stellar mass (derived from synthetic stellar population models) and 3.4µm and 4.6µm WISE measurements. Similarly dust-corrected H-derived star formation rates can be compared to 12µm and 22µm luminosities to quantify correlations that can be applied to large samples to . To illustrate the applications of these relations, we use the 12µm star formation prescription to investigate the behaviour of specific star formation within the GAMA-WISE sample and underscore the ability of WISE to detect star-forming systems at . Within galaxy groups (determined by a sophisticated friends-of-friends scheme), results suggest that galaxies with a neighbor within kpc have, on average, lower specific star formation rates than typical GAMA galaxies with the same stellar mass.
Subject headings:
galaxies – mid-infrared, surveys, catalogs1. Introduction
Spanning almost six decades and counting, large area surveys have revolutionised our view of the structure and evolution of the universe, for example, the Palomar Observatory Sky Survey (POSS II, Reid et al. 1991), the IIIa-J SRC Southern Sky Survey, the Infrared Astronomy Satellite (IRAS) Sky Survey Atlas (Wheelock et al. 1994), 2dF Galaxy Redshift Survey (2dFGRS, Colless et al., 2001), the Sloan Digital Sky Survey (SDSS, Abazajian et al. 2003), the H i Parkes All Sky Survey (HIPASS, Meyer et al. 2004), the 6dF Galaxy Survey (6dFGS, Jones et al., 2004), the 2 Micron All Sky Survey (2MASS, Skrutskie et al. 2006) and the UKIRT Infrared Deep Sky Survey (UKIDSS, Lawrence et al., 2007). Uncovering the properties of large galaxy populations has proved essential to our understanding of how galaxies develop and transform. Increasing sensitivity and scale in the time domain, as with Skymapper and the planned LSST (Large Synoptic Survey Telescope) holds the promise of enormous future scientific returns. In the near future, leading-edge radio telescopes and planned strategic surveys will add a key ingredient to the mix – H i and continuum measurements will trace neutral gas reservoirs and activity to unprecedented depth, sky coverage and resolution with WALLABY and EMU on ASKAP (Australian Square Kilometer Array Pathfinder), Apertif-WNSHS, LADUMA (Holwerda & Blyth, 2010) on MeerKAT, and the JVLA.
In order to better understand the key physics at work in star-forming galaxies, and crucially the efficacy of different physical mechanisms, one requires the combination of extended area and sufficient depth in order to capture a cosmologically and evolutionarily significant volume. The GAMA (Galaxy and Mass Assembly, Driver et al., 2009; Driver et al., 2011) survey provides exactly this laboratory. At its heart, GAMA is an optical spectroscopic survey of up to 300 000 galaxies (Hopkins et al., 2013) obtained at the Anglo-Australian Telescope situated at Siding Spring Observatory. Three equatorial fields (G09, G12 and G15) covering 180 deg2 sample large-scale structure to a redshift of z, with overall median redshift of z, and two southern fields (G02 and G23). Multiwavelength ancillary data from ultraviolet to far-infrared wavelengths provides comprehensive SED (Spectral Energy Distribution) wavelength real estate. At mid-infrared wavelengths it falls to WISE, the Wide-field Infrared Survey Explorer, to span the near-infrared transition from stellar to dust emission.
Launched in December 2009, WISE surveyed the entire sky in four mid-infrared bands: 3.4µm 4.6µm, 12µm and 22µm (Wright et al., 2010). In the local Universe, the 3.4µm (W1) and 4.6µm (W2) bands chiefly trace the continuum emission from evolved stars (see, for example, Meidt et al., 2012). The W1 band is the most sensitive to stellar light, typically reaching depths to . The W2 band is additionally sensitive to hot dust; hence, this makes the 3.4µm 4.6µm color very sensitive to galaxies dominated globally by active galactic nucleus (AGN) emission (see e.g., Jarrett et al., 2011; Stern et al., 2012). The 12µm (W3) band is broad (see Wright et al., 2010, for relative system response curves) and can trace both the 9.7µm silicate absorption feature, as well as the 11.3µm PAH (polycyclic aromatic hydrocarbon) and Neii emission lines. Lastly, the W4 band traces the warm dust continuum at 22µm, sensitive to reprocessed radiation from star formation and AGN activity. WISE is thus optimally suited to study the diverse emission mechanisms of galaxies.
WISE is confusion-noise-limited – the structure of the background (e.g. distant galaxies and scattered light) increases noise by contributing flux – and under these conditions point spread function (PSF) profile-fitted photometry performs robustly (Marsh & Jarrett, 2012). For unresolved sources, this is the adopted method of obtaining photometry and accordingly the WISE Source Catalog is optimised and calibrated for point sources. The angular resolution of WISE frames, used for determining the profile photometry measurement (keyword wmpro in the WISE All-Sky Data Release), is 6.1″, 6.4″, 6.5″and 12.0″ for W1, W2, W3 and W4, respectively. The WISE public-release data products also includes an image Atlas of tiled mosaics; however, the angular resolution is slightly degraded in the Atlas images because they are convolved with a matched filter to optimize point-source detection. The crucial point here is that the WISE catalogs and images are not well-suited to characterization of resolved sources. Resolved sources will either be detected and measured as conglomerations of several point sources, or have their flux grossly underestimated by the PSF profile. As a consequence, it is left to the community to properly measure sources that are resolved by WISE (i.e., nearby galaxies). In this work we have produced new, better-optimized images to extract resolved galaxy measurements from the GAMA fields to complement the point-source measurements obtained from the public-release catalogs.
A detailed WISE study of several nearby ( Mpc) galaxies (Jarrett et al., 2013) has highlighted how WISE data can be used in multiwavelength studies of star formation and interstellar medium (ISM) conditions, as well as tracing global properties such as stellar mass and star formation. The work of Donoso et al. (2012) showed the power of combining WISE with a large-area survey (SDSS); they investigated the effect of star formation- and AGN-activity on the WISE properties of galaxies, including calibrations using the 12µm and 22µm luminosities. These empirical calibrations have also been investigated in 22µm-selected galaxies in SDSS galaxies with by Lee et al. (2013). WISE colours have proved to be an excellent AGN selection tool (Jarrett et al., 2011; Stern et al., 2012; Assef et al., 2013), and as a diagnostic for determining the accretion modes amongst radio-loud AGN (Gurkan et al., 2013). Yan et al. (2013) combine WISE and SDSS to provide a phenomenological characterization for WISE extragalactic sources.
In this paper we harness the power of the GAMA survey, and its value-added data products, cross matching GAMA galaxies in two completed GAMA fields (the G12 and G15 regions) to their WISE counterparts. The G09 region is not considered in this analysis, but will be included as part of the GAMA-WISE data release.
GAMA counterparts at low redshift will be predominantly resolved, particularly in the W1 and W2 bands. Unlike previous studies, we include robust measurements of resolved sources in these fields and distinguish between resolved and unresolved systems to determine the photometry most appropriate for a given source. Since GAMA is highly spectroscopically complete to within the two GAMA regions, we are able to push WISE to higher redshifts than previously possible for wide-field surveys. We explore empirical relationships for stellar mass and star formation rates, the color distribution of WISE sources in GAMA and their behaviour in dense environments. The paper is arranged as follows: in § 2 we describe the data used in this analysis, § 3 discusses how the GAMA-WISE matched catalog is constructed, § 4 contains results derived from the combined surveys and § 5 illustrates scientific applications of the catalog. Conclusions are presented in § 6.
The cosmology adopted throughout this paper is km s-1 Mpc-1, , and . All magnitudes are in the Vega system (WISE calibration described in Jarrett et al. 2011) unless indicated explicitly by an AB subscript.
2. Data
2.1. GAMA
Our sample is drawn from the G12 and G15 equatorial fields of the GAMA II survey (Driver et al., 2009; Driver et al., 2011) combining high spectroscopic completeness ( 97%) to a limiting magnitude of , with a wealth of ancillary photometric data. Details of target selection for the survey are outlined in Baldry et al. (2010) and optimal tiling for the survey in Robotham et al. (2010). Spectra were obtained primarily with the 2dF instrument mounted on the 3.9-m Anglo-Australian Telescope, and additionally from the Sloan Digital Sky Survey (SDSS DR7; Abazajian et al., 2009). Reduction and analysis of the spectra is discussed in detail in Hopkins et al. (2013) and Liske et al. (in prep.).
Photometric data for galaxies within the G12 and G15 volumes (ApMatchedCatv05) is drawn from SDSS imaging () as outlined in Hill et al. (2011) and VISTA VIKING () as detailed in Driver et al. (in prep.). Photometry is corrected for Galactic foreground dust extinction using Schlegel et al. (1998). Stellar mass estimates (StellarMassesv15) are derived from matched-aperture photometry using synthetic stellar population models from Bruzual & Charlot (2003) as detailed in Taylor et al. (2011). We take advantage of the completed observations in the equatorial fields and updated redshifts (Baldry et al., in prep.) and stellar masses. Throughout our analysis we only use sources with reliable redshifts i.e. (Driver et al., 2011).
Star formation rates (SFRs) can be derived from the H equivalent width, combined with the -band absolute magnitude, and are available for the GAMA phase-I survey ( in G15 and in G12) as determined in Gunawardhana et al. (2011, 2013). Corrections are applied for the underlying Balmer stellar absorption, dust obscuration and fibre aperture effects. To maintain consistency we only use SFRs from Gunawardhana et al. (2013) derived for galaxies with redshifts matching in both GAMA I and GAMA II ( were excluded because of this criterion).
2.2. WISE Image Construction
The WISE mission provides ‘Atlas’ Images via its data repository, which are co-added and interpolated from the multiple single exposure frames taken during the survey (Cutri et al., 2012). These 1.56 mosaics have a 1.375″ pixel scale, but the resampling and co-addition method is optimised for point source detection; Atlas images have beam sizes of 8.1″, 8.8″, 11.0″ and 17.5″ for the W1, W2, W3 and W4 bands, respectively. To better preserve the native resolution of the single frames we employ a mosaic construction that uses the ‘drizzle’ resampling technique. Variable-Pixel Linear Reconstruction or drizzling co-addition algorithm using a tophat PRF (point response function) can be used to improve the spatial resolution compared to the nominal Atlas Images (Jarrett et al., 2012). Drizzled image mosaics, 1.31.3 degrees in size, were created using the software package ICORE (Masci, 2013) achieving a resolution of 5.9″, 6.5″, 7.0″ and 12.4″ in the 3.4µm, 4.6µm, 12µm and 22µm, respectively. Within ICORE, background level offset-matching, flagging and outlier rejection and co-addition using overlap area-weighted interpolation ensures optimal background stability. The number of images that are combined is dependent on the depth of coverage and additional orbits, a function of the field’s location relative to the ecliptic. For the GAMA fields the coverage is typically 12 and 24 frames for the G12 and G15 fields, respectively, where G15 benefits from additional scans in that region arising from multiple epoch WISE orbits.
2.3. Cross Match to GAMA G12 and G15
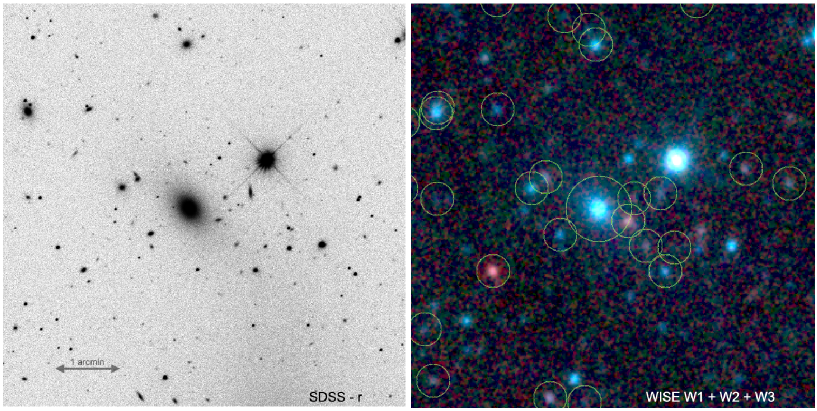
Galaxies were extracted from the G12 and G15 GAMA II catalogs of observed sources (i.e. TilingCatv41 with redshifts as in SpecAllv21 and ) – 69,693 and 64,822 for G12 and G15, respectively, and cross-matched to the WISE All-Sky Catalog using the NASA/IPAC Infrared Science Archive (IRSA) and a 3″ cone search radius. The number of unique objects in each field were 60,645 GAMA matches for G12 and 58,199 for G15, i.e., a 87.0% and 89.8% match rate for G12 and G15, respectively, with a higher match rate in G15 due to the increased WISE depth (from additional scans) and therefore sensitivity. Further details are provided in Table 1 and a region of G15 shown in Figure 1 to illustrate the difference between the optical and mid-infrared sky.
For this analysis, we rely on several parameters output by the WISE All-Sky Catalog; these are listed in Table 2 with a brief explanation.
| G12 (total: 60,645 sources) | ||||
| Band | Detections | SNR1 | SNR | Upper Limits† |
| W1 | 100% | 100% | 99.9% | 0% |
| W2 | 100% | 96% | 77% | 4% |
| W3 | 99% | 47% | 17% | 52% |
| W4 | 98% | 19% | 2% | 79% |
| G15 (total: 58,199 sources) | ||||
| Band | Detections | SNR | SNR | Upper Limits† |
| W1 | 100% | 100% | 99.9% | 0.01% |
| W2 | 100% | 98% | 88% | 2% |
| W3 | 99% | 58% | 29% | 42% |
| W4 | 98% | 19% | 3% | 78% |
| 1 Signal-to-noise ratio as measured by wmpro | ||||
| † Detections with 2 upper limits | ||||
| designation | unique WISE source designation |
|---|---|
| ra (deg) | Right Ascension (J2000) |
| dec (deg) | Declination (J2000) |
| sigra (arcsec) | uncertainty in RA |
| sigdec (arcsec) | uncertainty in DEC |
| wmpro (mag) | instrumental profile-fit photometry magnitude |
| wsigmpro (mag) | instrumental profile-fit photometry uncertainty |
| wrchi2 | instrumental profile-fit photometry reduced |
| nb | number of blend components used in each fit |
| na | active deblend flag (=1 if actively deblended) |
| xscprox (arcsec) | distance between source center and XSC† galaxy |
| wrsemi | (scaled) semi-major axis of galaxy from XSC† |
| wgmag | elliptical aperture mag of extracted galaxy |
| = 1,2,3,4 | |
| †: 2MASS Extended Source Catalog (Jarrett et al., 2000) | |
3. Sources Resolved by WISE
A key feature of a catalog containing WISE photometry is determining which of the galaxies are resolved and then ensuring their fluxes are measured robustly. A broad indication is given by the reduced (wrchi2) of the profile-fit solution, where high values of the wrchi2 parameter indicate that the wpro algorithm measurement is underestimating the flux of the source. Sources with wrchi2 are often resolved, with wrchi2 usually indicating well-resolved systems.
Unfortunately wrchi is not by itself a robust measure of ‘resolvedness’, particularly where sources have a low signal to noise. The ‘reduced’ metric tends to unity as noise begins to dominate the measurement. Moreover, the wmpro fitting process can be fooled for sources with relatively bright cores that are just being resolved by WISE – this happens with 2MASS compact extended sources which have low wrchi2, but the wmpro and isophotal photometry can be systematically offset.
Even though 2MASS has superior (2) spatial resolution compared to WISE, with its greater sensitivity WISE is able to resolve many nearby, relatively small galaxies. Therefore, all 2MASS Extended Source Catalog (XSC, Jarrett et al., 2000) sources should be tested to determine if they are resolved by WISE (see § 3.2). For galaxies not in the 2MASS XSC, values of wrchi2 should be used as an initial selection for resolved objects. Caution is required, however, since blended objects will also satisfy this criterion and can be a source of false positives, notably when the stellar confusion is significant.
3.1. Source Characterization of Potentially Resolved Sources
Sources are measured using custom software adapting tools and algorithms developed for the 2MASS XSC (Jarrett et al., 2000) and WISE photometry pipelines (Jarrett et al., 2011; Cutri et al., 2012; Jarrett et al., 2013). The process is semi-automated in that photometry measurements are automated, but each result is assessed by visual inspection with intervention where necessary.
The first step is to remove point sources by PSF subtraction which preserves the structure of the background. If necessary surrounding contaminating sources are masked (e.g., bright stars). The local background is estimated from pixel value (trimmed average) distribution that lies within an elliptical annulus located just outside of an ‘active region’ which represents the image area that contains measurable light from the galaxy. The active region is not initially known, but it determined through successive iteration of the characterisation process until convergence is reached.
The galaxy is modeled using an ellipsoid built from azimuthally averaging the (background-subtracted) surface brightness; any masked pixels are recovered using a weighted combination of the local background (to the masked source) and the galaxy model. The best fit axis ratio and ellipticity are determined using the 3 isophote and the galaxy shape is defined by this isophote and is assumed to be fixed at all radii. The primary ‘isophotal’ photometry (Wiso) is then measured from the 1 (of the background RMS) elliptical isophote, capturing over 90% of the total light (see Jarrett et al 2013). Other measurements include a double Sérsic fit, to the inner galaxy region (i.e., the bulge) and the outer region (i.e., the disk), thus allowing estimation of the total integrated flux that extends beyond the 1 isophote. Since WISE is confusion-noise limited, we track the photometry using a curve-of-growth table. Where a large mismatch occurs between the isophotal radius and the radius where the change in flux is less than 2% (the ‘convergence point’), the size of the active region is automatically decreased. This usually occurs where background levels are elevated due to a neighboring bright source which contaminates the background level. The process is iterated to adjust the active region until the source measurements have converged.
Once all the sources in a field are measured and modeled accordingly, the process is rerun to effectively perform galaxy-galaxy deblending. Where a measurement exists for a galaxy when measuring an adjacent source, the galaxy model is subtracted in addition to neighboring point sources. This mitigates contamination from nearby resolved sources.
3.2. The Resolved Parameter Rfuzzy
The WISE bands at 3.4µm and 4.6µm achieve the best spatial resolution, at 6.1″ and 6.4″, respectively, and capture extended light arising from evolved stars in the bulge and disk regions. Since w1rchi2 cannot discriminate well between faint, resolved and unresolved systems, we use the 2nd order intensity-weighted moment to describe the shape (major and minor axis) of the object and measure the intensity-weighted moment of the object on either side of the main axis.
If the object is symmetric and resolved on both sides of the major axis (as with a nominal resolved source), then each moment will have a resolved signature (i.e., the moment is large compared to a point source). If the object is, for example, a star blended with a galaxy, then their moments will be different (one half will have a moment that is point-like, the other resolved). Thus, taking the minimum moment value between the two halves, determines whether the source is resolved. Fuzzy objects will have a large moment regardless of which major axis half that is measured; stars or double stars will have a minimum moment that appears to be unresolved. The performance of the Rfuzzy parameter is illustrated in § A.1 of the appendix.
3.3. Catalog of Resolved Sources

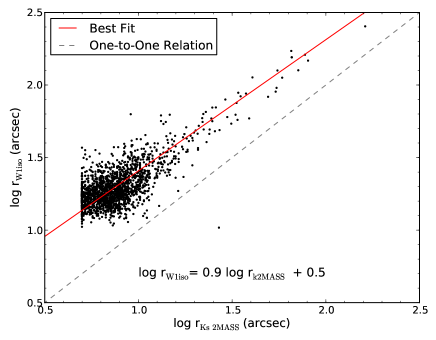
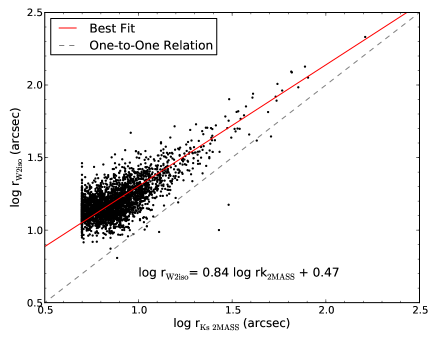
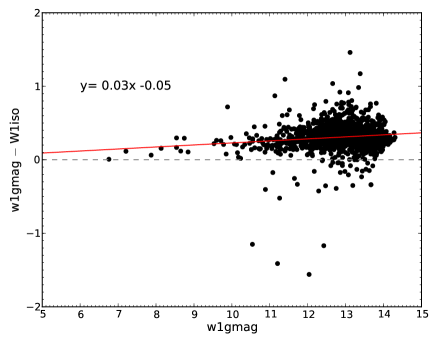
Isolating the resolved sources using the Rfuzzy parameter (in W1) gives 1,390 and 1,368 sources in G12 and G15, respectively, i.e. % of the total WISE matched sources in these fields. It is important to bear in mind that despite the resolution of the W1 and W2 bands, WISE is far more sensitive compared to, for example, 2MASS and will detect the extended light profiles from nearby galaxies. The typical W1 1 isophotal radius is more than a factor of 2 in scale compared to the equivalent 2MASS Ks-band isophotal radius. An illustration of this is shown in Figure 2 where the 2MASS XSC-derived scaled aperture photometry (wgmag) are compared to the isophotal photometry of resolved sources in the GAMA G12 and G15 fields. The 2MASS XSC-derived magnitudes underestimate the inferred flux due to the increased sensitivity of WISE. Note that no star subtraction or deblending has been attempted when measuring the wgmags and contamination may be present; as a consequence, these measurements should only be used as a last resort (employing the offset shown in Figure 2 to obtain the correct galaxy flux). The behavior of resolved sources is further explored in § A.2 of the Appendix.
3.4. GAMA-WISE Catalog Photometry
For point sources, the primary photometry are the profile fit measurements (wmpro), and for well-resolved sources the isophotal photometry (§ 3.1). When the source is not well resolved, or the S/N (signal-to-noise) is low, the following steps are used to choose the best photometry:
-
•
wmpro photometry is used when the S/N is low, as measured by the isophotal aperture process for a given band: S/N of 10, 10, 15 and 15 for W1, W2, W3 and W4, respectively.
-
•
If the Rfuzzy parameter is false (measured in the W1 band), classify source as unresolved and use wmpro photometry for bands W1 and W2.
-
•
If w3rchi2 2, classify source as unresolved and revert to the w3mpro photometry.
-
•
If w4rchi2 2, classify source as unresolved and revert to the w4mpro photometry.
-
•
W1 is the most sensitive WISE band. To obtain an accurate W1W2 color for galaxies resolved in W1 and W2, the following steps are employed. Firstly, an accurate W1W2 color is determined using a matched aperture derived from the smaller of the two isophotal radii (which is usually W2). Then, from the isophotal magnitude of the W1 band, the corresponding W2 magnitude is determined, thereby reflecting the sensitivity of the W1 band. This is also done for the W4 band using W3 in the same way as W1, if sources are resolved at these wavelengths, which in GAMA is rare (only 16 sources in G12 and G15). We note that the W1 and W3 bands cannot be matched in this way since the flux at these wavelengths is produced by different physical processes (evolved stars vs. PAH features).
Aperture corrections are applied to isophotal measurements as detailed in the Explanatory Supplement to the WISE All-Sky Data Release Products111http://{WISE˝2.ipac.caltech.edu/docs/release/allsky/expsup/sec4$_$4c.html$#$apcor.
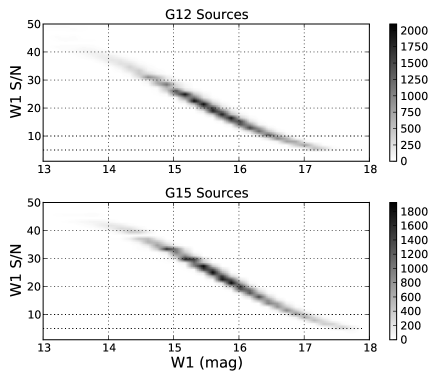
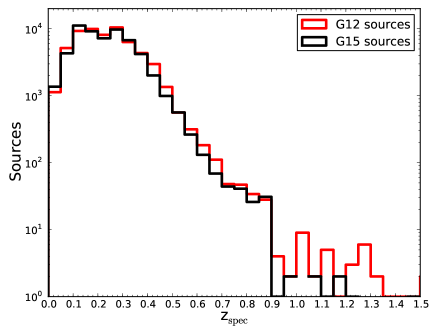
In Figure 3 we plot the signal-to-noise ratio (SNR) for the G12 and G15 fields; due to the additional 2 frame coverage the G15 field has higher signal-to-noise detections compared to G12 at a given W1 magnitude. The magnitude sensitivity limit in the W1 band for the G12 field is 16.6 (10-), 17.3 (5-) and for G15, 17.0 (10-) and 17.7 (5-). The combined fields have a 10-sigma magnitude sensitivity limit of 16.6 or 71 Jy. The redshift distribution of sources in the two fields (excluding upper limits) is shown in Figure 4. Since the G15 field is more sensitive, the peak of the distribution is shifted to a slightly higher redshift compared to G12. The two fields show very similar redshift distributions for (Figure 4b), although the G12 matches have relatively more high- sources.
3.5. Blending
Point sources are both passively and actively deblended by the WISE pipeline and the WISE All-Sky catalog provides the na and nb blending flags where a value of “0” indicates no active deblending has been performed, and “1” if sources have been deblended; deblending introduces an additional uncertainty on the measurement provided (nb is the number of components that were deblended).
However, an additional flag is needed to indicate where WISE cannot distinguish between GAMA sources (one WISE source for multiple GAMA sources) and where contamination is expected to be high since more than one GAMA source lies within the WISE beam. As such, we use an additional blending flag as determined by the proximity of neighboring GAMA-WISE sources. Sources within 5″ are viewed as a catastrophic blend due to the size of the WISE beam and multiple GAMA sources will probably have the same WISE source matched to it and/or have a highly uncertain match. A source within 15″ indicates a potential blend or contamination and is also flagged. For the analysis in this study we remove all flagged sources from our sample ( 6% of G12 and G15) to ensure the cleanest WISE photometry, but may bias the sample against the densest environments.
3.6. Rest Frame Colours
Rest-frame colours are determined using the GAMA redshift by building an SED (Spectral Energy Distribution) combining the optical, near-infrared and mid-infrared flux densities and fitting to an empirical template library, consisting of 126 galaxy templates, of local well-studied and morphologically diverse galaxies (e.g. SINGS, the Spitzer Infrared Nearby Galaxy Survey Kennicutt et al., 2003) from Brown et al. (2013). The templates are constructed from optical and Spitzer spectroscopy, with matched aperture photometry from GALEX (Martin et al., 2005), Swift (UVOT; Roming et al., 2005), SDSS, 2MASS, Spitzer (Werner et al., 2004) and WISE, combined with MAGPHYS (da Cunha et al., 2008). The WISE relative spectral response curves are from Jarrett et al. (2011) and are available as part of the WISE Explanatory Supplement.
The best template fit is determined by minimising the function that describes the difference between the flux density in the measured band, and the model-template flux density. Each resulting best-fit is assigned a normalised score derived from the reduced minimisation, with the most consistent fits having values of and relatively poor fits with scores of . In the sections that follow we use only those sources with a score , although the fitting accuracy is minimally important for nearby galaxies (i.e. with low rest-frame color corrections).
4. Results
4.1. WISE Colours of the G12 and G15 Fields

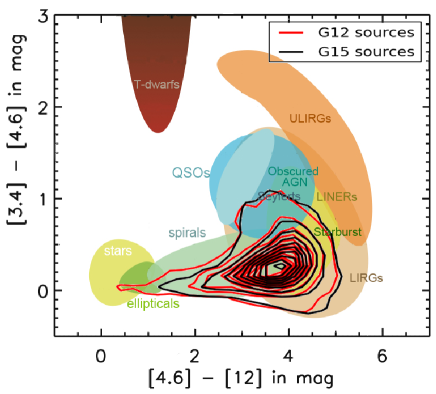
As shown by Jarrett et al. (2011), the 3.4µm, 4.5µm and 12µm bands of WISE can be combined in a mid-infrared color-color diagram (Figure 5); the shortest bands are sensitive to the evolved stellar population and hot dust, therefore their color indicates increased activity (AGN or starburst). The 12µm band is dominated by the 11.3µm PAH, as well as the dust continuum, sensitive to star formation. This color-color diagnostic is therefore useful to separate galaxy populations, particularly old stellar population-dominated, star-forming and systems dominated by AGN-activity (Jarrett et al., 2011; Stern et al., 2012). In Figure 5a the observed colors of the G12 and G15 are shown, and the k-corrected version, Figure 5b, shows the distribution of the rest-frame colors. Both fields have similar distributions, biased towards star-forming systems. This is not surprising given the optical selection of the GAMA sample. Heavily obscured galaxies, notably Ultra-luminous Infrared Galaxies (ULIRGS) are absent due to the insensitivity (selective extinction) of SDSS and GAMA optical catalogs. Systems globally dominated by AGN-activity also appear sparse within the sample; this is consistent with the findings of Gunawardhana et al. (2013) where spectroscopically-identified AGN make up of the GAMA I emission-line catalog (see also Lara-López et al., 2013).
4.2. Aggregate Stellar Mass Estimation
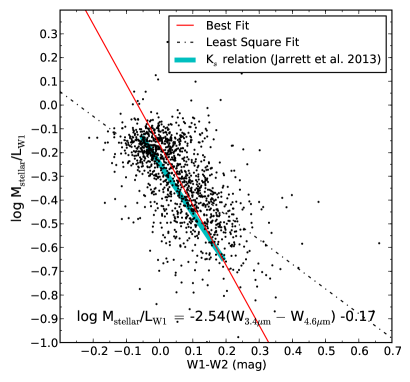
The 3.4µm band of WISE is dominated by the light from old stars and can be used as an effective measure of stellar mass (Jarrett et al., 2013). To explore this further, we calculate the ‘in-band’ luminosity for W1, i.e. the luminosity of the source as measured relative to the Sun in the W1 band, and use the stellar masses for GAMA as determined by Taylor et al. (2011) to determine a mass-to-light (M/L) ratio. These stellar masses are best constrained for (Taylor et al., 2011) and we apply this cut to our sample. As shown by Jarrett et al. (2013), the stellar mass-to-light has a linear trend with WISE W1W2 and W2W3 color, reflecting systematic M/L differences between passive and star-forming systems.
In order to empirically calibrate a relation we require high signal-to-noise measurements and additionally use only the rest-frame W1W2 color since the detection rate is much higher in W2 compared to W3. We apply a S/N cut of 13.5 in W1 and W2 and remove known AGN (from the GAMA I spectroscopy measurements of Gunawardhana et al., 2013) and also systems with WISE colors consistent with AGN activity dominating their global colors (W1W2) as discussed by Stern et al. (2012).
The first population we investigate are resolved, low- galaxies, shown in Figure 6a. We illustrate the danger of a least-squares minimisation fit compared to a bivariate-Gaussian, maximum-likelihood (or ‘best’ fit) line (Taylor et al., 2013; Hogg et al., 2010). Throughout the paper we plot both the least-squares and maximum-likelihood lines to show the large discrepancies that may exist; we provide relations for the maximum-likelihood (or best fit) only. We find very good agreement with the Mstellar/LW1 relation of Jarrett et al. (2013) based on their relatively small sample of 17 galaxies and with stellar masses effectively derived from 2 band photometry. Our relation for resolved low- sources is:
| (1) |
with
where M is the absolute magnitude of the source in W1, M, and reflects the rest-frame color of the source.
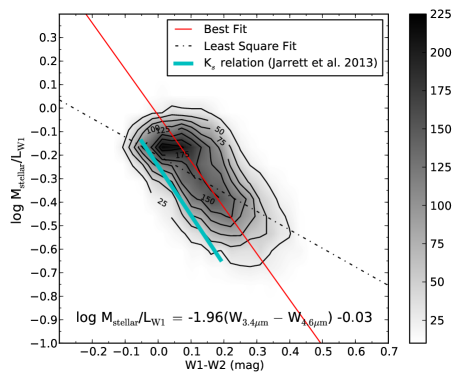
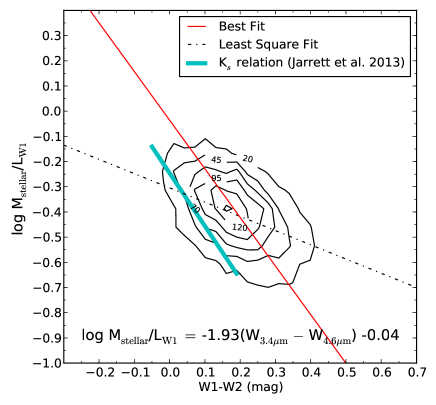
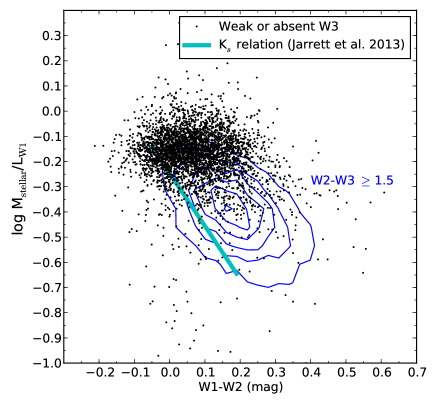
For comparison to the resolved sample, in Figure 6b we show all sources that meet our S/N selection criterion and redshift cut, which shows the distribution to be shifted to “warmer” W1W2 colors i.e. signifying systems with increased activity such as star-formation or low-power AGN. In addition, the contours suggest that the distribution is made up of two populations, most probably due to passive galaxies having a larger mass-to-light ratio than disk-dominated and dwarf galaxies. We investigate this further in Figure 7 where we make a color-distinction based on the W3 measurement. By selecting galaxies with W2W3 (see Figure 5) we choose systems that are most likely dominated by star formation. These selected types show a clear trend with mass-to-light (Figure 7a), but lie parallel and offset to the relation of Jarrett et al. (2013). But now including the passive galaxies, Figure 7b, we see a clear clustering around a fixed mass-to-light ratio of .
We conclude that the best-fit for our entire sample is:
| (2) |
and for star-forming (lower mass-to-light) systems only:
| (3) |
This likely explains the shift observed in the relation for resolved sources and the entire field sample. The resolved sources are relatively nearby and will be a mix of passive and star-forming systems. However, at higher redshifts we add relatively more star-forming galaxies (higher infrared luminosity) causing a larger spread in W1W2 color. Notably galaxies with higher star formation rates will have a larger W1W2 color due to more hot dust emission giving a brighter W2 measurement. Also, at higher redshifts we will preferentially detect galaxies with higher star formation rates (see next section). It should be noted that AGN activity would have a similar effect (as shown by the upward trend in Figure 5b) and some contamination from nuclear activity is inevitable.
In Figure 8 we plot the residuals of the GAMA stellar masses (used to calibrate the WISE relation in equation 2) and the WISE-derived values themselves. The mass estimates agree within a factor of 1.2 at M⊙ (with a standard deviation of 0.5), within a factor of 0.98 at M⊙ (with a standard deviation of 0.4) and a factor of 0.96 at M⊙ (with a standard deviation of 0.4). For stellar masses M⊙ the WISE-derived masses appear overall lower than the GAMA stellar masses. This is probably unsurprising given that the sample is dominated by star-forming galaxies (see Figure 5) and the WISE 3.4µm band is sensitive to the light from evolved stars in passively evolving galaxies.
4.3. Star Formation Rate Comparisons
4.3.1 22µm Warm Dust Continuum
IRAS, ISO and Spitzer revolutionised our understanding of dust emission as a tracer of star formation. In the mid-infrared, the Spitzer MIPS 24µm band measures the warm dust continuum excited by hot, young stars and is therefore sensitive to recent star formation, as well as AGN-activity. Numerous studies have investigated its stability as a measure of SFR (see e.g. Alonso-Herrero et al., 2006; Calzetti et al., 2007; Rieke et al., 2009) and we are able to transfer this understanding to WISE and its 22µm band.
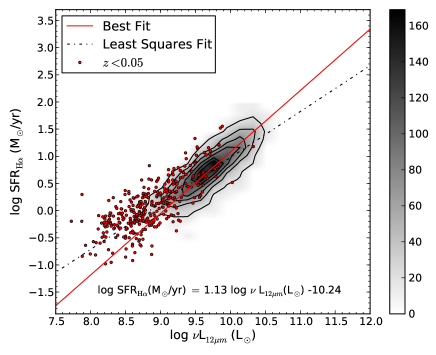
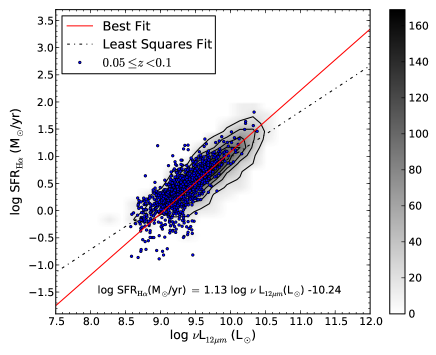
We determine the luminosity density (Lν) for the 22µm band and normalise by the total solar luminosity (L⊙= 3.8391026 W). The W4 band is the least sensitive WISE band, but we impose a S/N cut of 7 to ensure high quality photometry. Sources flagged as AGN based on optical spectroscopy diagnostics are removed from the sample. Cross-matching these sources with star formation rates available for GAMA I, using sources with SFR between 0.1 and 100 M⊙ yr-1 (see Gunawardhana et al., 2013), yields the best-fit relation shown in Figure 9. The optical star formation rates are determined from H equivalent widths applying an extinction-correction based on the Balmer decrement (full details can be found in Gunawardhana et al., 2013) and are sampled to (i.e. beyond which H is redshifted out of the observed spectral range). Galaxies where the H line is contaminated by atmospheric O2 (A band) absorption, in the redshift range 0.155 0.170 are not included in the sample as recommended in Gunawardhana et al. (2013). The points in Figure 9 are color-coded according to Balmer decrement and on average higher infrared luminosities correspond to higher Balmer decrements (i.e., increased dust obscuration). However, without detailed knowledge of the dust geometry this is merely a crude comparison (see also Wijesinghe et al., 2011a, b), and as we discuss below, biases due to extinction are probably in play at higher redshifts. Balmer decrement has also been shown to be correlated with stellar mass, stellar mass surface density and metallicity (see for example, Boselli et al., 2013)
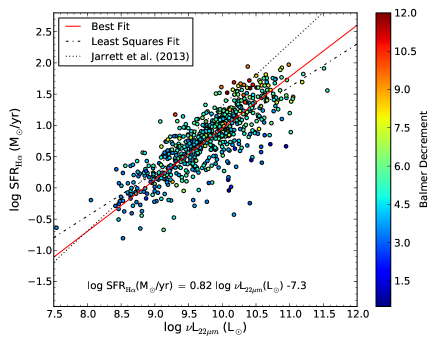
Figure 9 also shows the linear fit of Jarrett et al. (2013), where the WISE 22µm -based SFR relation was calibrated using Spitzer 24µm photometry and the relation of Rieke et al. (2009). This fit is somewhat steeper, likely explained by the distinction made by Rieke et al. (2009) based on total infrared luminosity of the source and the relatively small number of sources in the Jarrett et al. (2013) sample (but which also included Local Group dwarf galaxies). The best fit to the GAMA sample distribution is:
| (4) |
4.3.2 12µm ISM Tracer
Infrared-luminous sources will be detected by WISE 22µm out to moderate redshifts ( 2 to 3), but most typical galaxies would not. Hence there is a strong bias for W4 detections to be luminous galaxies (LIRGS and ULIRGS), which are highly obscured at optical wavelengths. The WISE 12µm band, on the other hand, has greater sensitivity by comparison (see Table 1) and also probes the ISM, sensitive to a larger (representative) sampling of galaxies, and thus making it potentially the primary star formation indicator for WISE. The dominant feature within this W3 band is the 11.3µm PAH (polycyclic aromatic hydrocarbon), and to a lesser extent the Neii emission line. This PAH is large, neutral and excited by ultraviolet radiation from young stars, as well as radiation from older, evolved stars (see, for example, Kaneda et al., 2008). Neii is associated with emission from H ii regions. Passive disks generally lack the 7.7µm PAH tracing current star formation, but still show prominent 11.3µm PAH features (see, for example, Cluver et al., 2013). As first demonstrated with Spitzer measurements (see for example Houck et al., 2007; Farrah et al., 2007), PAHs can be used to estimate star formation, although there is larger scatter (and potential biases) relative to the superior 24µm mid-infrared or 70µm far-infrared tracers. The WISE 12µm band is thus a powerful, yet also more problematic, tracer of recent star formation.
We proceed as with W4, but with a S/N cut of 10 in the W3 (12µm band), similarly color-coding to reflect Balmer decrement (Figure 10a). A contour plot of the distribution is shown in Figure 10b and the trend appears very tight for SFR . At low SFR and Lν, however, the distribution appears to flatten and probably accounts for the differences in slope between our relation and the least squares fit of Donoso et al. (2012).The relation of Jarrett et al. (2013) lies offset below our best fit, most likely as a result of relatively low SFR within their small sample (SFR ) of nearby galaxies. The best fit relation for the 12µm band is:
| (5) |
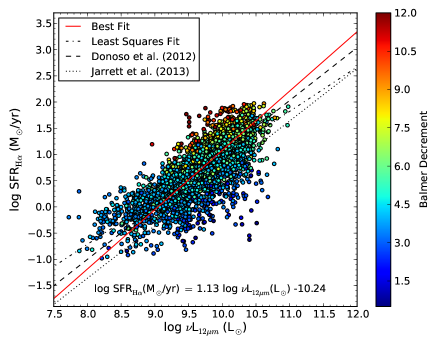
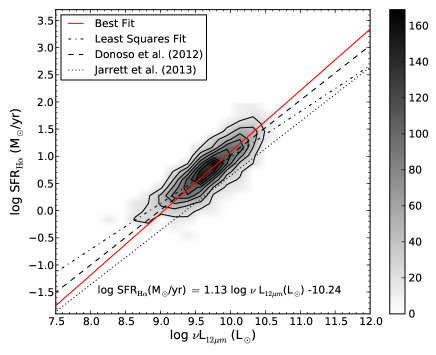
This flattening of the distribution in Figure 10 at low SFR is most likely a feature of the 11.3µm PAH tracer (since we do not observe it at 22µm) and is also observed by Lee et al. (2013) in their study.
Given that the 12 micron band emission appears too low for the given H SFR, a possible explanation is that the relative abundance of PAH molecules to big grain emission is diminished, due to low metalicity in these galaxies. If this is the case, we do not expect to see a similar effect at 22 micron, since this band is dominated by big grains in equilibrium with the strong radiation fields inside star formation regions. Indeed, the 22µm sample of Lee et al. (2013) does not show such a flattening.
An alternative explanation would be that in a low SFR regime, the preponderance of the diffuse medium increases with respect to the star-formation component of the interstellar medium (galaxies are more quiescent). Bear in mind that the 24µm warm dust emission is powered by the UV radiation fields from the massive stars inside the star forming regions, while the 12µm emission is mainly powered by the diffuse interstellar radiation fields (Popescu et al., 2011). Thus, the PAH and small grains emission seen in the 12µm band increases with increasing SFR, but this increase is mediated by the propagation of the UV photons in the diffuse ISM, while the 24µm emission directly traces star formation regions, as does the Balmer line corrected H emission from which the SFRs are derived.
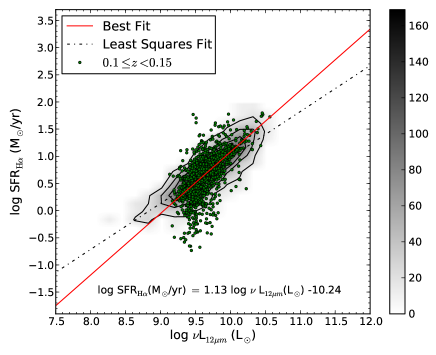
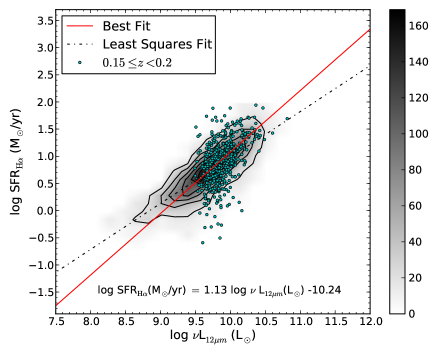
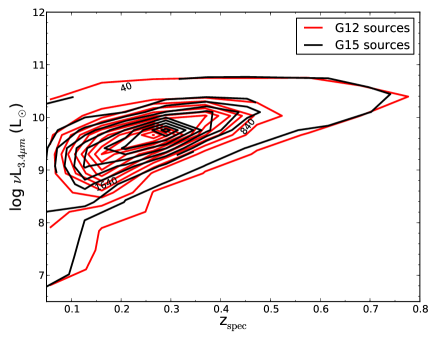
To investigate this further we show individual points for contiguous redshift slices overplotted on the full sample in Figure 11; this serves as an indication of how the distribution is built up. The flattening at low SFR appears to be a feature of nearby sources alone (Figure 11a) supporting the hypothesis that we are observing the PAH features and small grain emission of relatively quiescent galaxies, dominated by the diffuse ISM. The flattening in the slope is not detected at higher redshifts () as these galaxies have more star formation activity (i.e. more clumpy). In Figures 11b-d we see how as we move to higher redshifts, we sample systems with higher and, on average, higher SFRs. The relatively low number of sources in Figure 11d reflects the atmospheric contamination affecting sources at redshifts of .
The higher infrared luminosity in these sources, however, also indicate greater obscuration in the optical bands; this explains the sharp drop in H luminosities relative to W3, apparent in Figs. 10c and d with SFR(H) 3 M⊙ yr-1. Corrections using the Balmer decrement become ineffective when the extinctions are high, (Av ), which is why infrared tracers of obscured star formation and UV/optical tracers of unobscured star formation are best combined to estimate the total star formation rate.
5. Science with the GAMA-WISE Catalog
The GAMA-WISE catalog and empirically-derived relations can be used any number of ways to probe the behaviour of large populations of galaxies. To illustrate, we highlight below how WISE can be used to study the specific star formation of galaxies.
5.1. Specific Star Formation
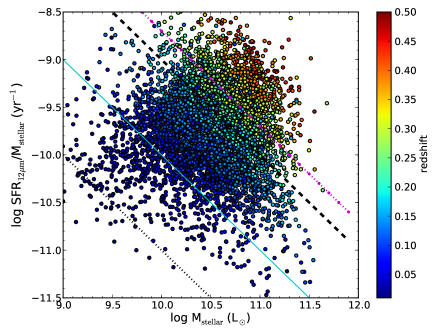
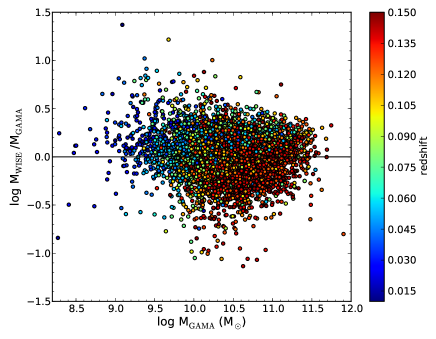
We can investigate the specific star formation rate (sSFR) of the entire sample by using -derived star formation rates (equation 5) and the GAMA stellar masses (Taylor et al., 2011). In Figure 12 we show specific star formation as a function of stellar mass, color-coded by redshift. Two clear trends are seen: (1) lower mass galaxies are actively building their disks while massive galaxies have expended their gas reservoirs rendering mostly passive evolution (the “SFR-M⋆” relation) and (2) with increasing redshift, a shift to higher SFR for a given stellar mass as we capture these infrared-luminous systems. The behavior of star formation and specific star formation, as a function of stellar mass and redshift, within the GAMA sample is explored in detail in Bauer et al. (2013) and Lara-López et al. (2013). The observed increase in mean sSFR of star-forming galaxies with increasing redshift is well-established (see for example Noeske et al., 2007; Elbaz et al., 2007; Rodighiero et al., 2010) and we illustrate here that the GAMA-WISE sample is sufficiently large and diverse to explore galaxy evolution between the local universe and 0.5.
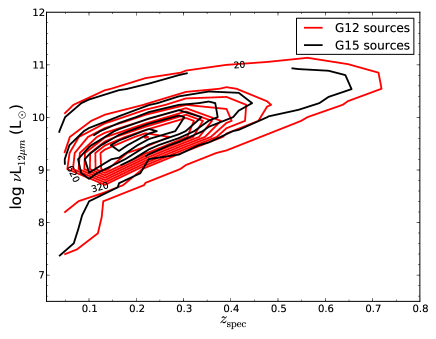
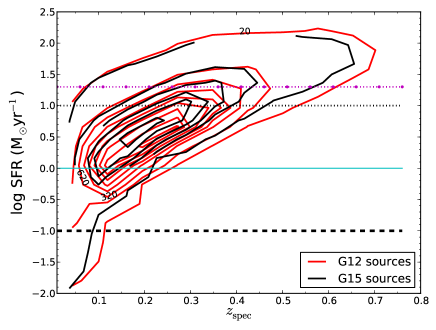
From the relation of Bouché et al. (2010), the “main-sequence” of galaxies with stellar mass of 1011 M⊙ at have typical SFRs of M⊙yr-1. Converting to luminosity density by way of equation (5) gives log L⊙. As illustrated in Figure 13, WISE can detect these systems that are within the GAMA-WISE sample. A luminosity density of log L⊙ corresponds to a flux density of 0.24 mJy or 12.8 mag; using the S/N detection statistics of the G15 sources, WISE will detect this source with S/N. The magnitude sensitivity limit in the W3 band for the G12 field is 13.2 (10-), 14.0 (5-) and for G15, 13.8 (10-) and 14.5 (5-).
5.2. Specific Star Formation of Galaxies in Pairs
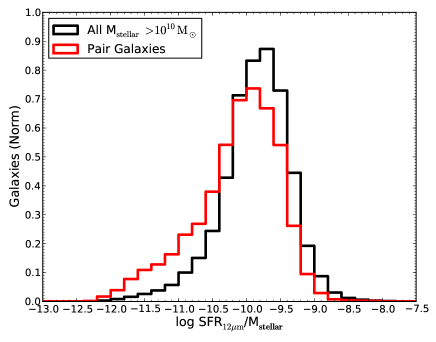
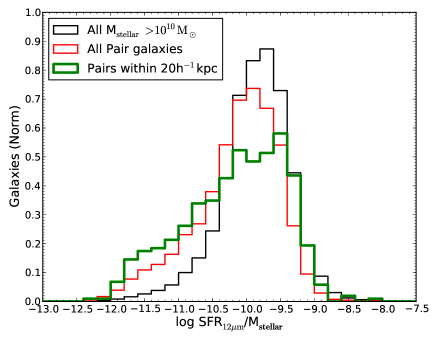
The 12µm-derived star formation rates, computed from equation (5), can also be used to investigate sSFR trends within populations of GAMA galaxies. For example, we use the updated GAMA II Galaxy Group Catalogue (G3Cv6), as detailed in Robotham et al. (2011), to isolate galaxies that reside within a pair. In G3C a galaxy pair is defined as two galaxies within 100 , in physical separation, and 1000 km s-1 in velocity separation. Figure 14 is a normalised histogram of all galaxies in the sample with stellar mass 1010M⊙ and the subset that reside in a pair (17,475 galaxies) and a close pair (i.e. separation ). We note that potential blends (as outlined in § 3.5) are removed.
The striking feature of Figure 14a is that galaxies that reside within a pair appear to have, on average, lower sSFR than a typical GAMA galaxy of the same mass, suggesting that instead of star formation being enhanced in these systems, it is suppressed. Although initially counter-intuitive, and contrary to studies of local galaxy pairs compared to field control samples (see, for example, Ellison et al., 2013), it should be noted that of GAMA galaxies reside within a group, with numerous mechanisms at play. Within the context, therefore, of the environment of a typical galaxy this highlights the complexity of interacting and merging systems and is discussed further in a detailed study of merging and interacting galaxies within GAMA (Robotham et al., in prep.). We note that a lack of SFR enhancement has emerged from studies of galaxy pairs probing higher redshift samples (see, for example, Xu et al., 2012), with one suggested explanation that higher gas fractions at higher redshift reduce the efficiency of torque-driven gas infall.
Further we include in Figure 14b a histogram of galaxies within 20 kpc/h of their neighbor, as compared to the distribution from Figure 14a. It appears that this subset shows a broader range of sSFRs compared to the larger sample of galaxies in pairs, and may even be bimodal, consisting of suppressed systems and enhanced systems. Adding this kinematic trigger to galaxy evolution is clearly a complex process, but crucial to understand how galaxies evolve in the group environment. Finally, we note that blending limitations of the WISE data within pairs that have a smaller separation make this parameter space uncertain, but optical tracers will be exploited here in forthcoming GAMA papers.
6. Conclusions
We have detailed the procedure for creating a source-matched catalog between galaxies in the GAMA G12 and G15 fields, and WISE photometry. In particular we have outlined how best to extract photometry for low signal to noise, unresolved and resolved sources in the WISE All-Sky Catalog. Complete GAMA-WISE catalogs for the G09, G12 and G15 fields will be made available through the GAMA Public Releases (see http://www.gama-survey.org/).
Using the WISE measurements and matched GAMA galaxies in the G12 and G15 fields, we have investigated the following:
-
•
The WISE color distribution for the sample shows most systems are globally dominated by star formation, with few passive and AGN-dominated systems; this is consistent with the GAMA sample selection and spectroscopic sensitivity to higher redshift, star-forming galaxies.
-
•
Empirical relations of stellar mass as a function of 3.4µm4.6µm color for resolved sources, our entire sample and star formation-dominated galaxies only. We provide relations that can be applied to large samples for .
-
•
Star formation rate relations can be derived using 22µm and 12µm luminosities. The 12µm-derived SFR relation (equation 5) is a complex tracer of the ISM and should, however, be used with caution. We show that the distribution of galaxies in the 12µm luminosity and H SFR plane as a function of redshift are affected by selection effects and most probably dust geometry.
-
•
Specific star formation (using 12µm-derived SFRs) for the sample illustrates how the GAMA-WISE catalog detects only the most massive, highest star-forming systems at the highest redshifts. WISE is, however, able to detect star-forming main-sequence systems, of stellar mass 1011M⊙, to with S/N .
-
•
Controlling for stellar mass, galaxies with an associated neighbor appear to experience, on average, a shift to lower specific star formation. Extracting pairs with relatively small separations ( 20 kpc) suggests a broader behaviour consistent with populations experiencing either star formation suppression or enhancement.
Acknowledgements
MEC and THJ acknowledge support from the National Research Foundation (South Africa). MEC, MLL, MO, AEB and MJIB acknowledge support from the Australian Research Council (FS110200023, FS100100065, FT100100280). MLPG acknowledges support from a European Research Council Starting Grant (DEGAS-259586).
This publication makes use of data products from the Wide-field Infrared Survey Explorer, which is a joint project of the University of California, Los Angeles, and the Jet Propulsion Laboratory/California Institute of Technology, funded by the National Aeronautics and Space Administration.
GAMA is a joint European-Australasian project based around a spectroscopic campaign using the Anglo-Australian Telescope. The GAMA input catalog is based on data taken from the Sloan Digital Sky Survey and the UKIRT Infrared Deep Sky Survey. Complementary imaging of the GAMA regions is being obtained by a number of independent survey programs including GALEX MIS, VST KiDS, VISTA VIKING, WISE, Herschel- ATLAS, GMRT and ASKAP providing UV to radio coverage. GAMA is funded by the STFC (UK), the ARC (Australia), the AAO, and the participating institutions. The GAMA website is http://www.gama-survey.org/.
References
- Abazajian et al. (2009) Abazajian, K. N., Adelman-McCarthy, J. K., Agüeros, M. A., et al. 2009, ApJS, 182, 543
- Abazajian et al. (2003) Abazajian, K., Adelman-McCarthy, J. K., Agüeros, M. A., et al. 2003, AJ, 126, 2081
- Alonso-Herrero et al. (2006) Alonso-Herrero, A., Rieke, G. H., Rieke, M. J., et al. 2006, ApJ, 650, 835
- Assef et al. (2013) Assef, R. J., Stern, D., Kochanek, C. S., et al. 2013, ApJ, 772, 26
- Baldry et al. (2010) Baldry, I. K., Robotham, A. S. G., Hill, D. T., et al. 2010, MNRAS, 404, 86
- Bauer et al. (2013) Bauer, A. E., Hopkins, A. M., Gunawardhana, M., et al. 2013, MNRAS, 434, 209
- Brown et al. (2013) Brown, M. J. I., Moustakas, J., Smith, J.-D. T., et al. 2013, arXiv:1312.3029
- Boselli et al. (2013) Boselli, A., Hughes, T. M., Cortese, L., Gavazzi, G., & Buat, V. 2013, A&A, 550, A114
- Bouché et al. (2010) Bouché, N., Dekel, A., Genzel, R., et al. 2010, ApJ, 718, 1001
- Bruzual & Charlot (2003) Bruzual, G., & Charlot, S. 2003, MNRAS, 344, 1000
- da Cunha et al. (2008) da Cunha, E., Charlot, S., & Elbaz, D. 2008, MNRAS, 388, 1595
- Calzetti et al. (2007) Calzetti, D., Kennicutt, R. C., Engelbracht, C. W., et al. 2007, ApJ, 666, 870
- Cluver et al. (2013) Cluver, M. E., Appleton, P. N., Ogle, P., et al. 2013, ApJ, 765, 93
- Colless et al. (2001) Colless, M., Dalton, G., Maddox, S., et al. 2001, MNRAS, 328, 1039
- Cutri et al. (2012) Cutri, R. M., Wright, E. L., Conrow, T., et al. 2012, Explanatory Supplement to the WISE All-Sky Data Release Products, 1
- Donoso et al. (2012) Donoso, E., Yan, L., Tsai, C., et al. 2012, ApJ, 748, 80
- Driver et al. (2009) Driver, S. P., Norberg, P., Baldry, I. K., et al. 2009, Astronomy and Geophysics, 50, 050000
- Driver et al. (2011) Driver, S. P., Hill, D. T., Kelvin, L. S., et al. 2011, MNRAS, 413, 971
- Elbaz et al. (2007) Elbaz, D., Daddi, E., Le Borgne, D., et al. 2007, A&A, 468, 33
- Ellison et al. (2013) Ellison, S. L., Mendel, J. T., Patton, D. R., & Scudder, J. M. 2013, MNRAS, 435, 3627
- Farrah et al. (2007) Farrah, D., Bernard-Salas, J., Spoon, H. W. W., et al. 2007, ApJ, 667, 149
- Gunawardhana et al. (2013) Gunawardhana, M. L. P., Hopkins, A. M., Sharp, R. G., et al. 2013, MNRAS, 433, 2764
- Gunawardhana et al. (2011) Gunawardhana, M. L. P., Hopkins, A. M., Sharp, R. G., et al. 2011, MNRAS, 415, 1647
- Gurkan et al. (2013) Gurkan, G., Hardcastle, M. J., & Jarvis, M. J. 2013, arXiv:1308.4843
- Hill et al. (2011) Hill, D. T., Kelvin, L. S., Driver, S. P., et al. 2011, MNRAS, 412, 765
- Holwerda & Blyth (2010) Holwerda, B.W. & Blyth, S.-L. 2010, arXiv:1007.4101
- Hogg et al. (2010) Hogg, D. W., Bovy, J., & Lang, D. 2010, arXiv:1008.4686
- Hopkins et al. (2013) Hopkins, A. M., Driver, S. P., Brough, S., et al. 2013, MNRAS, 430, 2047
- Houck et al. (2007) Houck, J. R., Weedman, D. W., Le Floch́, E., & Hao, L. 2007, ApJ, 671, 323
- Jarrett et al. (2013) Jarrett, T. H., Masci, F., Tsai, C. W., et al. 2013, AJ, 145, 6
- Jarrett et al. (2012) Jarrett, T. H., Masci, F., Tsai, C. W., et al. 2012, AJ, 144, 68
- Jarrett et al. (2011) Jarrett, T. H., Cohen, M., Masci, F., et al. 2011, ApJ, 735, 112
- Jarrett et al. (2000) Jarrett, T. H., Chester, T., Cutri, R., et al. 2000, AJ, 119, 2498
- Jones et al. (2004) Jones, D. H., Saunders, W., Colless, M., et al. 2004, MNRAS, 355, 747
- Kaneda et al. (2008) Kaneda, H., Onaka, T., Sakon, I., et al. 2008, ApJ, 684, 270
- Kennicutt et al. (2003) Kennicutt, R. C., Jr., Armus, L., Bendo, G., et al. 2003, PASP, 115, 928
- Lara-López et al. (2013) Lara-López, M. A., Hopkins, A. M., López-Sánchez, A. R., et al. 2013, MNRAS, 434, 451
- Lawrence et al. (2007) Lawrence, A., Warren, S. J., Almaini, O., et al. 2007, MNRAS, 379, 1599
- Lee et al. (2013) Lee, J. C., Hwang, H. S., & Ko, J. 2013, ApJ, 774, 62
- Masci (2013) Masci, F. 2013, Astrophysics Source Code Library, 2010
- Marsh & Jarrett (2012) Marsh, K. A., & Jarrett, T. H. 2012, PASA, 29, 269
- Martin et al. (2005) Martin, D. C., Fanson, J., Schiminovich, D., et al. 2005, ApJ, 619, L1
- Meidt et al. (2012) Meidt, S. E., Schinnerer, E., Knapen, J. H., et al. 2012, ApJ, 744, 17
- Meyer et al. (2004) Meyer, M. J., Zwaan, M. A., Webster, R. L., et al. 2004, MNRAS, 350, 1195
- Noeske et al. (2007) Noeske, K. G., Weiner, B. J., Faber, S. M., et al. 2007, ApJ, 660, L43
- Popescu et al. (2011) Popescu, C. C., Tuffs, R. J., Dopita, M. A., et al. 2011, A&A, 527, A109
- Reid et al. (1991) Reid, I. N., Brewer, C., Brucato, R. J., et al. 1991, PASP, 103, 661
- Rieke et al. (2009) Rieke, G. H., Alonso-Herrero, A., Weiner, B. J., et al. 2009, ApJ, 692, 556
- Robotham et al. (2011) Robotham, A. S. G., Norberg, P., Driver, S. P., et al. 2011, MNRAS, 416, 2640
- Robotham et al. (2010) Robotham, A., Driver, S. P., Norberg, P., et al. 2010, PASA, 27, 76
- Rodighiero et al. (2010) Rodighiero, G., Cimatti, A., Gruppioni, C., et al. 2010, A&A, 518, L25
- Roming et al. (2005) Roming, P. W. A., Kennedy, T. E., Mason, K. O., et al. 2005, Space Sci. Rev., 120, 95
- Schlegel et al. (1998) Schlegel, D. J., Finkbeiner, D. P., & Davis, M. 1998, ApJ, 500, 525
- Stern et al. (2012) Stern, D., Assef, R. J., Benford, D. J., et al. 2012, ApJ, 753, 30
- Taylor et al. (2013) Taylor, E. N., Hopkins, A. M., Baldry, I. K., et al. submitted
- Taylor et al. (2011) Taylor, E. N., Hopkins, A. M., Baldry, I. K., et al. 2011, MNRAS, 418, 1587
- Wijesinghe et al. (2011a) Wijesinghe, D. B., da Cunha, E., Hopkins, A. M., et al. 2011, MNRAS, 415, 1002
- Wijesinghe et al. (2011b) Wijesinghe, D. B., Hopkins, A. M., Sharp, R., et al. 2011, MNRAS, 410, 2291
- Werner et al. (2004) Werner, M. W., Roellig, T. L., Low, F. J., et al. 2004, ApJS, 154, 1
- Wheelock et al. (1994) Wheelock, S. L., Gautier, T. N., Chillemi, J., et al. 1994, NASA STI/Recon Technical Report N, 95, 22539
- Wright et al. (2010) Wright, E. L., Eisenhardt, P. R. M., Mainzer, A. K., et al. 2010, AJ, 140, 1868
- Xu et al. (2012) Xu, C. K., Shupe, D. L., Béthermin, M., et al. 2012, ApJ, 760, 72
- Yan et al. (2013) Yan, L., Donoso, E., Tsai, C.-W., et al. 2013, AJ, 145, 55
Appendix A Analysis of WISE Photometry for Nominally Resolved Sources
In order to understand the photometry of resolved and partially resolved sources in WISE we use several diagnostics. Since WISE is calibrated in the Vega system, images and all-sky catalogs, all comparisons are done as such.
A.1. Rfuzzy Defined
The Rfuzzy parameter is used to determine whether a source is resolved in the 3.4µm band of WISE (see § 3.2). The Rfuzzy parameter is measured in the following way:
-
1.
The source is rotated to determine the optimal 2nd moment parameters (Rmajor, Rminor, position angle of major axis)
-
2.
The source is divided along the minor axis into two halves: positive x, and negative x, where the central x position is the nominal position of the source
-
3.
Compute the 2nd order intensity-weighted moment for each half and derive the Rmajor for each half: Rmajora, Rmajorb
-
4.
Rfuzzy minimum(Rmajora, Rmajorb).
If Rfuzzy Rfuzzylimit, then the source is unresolved. The Rfuzzylimit is determined by measuring sources that are expected to be unresolved. For example, Figure 15 shows the Rfuzzy values for WISE sources in the GAMA G12 region with w1rchi22 which preferentially selects unresolved sources. The typical value for Rfuzzy is 10.0″ for high signal to noise point sources (e.g. stars), but the distribution can be used to identify the limit where resolvedness can be determined. A power series fit to the 2 mean of the distribution yields the Rfuzzylimit curve – points that lie above this curve are classified as resolved.
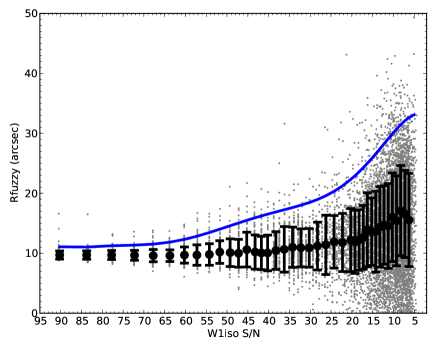
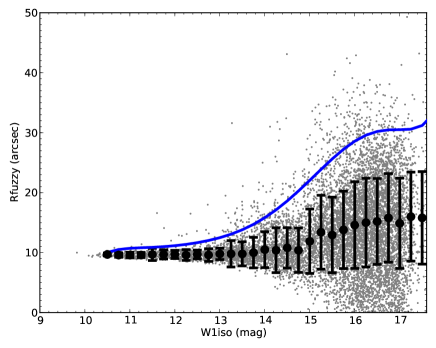
Rfuzzy can be defined in terms of isophotal signal to noise or isophotal magnitude. Given the differing exposure coverage (number of WISE frames that samples a given patch of sky) for the entire sky, the sensitivity limits vary depending on location on the sky. For this reason, a magnitude-dependent Rfuzzylimit curve will be sensitive to the WISE coverage and would need to be derived for each region. However, a signal to noise function is robust against this and therefore the curve shown in Figure 15a is used.
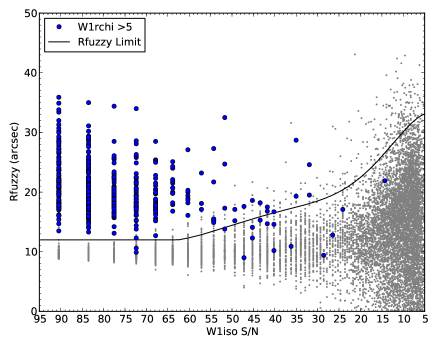
As a test of the performance of the Rfuzzy parameter, Figure 16 plots Rfuzzy for a sample from GAMA G12 expected to be dominated by resolved systems (based on w1rchi2). The majority of sources with w1rchi25 lie above the curve defined by the point sources in Figure 15a.
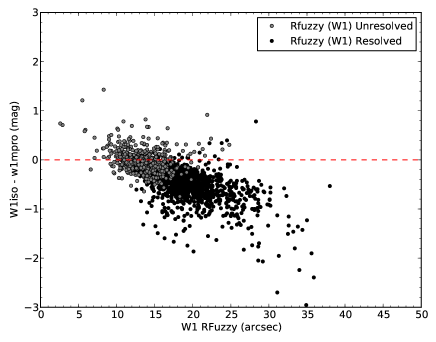
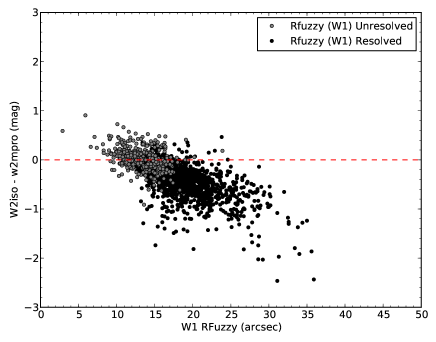
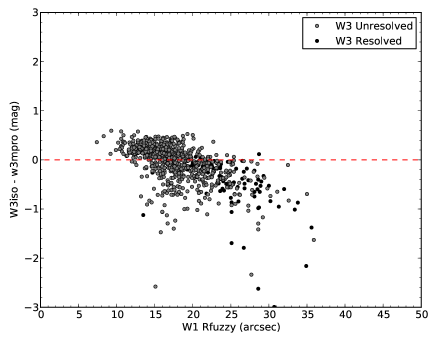
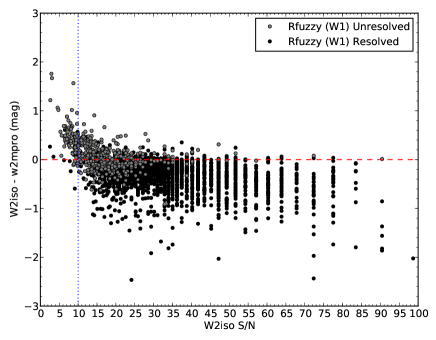
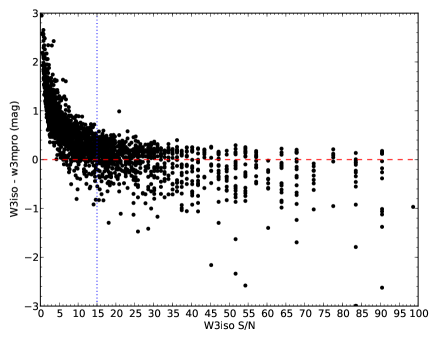
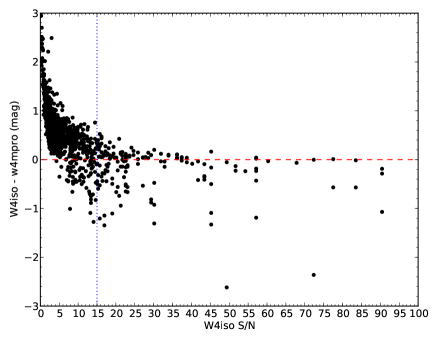
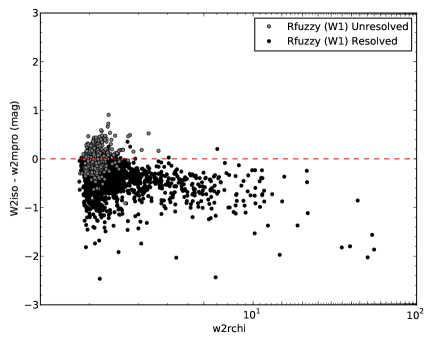
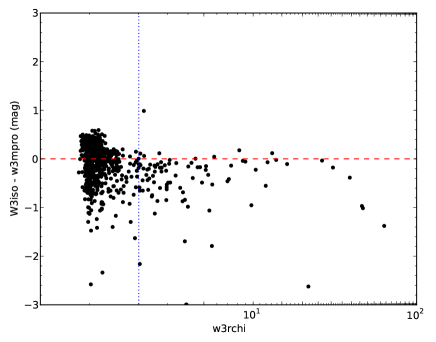
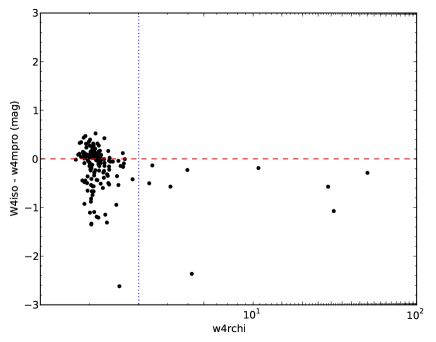
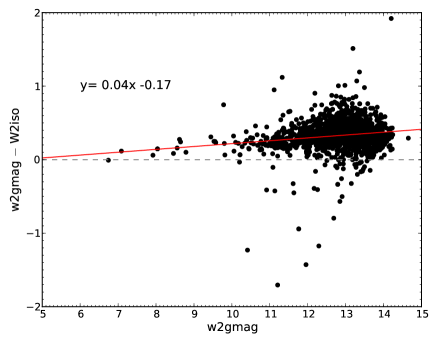
In Figure 17 we test 2590 sources in G15 chosen using the prescription of § 3, i.e. most of which are expected to be resolved in W1. This shows that the largest offset between the W1iso and w1mpro photometry measurements occurs for sources deemed resolved by the Rfuzzy parameter. This behavior is consistent with sources whose flux is underestimated by profile fitting i.e. resolved. Unresolved sources show the expected scatter around 0. In Figure 17c we see that few sources are resolved in the W3 band.
A.2. Behaviour of Resolved Photometry
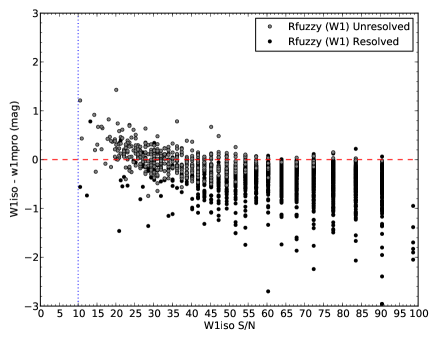
In order to establish the reliablity of isophotal photometry, we use our test sample (2590 potentially resolved sources from the G15 GAMA field). In Figure 18 we compare the difference between Wiso and wmpro photometry as a function of S/N ratio. At low S/N the isophotal measurement becomes unreliable – in some cases the fluxes are inflated, notably for W3 and W4 – due to contamination from background sources and wmpro provide the most robust measurement.
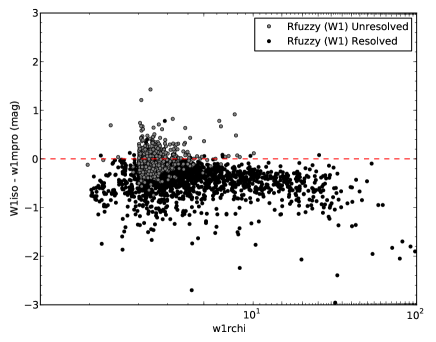
In Figure 19 we again use the difference between Wiso and wmpro photometry to illustrate that the sensitivity of the W1 and W2 bands prevents the w1rchi2 and w2rchi values from acting as a reliable discriminator of resolvedness. For W3 and W4, however, it can be used and the limits derived from the plots are indicated.
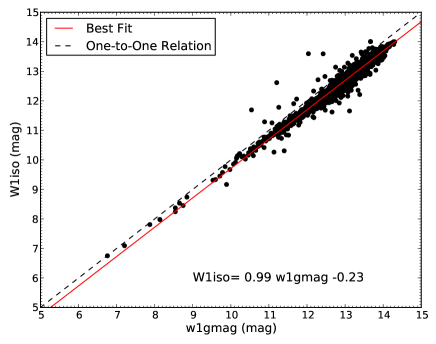
We explore the relationship between the isophotal photometry and the wgmag photometry for sources in the 2MASS XSC. Since the wgmags are measured using elliptical apertures with radii scaled to twice the 2MASS radii, this provides an indication of the additional sensitivity. We note that wgmags can be contaminated by nearby objects since no attempt is made to remove neighboring sources. In Figure 20 we show the difference between wgmag and Wiso photometry for resolved galaxies in G12 and G15. This shows that for fainter sources wgmag is brighter than Wiso, likely due to contamination.
Finally, in Figure 21 the WISE isophotal and 2MASS isophotal radii of resolved sources which clearly shows that the 1 isophotal radii are systematically larger than the 2MASS radii by a factor of 2 to 2.5. The largest offset occurs for the most compact 2MASS sources probably due to the increased sensitivity of WISE in the W1 and W2 bands resolving more of the galaxy relative to 2MASS.