Young stars in an old bulge: a natural outcome of internal evolution in the Milky Way
Abstract
The center of our disk galaxy, the Milky Way, is dominated by a boxy/peanut-shaped bulge. Numerous studies of the bulge based on stellar photometry have concluded that the bulge stars are exclusively old. The perceived lack of young stars in the bulge strongly constrains its likely formation scenarios, providing evidence that the bulge is a unique population that formed early and separately from the disk. However, recent studies of individual bulge stars using the microlensing technique have reported that they span a range of ages, emphasizing that the bulge may not be a monolithic structure. In this letter we demonstrate that the presence of young stars that are located predominantly near the plane is expected for a bulge that has formed from the disk via dynamical instabilities. Using an N-bodySPH simulation of a disk galaxy forming out of gas cooling inside a dark matter halo and forming stars, we find a qualitative agreement between our model and the observations of young metal-rich stars in the bulge. We are also able to partially resolve the apparent contradiction in the literature between results that argue for a purely old bulge population and those which show a population comprised of a range in ages; the key is where to look.
1 INTRODUCTION
The boxy/peanut-shaped bulge of the Milky Way was revealed in the star counts from the Two Micron All Sky Survey (2MASS) (López-Corredoira et al., 2005) and more recently has been mapped in detail across the inner extent using red clump stars (Wegg & Gerhard, 2013). It has been proposed that small boxy or peanut-shaped bulges form via internal evolution of the disk (Combes & Sanders, 1981). As the disk becomes unstable, it forms a rotating bar which buckles and heats the disk vertically (Raha et al., 1991). The orbits of the stars originally in the bar are extended vertically into orbits which now define the boxy/triaxial/peanut-shaped bulge. A number of properties of the bulge of the Milky Way have recently been shown to be consistent with the generic properties of N-body models that form a bulge via internal evolution from the redistributed stars of the disk. These include the kinematics of stars in the bulge (Howard et al., 2008; Kunder et al., 2012; Ness et al., 2013b) and the X-shaped profile (McWilliam & Zoccali, 2010; Nataf et al., 2010), which provide important observational constraints on models of formation (Shen et al., 2010; Ness et al., 2012; Li & Shen, 2012; Gardner et al., 2013). Another important observational constraint on the formation of the bulge is stellar ages.
Studies of the color-magnidtude diagrams of several fields in the bulge have shown that the best isochrone fits support a purely old ( Gyr) stellar population (i.e. Ortolani et al., 1995; Zoccali et al., 2003; Sahu et al., 2006; Clarkson et al., 2008; Brown et al., 2010; Valenti et al., 2013). This has been interpreted as evidence for a classical bulge population, formed rapidly at early times and before the disk, via mergers or dissipational collapse processes (Ortolani et al., 1995; Zoccali et al., 2003). Recent studies interpret different signatures of formation in the boxy/peanut morphology and the stellar ages and metallicities to argue for a composite bulge. These studies (i.e Babusiaux et al., 2010; Hill et al., 2011) conclude that dissipational collapse formation has played an important role in the formation of the bulge, in addition to the dynamical instability processes. Classical bulges are easily formed in CDM simulations, which very well describe the universe on scales larger than 1Mpc. However, the density distribution of the stars across the bulge implies that if there is any component of the bulge that has formed via mergers, as CDM formation theory would predict, it is a relatively minor population (Wegg & Gerhard, 2013). Additionally, although individual disk galaxies with small bulges can be produced in CDM simulations by invoking feedback (Governato et al., 2008; Scannapieco et al., 2008; Brook et al., 2012; Doménech-Moral et al., 2012), the merging and hierarchical processes generally produce very large central bulges that are unlike the Milky Way. Given that disk galaxies with no bulges or with relatively small boxy or peanut-shaped bulges like the Milky Way are quite common (Lütticke et al., 2004), their formation route in the context of the evolution of the universe is critical for our understanding of galaxy formation. To constrain the formation processes of the Milky Way and interpret the signatures of formation, including ages, comparisons to models of individual galaxies are key.
2 AGES OF INDIVIDUAL BULGE STARS
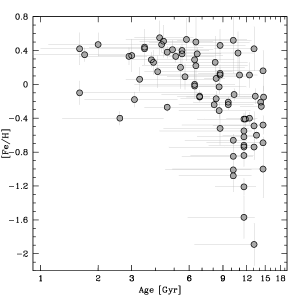
The old stellar ages reported from the photometric studies seem at odds with the studies which exploit microlensing events of the dwarf and subgiant bulge stars, which uniquely allow ages of individual bulge stars to be determined. The microlensing studies have demonstrated that the more metal-rich stars in the bulge ([Fe/H]–0.4 dex) show a range in stellar ages from Gyrs, as shown in Figure 1 (Bensby et al., 2011, 2013). Young stars are not expected to be present for a classical bulge population, formed rapidly at early times and before the disk, via dissipational or merger processes. If the bulge formed via internal disk instabilities, rather than mergers, however, young stars should be present due to ongoing star formation in the plane.
In this letter, we compare the age distribution of the microlensed dwarf stars, which show a range of ages, to a high resolution simulation that includes star formation, as described in Section 3. We examine the stellar age distribution of the model as a function of height from the plane and [Fe/H] in Section 4 and test the apparent contradiction that exists between the range of ages reported from the microlensing studies and the old population suggested by the photometric studies.
3 THE GALACTIC MODEL
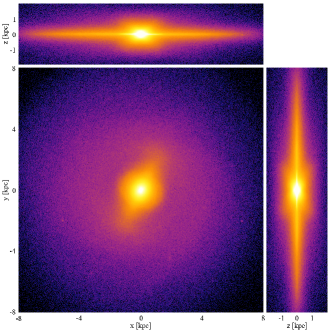
Interpreting the observational data requires models that include star formation. Until now, such predictions have come from semi-analytic models or from cosmological simulations which generally do not yet reach a resolution to resolve boxy/peanut-shaped structures. Here we use a self-consistent dissipational collapse simulation that is a higher resolution version of previous models (Roškar et al., 2008), with 107 stars and a spatial resolution of 50 pc. In this model, a hot gas corona in a Navarro Frenk White (NFW) (Navarro et al., 1997) dark matter halo cools under self-gravity and forms a disk galaxy with a small, weakly triaxial bulge. The evolution of this model in isolation thus reflects internal processes only as there are no interacting companions during the evolution. The model was presented in Gardner et al. (2013), the evolution of its nucleus will be presented in Cole et al., 2014 (in preparation) and a more detailed analysis of the evolution will be presented elsewhere (Ness et al., 2014). For this paper the model is studied after evolving for 10 Gyr. We emphasise, this model was not designed to match the Milky Way and our analysis is qualitative. However, we find a remarkable qualitative agreement with a number of observational signatures. We have scaled the model (by a factor of 1.2) to match the bar size to that of the Milky Way, of about 3.5 kpc (Robin et al., 2012) and placed the bulge at 8 kpc away from the Sun, at an angle of 27 degrees with respect to the line of sight (Wegg & Gerhard, 2013). The model is shown in Figure 2 with the Sun placed at y = –8 kpc. It qualitatively reproduces the observed kinematic profile that is generic to models of bulges formed via internal evolution of the disk (Shen et al., 2010; Ness et al., 2013b) as well as the X-shaped profile that is seen in the Milky Way (Gardner et al., 2013).
4 COMPARISON TO OBSERVATIONAL DATA
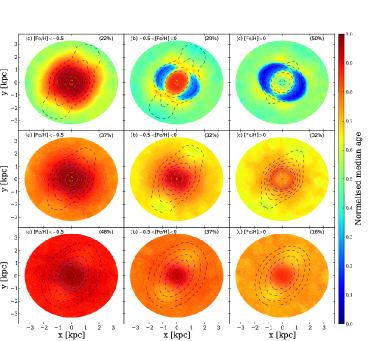
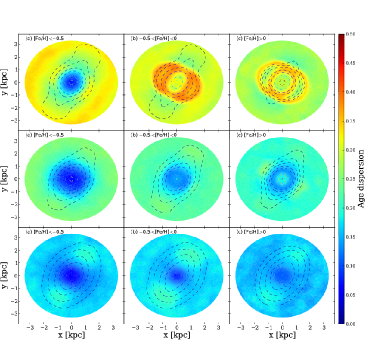
The resolution of our model is much higher than in previous models, and includes gas and stellar chemistries not previously employed in such studies, so this is the first time structure can be studied in such detail. We wish to investigate the distribution of stellar ages in the model at different heights from the plane and at different metallicities, to understand if there are young stars in the bulge and, if so, where they are concentrated. Figures 3 and 4 show the median age and age dispersion for the face-on projections of the simulation out to a radius of R 3 kpc, at three slices in height, , from the plane. An age scale normalised to the current age (=10 Gyr) of the simulation is used. The surface density contours illustrate the extent of the bar. These -slices correspond to latitudes of 1∘, 1∘3∘ and 3∘6∘ from the plane at the center of the bulge. At each height different metallicity ranges are shown in the three sub-panels of: (a) [Fe/H]—0.5, (b) –0.5[Fe/H]–0, (c) [Fe/H]0 and the percentage of stars is shown in the top right hand corner.
4.1 THE AGE DISTRIBUTION OF STARS ACROSS LATITUDE
Looking at Figure 3, it is clear that according to the model (i) the young stars are strongly concentrated very close to the plane, (ii) there is a sharp transition between young and old stars in the bulge with latitude and distinct transitions in the age distribution with longitude (iii) the oldest stars become more centrally concentrated at larger heights from the plane. The model predicts that a few degrees can make the difference between observing a predominantly old population of stars or a population with a range of stellar ages in the inner galaxy due to these steep gradients in the age distribution in the bulge/bar and surrounding disk. Nearest to the plane around the inner region, the stars will have the largest age range, so both young and old stars will be present. The regions around the center of the bulge and ends of the bar show the most homogeneously young population and the youngest stars are located along the edges of the bar. Further away from the plane, the inner-most bulge has the lowest dispersion in ages, reflecting a predominantly old population of stars at the very center. At these larger heights from the plane the younger stars are located preferentially at the ends of the bar (as well as the surrounding disk). The old population at the very center of the model has formed early from a thick disk and the younger stars are from ongoing star formation in the plane associated with the dynamical formation processes. This recent star formation happens naturally without any tuning. The star formation history is partly driven by the gas inflow to the center and related to how strong the bar is at any particular time. The star formation rate within the inner 300 pc is not monotonically declining and during the periods when the bar strengthens there is an increasing star formation rate.
According to these Figures, a median old stellar population is expected to be observed for most fields in the bulge, located even a few degrees from the plane. Although a somewhat younger population of stars is present at the ends of the bar, including at 3∘6∘, it is difficult to isolate this population observationally for stars integrated along a given line of sight. Only photometric observations which target the near-end of the bar close to the plane ( 12∘, 3∘), should reveal a slightly younger mean population compared to the inner longitudes. The photometric studies which report old isochrones as the best fit models to fields at = (+1∘,–2.9∘) (Ortolani et al., 1995), (+0.3∘,–6.2∘) (Zoccali et al., 2003), (+1.25∘,–2.65∘) (Sahu et al., 2006) and (+10.3∘,–4.2∘), (–6.8∘,4.7∘) (Valenti et al., 2013) are consistent with the predictions of this model.
4.2 THE AGE DISTRIBUTION OF STARS ACROSS [Fe/H]
To study the age distribution as a function of metallicity in the model, we now examine the three metallicity ranges as shown in Figures 3a-c and 4a-c, individually. There is clearly a different age distribution for the most metal-rich versus the most metal-poor stars. The model shows that at a given height from the plane, the more metal-rich stars will be younger than the more metal-poor stars and that there is an age gradient with distance from the plane for the metal-rich stars. The age gradient is more gradual at larger heights and the age distribution becomes increasingly older and with a smaller age dispersion further away from the plane. For the metal-rich stars in sub-panels (b) and (c), with [Fe/H]–0.5, the predominantly younger stars are concentrated to the plane and extend to the inner most bulge at the highest metallicities. There is also a wide dispersion in age nearest to the plane, where both young and old stars will be observed. It is likely, given the large fraction of young metal-rich microlensed dwarf stars (see Figure 1), that the youngest of these metal-rich stars are located in the ends of the bar and inner disk directly surrounding the bulge/bar.
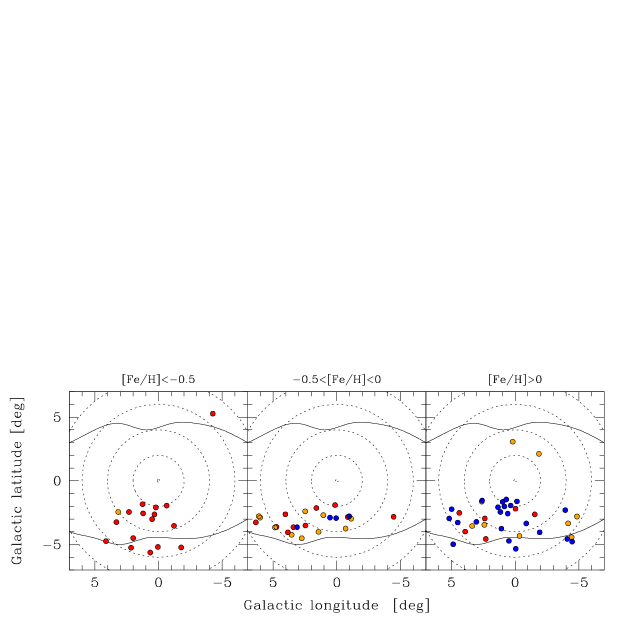
For the metal-poor stars, [Fe/H]–0.5, shown in panel (a), the model predicts that an old population is expected in the bulge, with younger stars located near the ends of the bar. Old stars of comparable ages to the bulge stars are also located in the nearby surrounding disk, and out to larger radii in the disk at 3∘. This is an important prediction of the model: a metal-rich star within 6∘ from the plane in the bulge and the nearby surrounding disk can have a range of ages, with preferentially younger stars at the highest metallicities and lower latitudes, but a metal-poor star in the bulge, regardless of latitude, will almost always be old. Observationally, the metallicity limit between these regimes in the Milky Way appears around [Fe/H] –0.4 (see Figure 1). Figure 5 shows the of the microlensed dwarf sample, as a function of metallicity and colour coded by age where red is the oldest stars and blue the youngest. This longitude range of the microlensed stars of 6∘, in this Figure, corresponds to = 0.5 kpc at a distance of 5 kpc from the Sun and = 1.15 kpc at a distance of 11 kpc from the Sun, for comparison to Figures 3 and 4. Figure 5 shows that the observed metal-poor stars are all old and present at low and high latitudes and the dispersion in the ages of the stars increases as a function of [Fe/H], in agreement with the distribution seen in the model. From comparing the age distribution for all stars as a function of metallicity, it is clear that studies of individual stars are necessary to test the range of ages of stars in the inner Galaxy.
5 CONCLUSION
Multiple channels of evidence including the kinematics (Kunder et al., 2012; Shen et al., 2010; Ness et al., 2013a), the X-shaped morphology (McWilliam & Zoccali, 2010; Nataf et al., 2010; Ness et al., 2012; Li & Shen, 2012) and now ages, as we have demonstrated in this letter, indicate that the bulge of the Milky Way is in large part, if not entirely, formed as part of the evolution of the disk. This is at odds with the merger formation scenario predicted by early semi-analytic models and a a significant problem for the assumption that the bulge must have been accreted (Guo et al., 2011; Zavala et al., 2012; Cooper et al., 2013), given that Milky Way type galaxies are common in the Universe. Our results demonstrate that merger processes are not necessary to form the old bulge population that has been previously associated with a classical bulge in simulations (Doménech-Moral et al., 2012; Obreja et al., 2013) and early bulge-forming dissipational collapse in the Milky Way (Zoccali et al., 2003; Babusiaux et al., 2010; Hill et al., 2011). Our results are in agreement with the bulge formation as a dynamical process from the disk at early times reported by Guedes et al. (2013) whereby the majority of stars are old. In our analysis, we show that the presence of the young stars near the plane in the simulations is an important aspect of bulge formation via disk evolution, and one that matches well the observations (Bensby et al., 2013). Thus the observed ages of stars within the Milky Way bulge can be explained within the context of internal formation and dynamical processes, consistent with other lines of evidence supporting a bulge largely forming from the disk. The key question we now endeavour to resolve, with respect to the Milky Way bulge as a signature of the Galaxy’s formation, is what fraction of stars, if any, are part of a merger remnant? Mapping the age distribution of the bulge as a function of and and performing further quantitative analysis which our team is preparing, examining key regions highlighted in this letter and further comparisons to models in the spirit of this letter, is critical to interpret observations and understand the formation of the Milky Way.
ACKNOWLEDGEMENTS
The research leading to these results has received funding from the European Research Council under the European Union’s Seventh Framework Programme (FP 7) ERC Grant Agreement n. [321035]. T.B. was funded by grant No. 621-2009-3911 from The Swedish Research Council. V.P.D. and D.R.C. are supported by STFC Consolidated grant # ST/J001341/1. The simulation used in this paper was run at the High Performance Computing Facility of the University of Central Lancashire. We thank Laurent Serge Noel of the University of Central Lancashire for Figure 2.
References
- Babusiaux et al. (2010) Babusiaux, C., Gómez, A., Hill, V., Royer, F., Zoccali, M., Arenou, F., Fux, R., Lecureur, A., Schultheis, M., Barbuy, B., Minniti, D., & Ortolani, S. 2010, A&A, 519, A77
- Bensby et al. (2011) Bensby, T., Adén, D., Meléndez, J., Gould, A., Feltzing, S., Asplund, M., Johnson, J. A., Lucatello, S., Yee, J. C., Ramírez, I., Cohen, J. G., Thompson, I., Bond, I. A., Gal-Yam, A., Han, C., Sumi, T., Suzuki, D., Wada, K., Miyake, N., Furusawa, K., Ohmori, K., Saito, T., Tristram, P., & Bennett, D. 2011, A&A, 533, A134
- Bensby et al. (2013) Bensby, T., Yee, J. C., Feltzing, S., Johnson, J. A., Gould, A., Cohen, J. G., Asplund, M., Meléndez, J., Lucatello, S., Han, C., Thompson, I., Gal-Yam, A., Udalski, A., Bennett, D. P., Bond, I. A., Kohei, W., Sumi, T., Suzuki, D., Suzuki, K., Takino, S., Tristram, P., Yamai, N., & Yonehara, A. 2013, A&A, 549, A147
- Brook et al. (2012) Brook, C. B., Stinson, G., Gibson, B. K., Roškar, R., Wadsley, J., & Quinn, T. 2012, MNRAS, 419, 771
- Brown et al. (2010) Brown, T. M., Sahu, K., Anderson, J., Tumlinson, J., Valenti, J. A., Smith, E., Jeffery, E. J., Renzini, A., Zoccali, M., Ferguson, H. C., VandenBerg, D. A., Bond, H. E., Casertano, S., Valenti, E., Minniti, D., Livio, M., & Panagia, N. 2010, ApJ, 725, L19
- Clarkson et al. (2008) Clarkson, W., Sahu, K., Anderson, J., Smith, T. E., Brown, T. M., Rich, R. M., Casertano, S., Bond, H. E., Livio, M., Minniti, D., Panagia, N., Renzini, A., Valenti, J., & Zoccali, M. 2008, ApJ, 684, 1110
- Combes & Sanders (1981) Combes, F. & Sanders, R. H. 1981, A&A, 96, 164
- Cooper et al. (2013) Cooper, A. P., D’Souza, R., Kauffmann, G., Wang, J., Boylan-Kolchin, M., Guo, Q., Frenk, C. S., & White, S. D. M. 2013, MNRAS, 434, 3348
- Doménech-Moral et al. (2012) Doménech-Moral, M., Martínez-Serrano, F. J., Domínguez-Tenreiro, R., & Serna, A. 2012, MNRAS, 421, 2510
- Gardner et al. (2013) Gardner, E., Debattista, V. P., Robin, A. C., Vásquez, S., & Zoccali, M. 2013, ArXiv e-prints
- Governato et al. (2008) Governato, F., Mayer, L., & Brook, C. 2008, in Astronomical Society of the Pacific Conference Series, Vol. 396, Formation and Evolution of Galaxy Disks, ed. J. G. Funes & E. M. Corsini, 453
- Guedes et al. (2013) Guedes, J., Mayer, L., Carollo, M., & Madau, P. 2013, ApJ, 772, 36
- Guo et al. (2011) Guo, Q., White, S., Boylan-Kolchin, M., De Lucia, G., Kauffmann, G., Lemson, G., Li, C., Springel, V., & Weinmann, S. 2011, MNRAS, 413, 101
- Hill et al. (2011) Hill, V., Lecureur, A., Gómez, A., Zoccali, M., Schultheis, M., Babusiaux, C., Royer, F., Barbuy, B., Arenou, F., Minniti, D., & Ortolani, S. 2011, A&A, 534, A80
- Howard et al. (2008) Howard, C. D., Rich, R. M., Reitzel, D. B., Koch, A., De Propris, R., & Zhao, H. 2008, ApJ, 688, 1060
- Kunder et al. (2012) Kunder, A., Koch, A., Rich, R. M., de Propris, R., Howard, C. D., Stubbs, S. A., Johnson, C. I., Shen, J., Wang, Y., Robin, A. C., Kormendy, J., Soto, M., Frinchaboy, P., Reitzel, D. B., Zhao, H., & Origlia, L. 2012, AJ, 143, 57
- Li & Shen (2012) Li, Z.-Y. & Shen, J. 2012, ApJ, 757, L7
- López-Corredoira et al. (2005) López-Corredoira, M., Cabrera-Lavers, A., & Gerhard, O. E. 2005, A&A, 439, 107
- Lütticke et al. (2004) Lütticke, R., Pohlen, M., & Dettmar, R.-J. 2004, aap, 417, 527
- McWilliam & Zoccali (2010) McWilliam, A. & Zoccali, M. 2010, ApJ, 724, 1491
- Nataf et al. (2010) Nataf, D. M., Udalski, A., Gould, A., Fouqué, P., & Stanek, K. Z. 2010, ApJ, 721, L28
- Navarro et al. (1997) Navarro, J. F., Frenk, C. S., & White, S. D. M. 1997, ApJ, 490, 493
- Ness et al. (2013a) Ness, M., Freeman, K., Athanassoula, E., Wylie-de-Boer, E., Bland-Hawthorn, J., Asplund, M., Lewis, G. F., Yong, D., Lane, R. R., & Kiss, L. L. 2013a, MNRAS, 430, 836
- Ness et al. (2013b) Ness, M., Freeman, K., Athanassoula, E., Wylie-de-Boer, E., Bland-Hawthorn, J., Asplund, M., Lewis, G. F., Yong, D., Lane, R. R., Kiss, L. L., & Ibata, R. 2013b, MNRAS, 432, 2092
- Ness et al. (2012) Ness, M., Freeman, K., Athanassoula, E., Wylie-De-Boer, E., Bland-Hawthorn, J., Lewis, G. F., Yong, D., Asplund, M., Lane, R. R., Kiss, L. L., & Ibata, R. 2012, ApJ, 756, 22
- Obreja et al. (2013) Obreja, A., Domínguez-Tenreiro, R., Brook, C., Martínez-Serrano, F. J., Doménech-Moral, M., Serna, A., Mollá, M., & Stinson, G. 2013, ApJ, 763, 26
- Ortolani et al. (1995) Ortolani, S., Renzini, A., Gilmozzi, R., Marconi, G., Barbuy, B., Bica, E., & Rich, R. M. 1995, Nature, 377, 701
- Raha et al. (1991) Raha, N., Sellwood, J. A., James, R. A., & Kahn, F. D. 1991, Nature, 352, 411
- Robin et al. (2012) Robin, A. C., Luri, X., Reylé, C., Isasi, Y., Grux, E., Blanco-Cuaresma, S., Arenou, F., Babusiaux, C., Belcheva, M., Drimmel, R., Jordi, C., Krone-Martins, A., Masana, E., Mauduit, J. C., Mignard, F., Mowlavi, N., Rocca-Volmerange, B., Sartoretti, P., Slezak, E., & Sozzetti, A. 2012, A&A, 543, A100
- Roškar et al. (2008) Roškar, R., Debattista, V. P., Stinson, G. S., Quinn, T. R., Kaufmann, T., & Wadsley, J. 2008, ApJ, 675, L65
- Sahu et al. (2006) Sahu, K. C., Casertano, S., Bond, H. E., Valenti, J., Ed Smith, T., Minniti, D., Zoccali, M., Livio, M., Panagia, N., Piskunov, N., Brown, T. M., Brown, T., Renzini, A., Rich, R. M., Clarkson, W., & Lubow, S. 2006, Nature, 443, 534
- Scannapieco et al. (2008) Scannapieco, C., Tissera, P. B., White, S. D. M., & Springel, V. 2008, MNRAS, 389, 1137
- Shen et al. (2010) Shen, J., Rich, R. M., Kormendy, J., Howard, C. D., De Propris, R., & Kunder, A. 2010, ApJ, 720, L72
- Valenti et al. (2013) Valenti, E., Zoccali, M., Renzini, A., Brown, T. M., Gonzalez, O., Minniti, D., Debattista, V. P., & Mayer, L. 2013, ArXiv e-prints
- Wegg & Gerhard (2013) Wegg, C. & Gerhard, O. 2013, ArXiv e-prints
- Weiland et al. (1994) Weiland, J. L., Arendt, R. G., Berriman, G. B., Dwek, E., Freudenreich, H. T., Hauser, M. G., Kelsall, T., Lisse, C. M., Mitra, M., Moseley, S. H., Odegard, N. P., Silverberg, R. F., Sodroski, T. J., Spiesman, W. J., & Stemwedel, S. W. 1994, ApJ, 425, L81
- Zavala et al. (2012) Zavala, J., Avila-Reese, V., Firmani, C., & Boylan-Kolchin, M. 2012, MNRAS, 427, 1503
- Zoccali et al. (2003) Zoccali, M., Renzini, A., Ortolani, S., Greggio, L., Saviane, I., Cassisi, S., Rejkuba, M., Barbuy, B., Rich, R. M., & Bica, E. 2003, A&A, 399, 931