Anhamonic finite temperature effects on the Raman and Infrared spectra to determine the crystal structure phase III of solid molecular hydrogen
Abstract
We present theoretical calculations of the Raman and IR spectra, as well as electronic properties at zero and finite temperature to elucidate the crystal structure of phase III of solid molecular hydrogen. We find that anharmonic finite temperature are particularly important and qualitatively influences the main conclusions. While P63/m is the most likely candidate for phase III at the nuclear ground state, at finite temperature the C2/c structure appears to be more suitable.
pacs:
62.50.-p, 63.20.Ry, 71.15.Pd, 71.20.-bI introduction
The high-pressure phase of solid molecular hydrogen is very complex. Nevertheless, due to its relevance to astrophysics Alavi et al. (1995), the possible existence of high- superconductivity Ashcroft (1968) and a metallic quantum fluid ground state Bonev et al. (2004), the importance to grasp metallic hydrogen can hardly be overstated. However, since Hydrogen atoms are very light, their x-ray scattering is extremely weak, leading to extremely low-resolution diffraction patterns Mao and Hemley (1994); Loubeyre et al. (1996). This makes it particularly challenging to determine the crystalline structure of solid hydrogen at high pressure. Experiments based on vibrational techniques, such as Raman and infrared (IR) spectroscopies, have identified four different solid phases (I, II, III and IV) of molecular hydrogen at megabar pressures (100300 GPa) and different temperature ranges Mao and Hemley (1994); Eremets and Troyan (2011); Howie et al. (2012a). The low pressure phase ( 110 GPa) is denoted as phase I and consists of freely rotating hydrogen molecules on an hexagonal close-packed lattice. The low temperature structures at pressures above 110 GPa, known as phase II and III, are still unknown Hemley and Mao (1988); Lorenzana et al. (1989), just like the recently discovered phase IV that is stable at temperatures well above the nuclear ground state Howie et al. (2012a); Zha et al. (2013). This is due to the fact that the combination of scattering and vibrational spectroscopy measurements only reveal the state of bonding of the hydrogen atoms, but are not sufficient to uniquely determine the corresponding crystal structures.
Even though it is generally still impossible to ensure that a particular structure corresponds to the global minimum in enthalpy, recently great strides have been made to predict crystal structures from first-principles, to the extend that allowed Pickard and Needs to systematically investigate the zero-temperature phase diagram of solid molecular hydrogen by means of theory. In particular, they suggested the C2/c phase to be energetically most favorable for the pressure range of phase III Pickard and Needs (2007). At variance, based on more accurate hybrid density functional theory (DFT) calculations that includes some fraction of exact Hartree-Fock exchange, Azadi and Kühne predicted the P63/m to be the most likely candidate for phase III of solid hydrogen Azadi and Kühne (2012). Even more accurate Quantum Monte Carlo calculations, including the harmonic part of the zero-point energy (ZPE), also indicates that the P63/m phase obeys the lowest enthalpy up to 220 GPa, whereas for higher pressures the C2/c structure is enthalpically most favorable Azadi et al. (2013). However, the differences in enthalpy within these structures are very small and nuclear quantum effects (NQE), such as the ZPE, relatively large, which puts rather stringent accuracy requirements on the calculation of both contributions. While the former is typically calculated using DFT, the latter is often estimated using the quasi-harmonic approximation. Yet both of them have recently been shown to be not accurate enough for the reliable prediction of high-pressure crystal structures. On the one hand Azadi et al. have shown that an electronic structure theory beyond DFT is essential Azadi and Foulkes (2013); Azadi et al. (2013), whereas on the other hand Ceperley and coworkers demonstrated the importance of anharmonic ZPE and the significance of finite temperature effects Morales et al. (2013). Unfortunately, combining path-integral molecular dynamics, which exactly accounts for finite temperature and NQE, with an accurate electronic structure technique beyond DFT is computational still not feasible.
Therefore, in this paper we follow a different approach and consider anharmonic finite temperature effects by means of DFT-based Born-Oppenheimer molecular dynamics (BOMD) simulations at room temperature Payne et al. (1992); Kühne (2013). However, we do not attempt here to determine the most likely candidate structure in the pressure range of phase III by averaging the enthalpy from accurate electronic structure calculations. Instead, we calculate here the ensemble averages of the Raman and IR spectra, which are much more sensitive to structural changes, and compare them directly to experimental measurements at room temperature to assign the structure of phase III of solid molecular hydrogen Akahama et al. (2010a); Zha et al. (2012).
II computational details
We considered here the C2, C2/c, Cmca-12, Pbcn and P63/m phases, which have all been found to be enthalpically competitive candidate structures for phase III of solid molecular hydrogen Pickard and Needs (2007). The supercell of the latter structure consisted of 64 hydrogen molecules, whereas all the others supercells contained 48 hydrogen molecules, respectively. All of our DFT calculations were performed using the projector augmented-wave method, as implemented in Quantum Espresso Blöchl (1994); Giannozzi et al. (2009). We employed the Perdew-Burke-Ernzerhof (PBE) generalized gradient approximation to the exchange and correlation energy Perdew et al. (1996). The BOMD simulations were conducted in the isobaric-isothermal NPT ensemble, i.e. at constant pressure (250 GPa) and temperature (200 K and 300 K). Each of the simulations were initially equilibrated for 5 ps before accumulating statistics for another 15 ps using an integration timestep of 8 a.u. (1 a.u.= 0.0484 fs). It is important to note that in this way NQE are neglected. Nevertheless, since NQE are at finite temperature much smaller than at the nuclear ground-state and furthermore primarily influence the relative stability of the various crystal phases rather than the Raman and IR spectra, the effect on the eventual structure determination can be assumed to be small.
For the purpose to calculate the nuclear forces for the BOMD simulation, we have employed a plane wave basis set with an energy cut-off of 680 eV and a 222 Monkhorst-Pack k-point mesh to sample the first Brillouin zone Monkhorst and Pack (1976). Beside calculating the Raman and IR spectra, the electronic density of states (EDOS) and the electronic band gaps at the nuclear ground state at 0 K, we have also calculated them at finite temperature as ensemble averages of 200 equidistantly selected configurations from our BOMD simulations. To that extend we used an energy cutoff of 816 eV and a dense 183 k-point mesh to compute the EDOS and the band gaps, whereas a rather hard norm-conserving (NC) pseudopotential Hartwigsen et al. (1998) with a cutoff of 1360 eV and the Perdew-Zunger (PZ81) exchange and correlation functional Perdew and Zunger (1981) had been employed to calculate the Raman and IR spectra. Optimized structures were obtained through minimizing the enthalpy when simultaneously varying the atomic positions and the simulation cell by a dynamical simulated annealing Car and Parrinello (1985); Kühne et al. (2007). The spectra were all calculated at the -point only using density-functional perturbation theory and its third-order extension based on the ‘’ rule to compute the anharmonic cubic coupling constants Debernardi and Baroni (1994); Baroni et al. (2001).
III results and discussion
The main constraints that are used to identify the various phases of solid molecular hydrogen comes from experimental vibrational spectroscopy measurements. The lattice vibration modes due to low-frequency intermolecular interactions are denoted as librons, while the high-frequency intramolecular stretching modes are known as vibrons. The pressure induced transition from phase II to phase III can be identified in the Raman spectrum by a large discontinuous drop of the Raman vibron frequency Loubeyre et al. (2002); Akahama et al. (2010b) followed by a continuous decrease upon further increase in pressure Loubeyre et al. (2002); Akahama et al. (2010a); Zha et al. (2012). This indicates not only strong intermolecular interactions, but also the presence of orientational ordering in phase III. Furthermore, phase III obeys multiple low-frequency Raman-active modes Loubeyre et al. (2002), whereas the frequency of the highest Raman-active libron increases with pressure Goncharov et al. (2001). However, it is also possible to detect the pressure induced phase II to III transition within experimental IR spectra by a discontinuous drop in frequency of the IR-active vibrons Hanfland et al. (1993). Increasing the pressure even further leads to a large increase in the intensity of the IR-active vibrons Hanfland et al. (1993); Mazin et al. (1997) and to a decrease in the frequency of the IR-active vibrons Goncharov et al. (2001); Zha et al. (2012); Hanfland et al. (1993). The distinction between para and ortho hydrogen molecules is herein of minor importance, due to the rather small rotational freedom of the individual molecules Mazin et al. (1997).
All of the structures considered here consists of hydrogen molecules arranged in layers, though each time with a different stacking. In any case, the centers of the molecules lie on a distorted hexagonal lattice. The individual layers of the P63/m and Cmca-12 phases are stacked in a ABA fashion, whereas the C2/c structure obeys a ABCDA stacking. At variance, the C2 and Pbcn phases are mixed layered structures made of alternating layers of strongly and weakly bonded hydrogen molecules. However, initial Raman and IR spectra calculations immediately suggest that the latter mixed layered phases are inconsistent with phase III of solid molecular hydrogen. Henceforth, we will confine ourselves to the C2/c, P63/m and Cmca-12 phases only and will discuss the C2 and Pbcn structures in a forthcoming paper on phase IV of solid hydrogen Singh et al. (2014). Except for the P63/m phase, where three-quarters of the hydrogen molecules are planar, while one quarter of the molecules are oriented perpendicular to the plane, in all other structures the hydrogen molecules are arranged in-plane.
III.1 Raman and IR spectra at the nuclear ground state
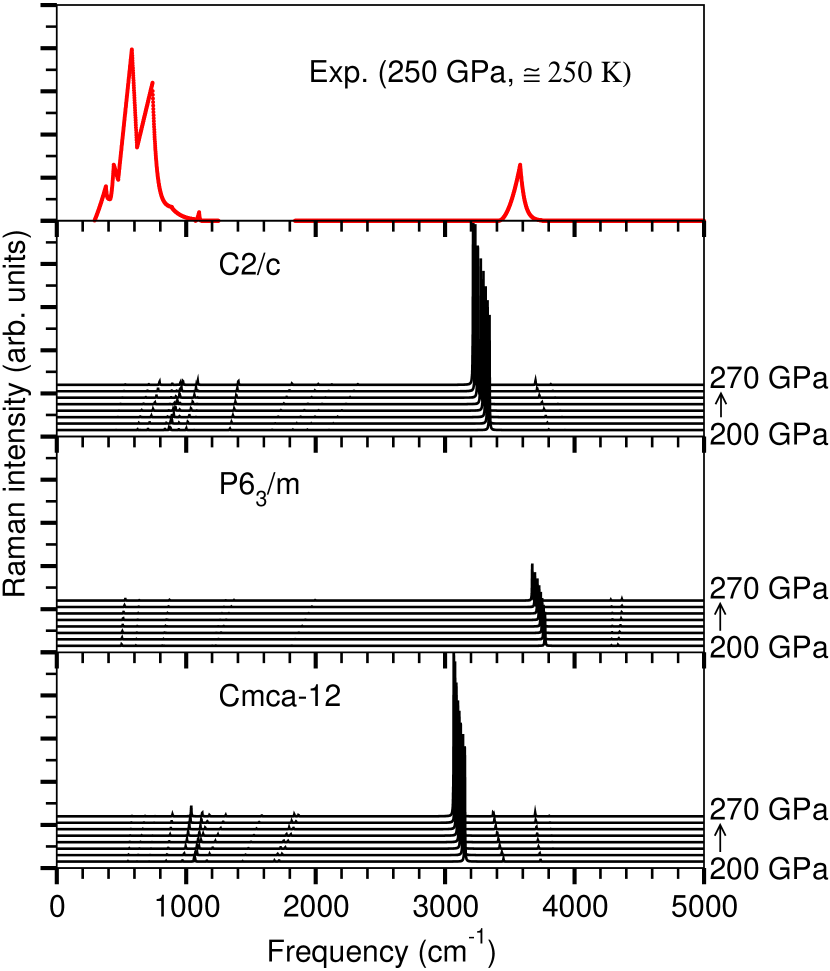
The calculated Raman spectra as a function of pressure of the C2/c, P63/m and Cmca-12 phases at their respective nuclear ground states are shown in Fig. 1. In comparison to the P63/m phase, the intensity of the Raman-active modes of the C2/c and Cmca-12 structures is about three times stronger. In all of the considered structures, the frequencies of the Raman-active libron modes are increasing, while the frequencies of the strong Raman-active vibron modes are decreasing with pressure, which is in qualitative agreement with the experimental data Loubeyre et al. (2002); Akahama et al. (2010a); Zha et al. (2012); Goncharov et al. (2001). However, the P63/m phase, which exhibits three Raman-active vibron modes, is the sole configuration that is in agreement with a previous group theoretical analysis Cui et al. (1995) and is overall in best agreement with the experimental Raman spectra Howie et al. (2012b) as can be seen in Fig. 1.
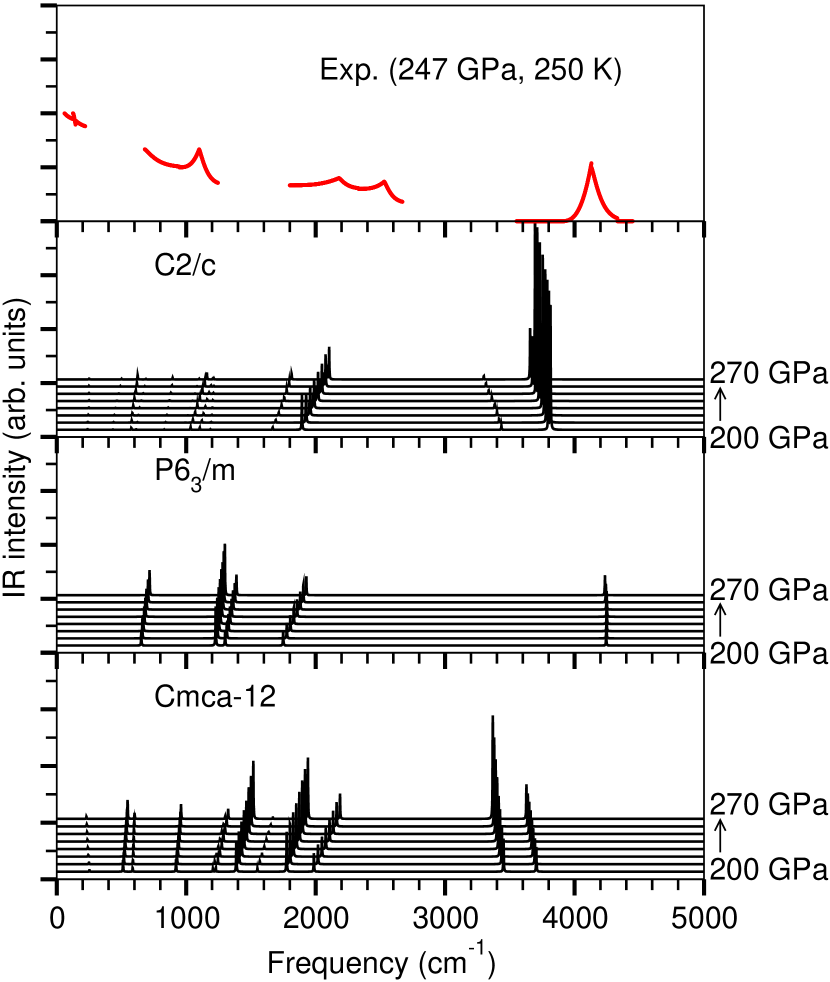
The corresponding IR spectra of the very same crystal structures as a function of pressure at 0 K are given in Fig. 2. In comparison with the P63/m phase, the intensity of the dominant IR vibron mode of the C2/c structure is about five times stronger, and almost twice as big as the Cmca-12 one. Upon increasing the pressure in all of the examined structures, the frequencies of the IR-active libron modes are increasing, while the frequencies of IR-active vibrons are decreasing, which is qualitatively in agreement with the experimental data Zha et al. (2012); Goncharov et al. (2001). However, experimentally only one IR-active vibron mode is observed, whereas the C2/c and Cmca-12 phases have each two IR-active vibron modes. Thus, the P63/m structure, which possess only one IR-active vibron mode, is the only composition that is in agreement with an earlier group theoretical analysis Cui et al. (1995). Even though, looking at Fig. 2, it is apparent that the P63/m phase is in best agreement with the experimental IR measurements, the marginally decreasing frequency of the IR vibron mode with respect to pressure is at variance to the experimental findings, whose IR vibron frequency is noticeably decreasing with increasing pressure Zha et al. (2012). As a consequence, beside the P63/m phase, the C2/c structure, which not only has a rather large IR vibron intensity Hanfland et al. (1993); Goncharov et al. (2001), but furthermore an with pressure decreasing IR frequency Zha et al. (2012); Goncharov et al. (2001), are the two most likely candidates for phase III of solid molecular hydrogen.
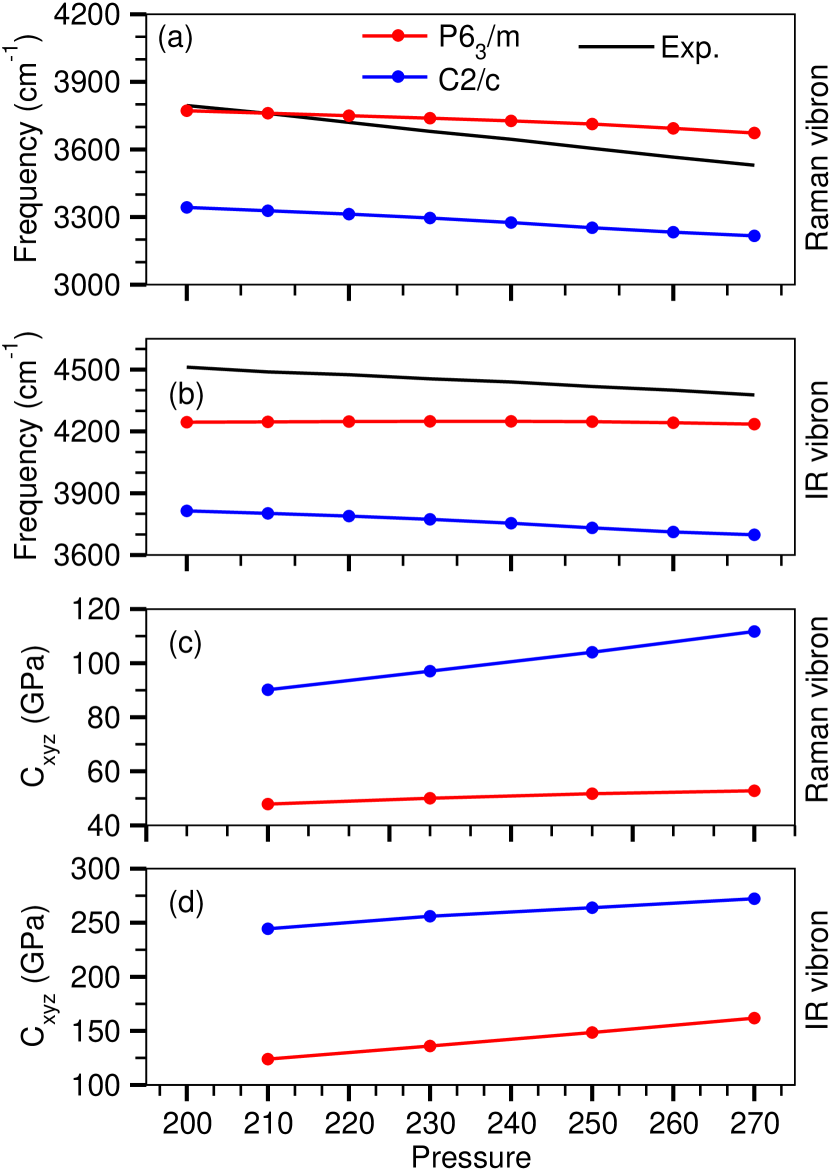
In Fig. 3 the calculated frequencies as a function of pressure of the strongest Raman- and IR-active vibron modes of the remaining P63/m and C2/c phases are compared with the experimental ones. As can be seen in Fig. 3a, both candidate structures exhibit the correct slope of the strongest mode with respect to pressure, whereas for the P63/m phase only, in addition the frequency itself is in excellent agreement with experiment Zha et al. (2012). On the contrary, the assignment based on the IR-active vibron modes of Fig. 3b is less obvious. While the P63/m phase is to favor regarding the quantitative agreement with experiment of the strongest IR vibron frequency, its slope as a function of pressure is better reproduced by the C2/c structure.
Furthermore, we have calculated the third-order anharmonic force constants associated with the strongest Raman- and IR-active vibrons, respectively. From Fig. 3c-d it is evident that the cubic force constants of both phases are increasing with pressure, which is most likely due to the increasing anharmonicity of the lattice vibrations as a function of pressure. This immediately suggests that the linewidth of the Raman- and IR-active vibron peaks is increasing with pressure as well, in agreement with the experimental data of phase III of solid molecular hydrogen Howie et al. (2012a); Zha et al. (2012).
III.2 Raman and IR spectra at finite temperature
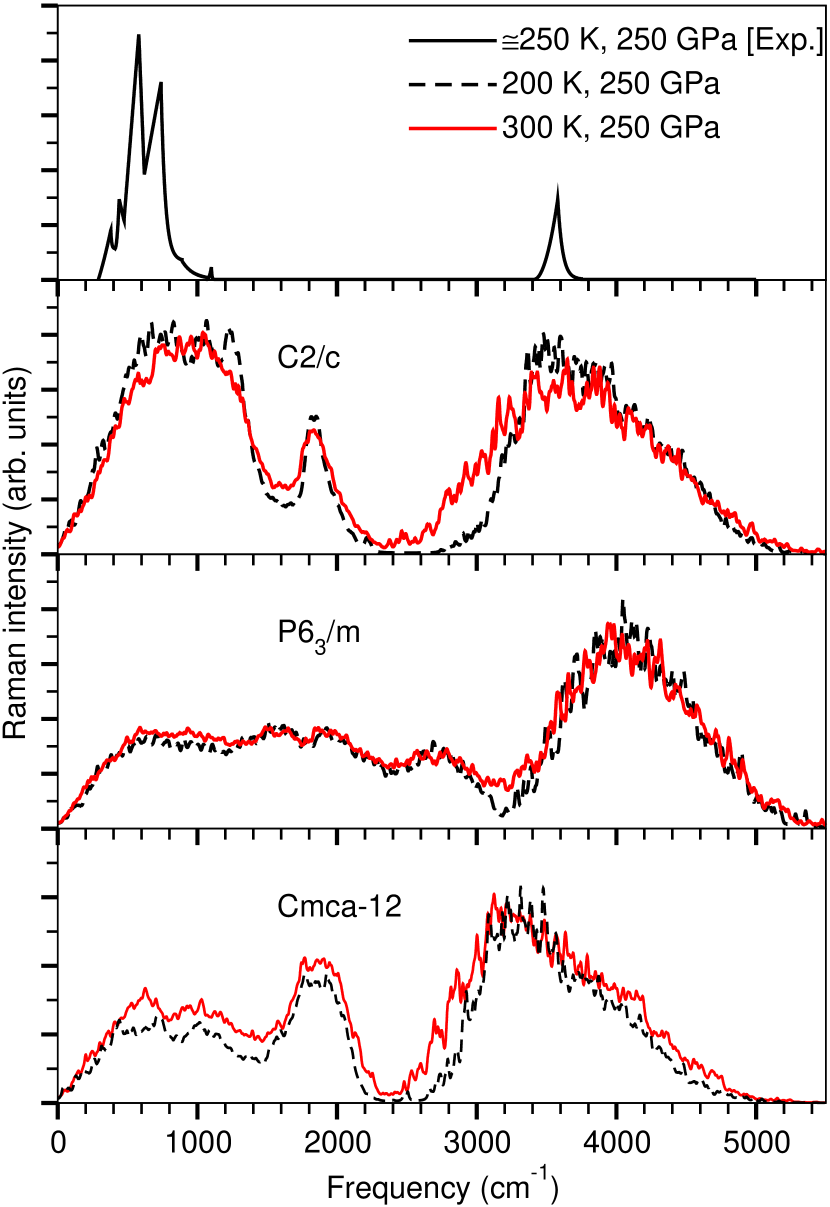
The calculated Raman and IR spectra of the C2/c, P63/m and Cmca-12 crystal structures that comply with nuclear temperatures of 200 K and 300 K and a pressure of 250 GPa are given in Figs. 4 and 5, respectively. The most apparent distinction from the corresponding spectra at 0 K is the expected broadening of all the peaks due to anharmonic finite temperature. Nevertheless, comparing the actual Raman spectra at finite temperature with the ones of Fig. 1 at 0 K unveils that the Raman-active vibron modes are all experiencing an anharmonic finite temperature induced redshift. The fact that the redshift amount to 200-300 cm-1 is in effect rather consequential and entails that at finite temperature the C2/c structure is now in better agreement with the experimental data than the P63/m phase, which was the closest match at 0 K Howie et al. (2012b). In addition, the low-frequency librons of the C2/c structure are in qualitative agreement with the experimental ones, while the agreement of the P63/m phase is rather poor.
However, the linewidth of the Raman-active vibron of all probed crystal structures is very large compared with the experimental value of about 100 cm-1, which is most likely due to an overestimation of the anharmonic proton motion by the present semi-classical BOMD simulations.
On the contrary, the influence of anharmonic finite temperature effects on the IR spectra shown in Fig. 5 is somewhat more subtle. Whereas the IR vibron mode of the C2/c and Cmca-12 structures is again redshifted by about 300 cm-1, the P63/m phase experiences an anharmonic finite temperature induced blueshift of about 150 cm-1. Even though the IR-active vibrons of both, the C2/c and the P63/m configurations are now consistent with the experimental measured ones, the agreement of the libron modes is generally less satisfying and just slightly in favor of the C2/c structure Zha et al. (2012). Similar to the Raman spectra, the linewidth of the IR-active vibron is very large compared to the experimental value.
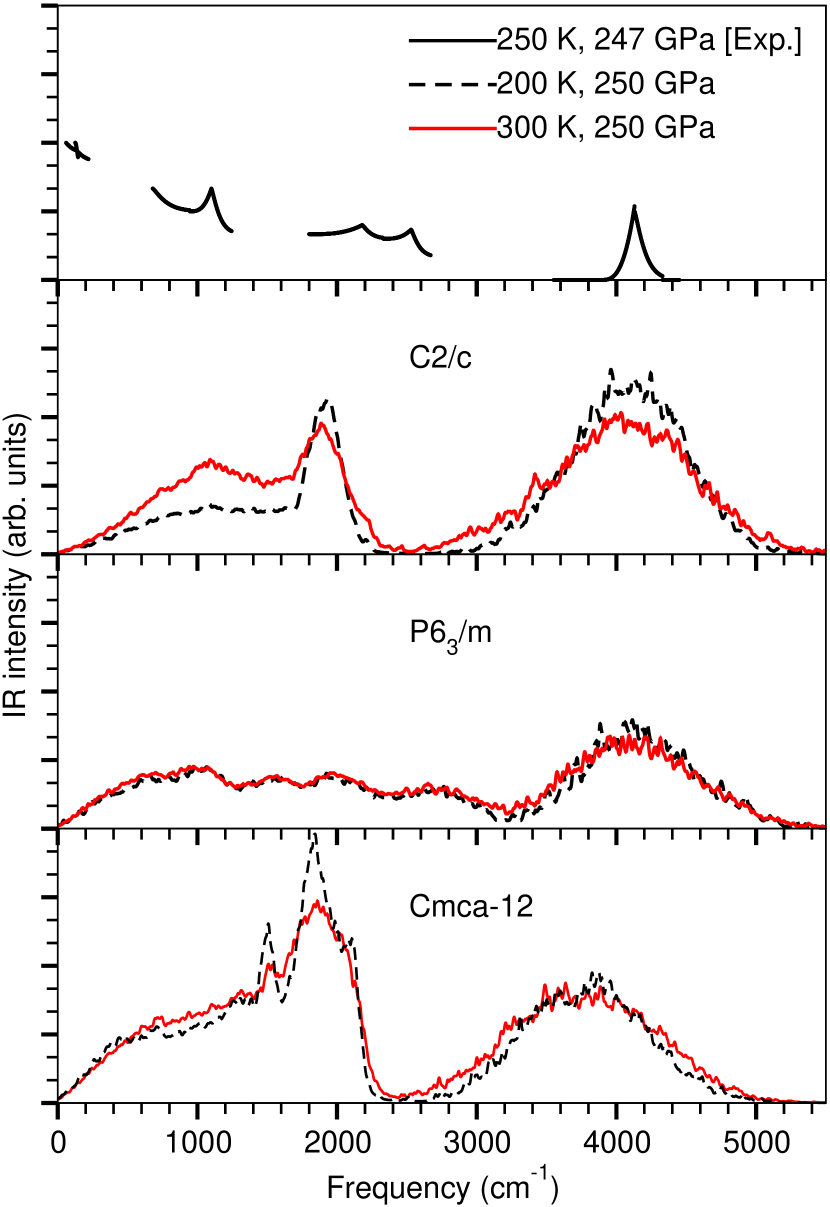
For all of the examined crystal structures, the Raman as well as the IR spectra were rather similar for 200 K and 300 K, respectively, except for a minor increase in the linewidth of the vibron modes. However, at variance to others, no temperature induced phase transition has been observed for any of the considered phases Liu and Ma (2013); Magdău and Ackland (2013).
III.3 Electronic properties
From Table 1 it can be deduced that anharmonic finite temperature effects reduces the electronic band gaps of the C2/c and P63/m phases by 0.63 eV and 2.13 eV, respectively. On the contrary, the energy gap of the Cmca-12 structure is increased by 0.66 eV, which is another manifestation that the inclusion of anharmonic finite temperature effects is essential. In all cases the computed band gaps turn out to be indirect energy gaps only. At 0 K the well known rule ”the lower the energy, the wide the gap” Kaxiras et al. (1991) is fulfilled and the P63/m structure indeed exhibits the largest gap. At finite temperature, however, the Cmca-12 phase breaks ranks. Anyhow, the roughly 1 eV smaller band gap of the C2/c composition in comparison to the P63/m phase, can be thought of as a further indication in support of the C2/c structure as the most likely candidate for phase III of solid molecular hydrogen at finite temperature.
| Crystal | Electronic Band Gaps | |
|---|---|---|
| Structure | Nuclear Ground State | Finite Temperature |
| C2/c | 0.65 eV | 0.02 eV |
| P63/m | 1.08 eV | -1.05 eV |
| Cmca-12 | -0.61 eV | 0.05 eV |
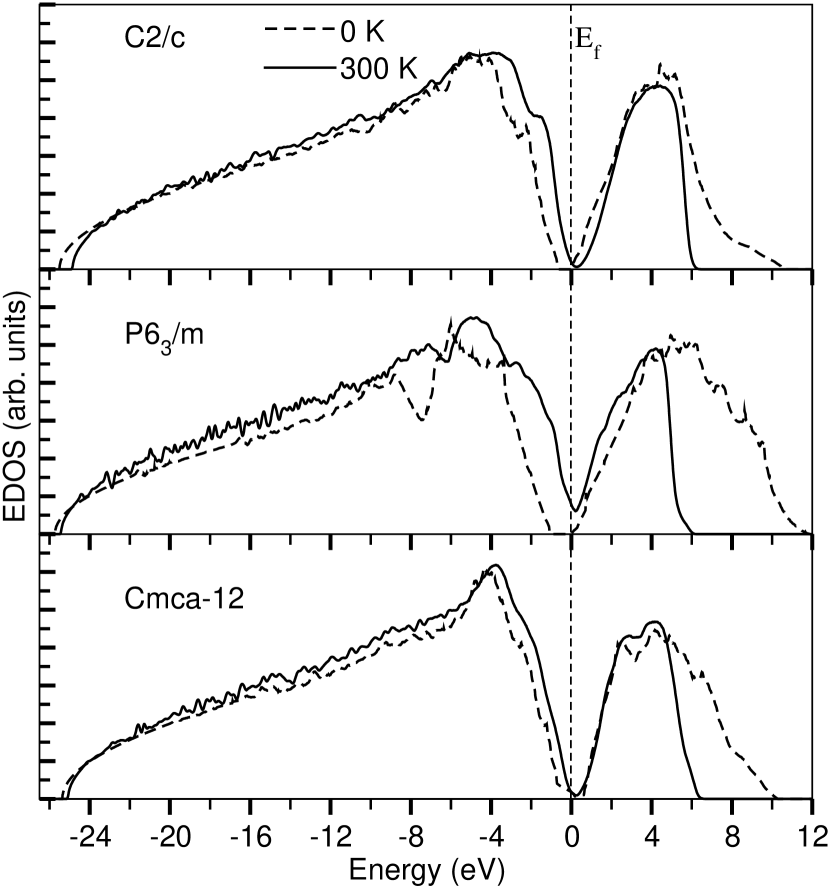
Furthermore, in Fig. 6 the associated EDOS are given. As can be seen, the P63/m phase is the sole configuration that has a non-zero EDOS around the Fermi level at 300 K. All the other structures had zero EDOS around the Fermi level at 0 K and 300 K, respectively. However, due to the fact that even the exact single-particle Kohn-Sham gap differs from the true fundamental gap by the infamous derivative discontinuity, local and semi-local DFT often severely underestimates the electronic band gap Perdew and Levy (1983). Taking into account that typical gradient corrected exchange and correlation functionals underestimate the true band gap by at least 1-2 eV Städele and Martin (2000); Azadi and Kühne (2012); Azadi et al. (2013), all of the investigated candidate structures for phase III of solid molecular hydrogen are expected to be insulating at the nuclear ground state as well as at room temperature, which is in agreement with the experimental results Zha et al. (2012).
IV Conclusion
We have presented theoretical calculations of the Raman and IR spectra, as well as electronic properties at zero and finite temperature on various low-enthalpy crystal structures, which have been proposed as potential candidates for the phase III of solid molecular hydrogen. Among the various candidate structures we have investigated, we found that at 0 K the P63/m phase, which has been recently predicted by Kühne and coworkers Azadi and Kühne (2012); Azadi et al. (2013), is indeed in best agreement with the experimental data of phase III of solid molecular hydrogen. However, at finite temperature the C2/c structure appeared to be the most likely candidate for phase III, which clearly demonstrates the importance of anharmonic finite temperature effects that have the potential to qualitatively alter the main conclusions. The fact that all of the examined crystal structures were insulating immediately excludes the theoretically conjectured existence of phonon-driven superconductivity in phase III of solid molecular hydrogen Barbee III et al. (1989); Richardson and Ashcroft (1997).
Acknowledgements.
We would like to acknowledge financial support from the Graduate School of Excellence MAINZ and IDEE project of the Carl Zeiss Foundation.References
- Alavi et al. (1995) A. Alavi, M. Parrinello, and D. Frenkel, Science 269, 1252 (1995).
- Ashcroft (1968) N. W. Ashcroft, Phys. Rev. Lett. 21, 1748 (1968).
- Bonev et al. (2004) S. A. Bonev, E. Schwegler, T. Ogitsu, and G. Galli, Nature 431, 669 (2004).
- Mao and Hemley (1994) H.-K. Mao and R. J. Hemley, Rev. Mod. Phys. 66, 671 (1994).
- Loubeyre et al. (1996) P. Loubeyre, R. LeToullec, D. Hausermann, M. Hanfland, R. J. Hemley, H.-K. Mao, and L. W. Finger, Nature 383, 702 (1996).
- Eremets and Troyan (2011) M. I. Eremets and I. A. Troyan, Nature Mater. 10, 927 (2011).
- Howie et al. (2012a) R. T. Howie, C. L. Guillaume, T. Scheler, A. F. Goncharov, and E. Gregoryanz, Phys. Rev. Lett. 108, 125501 (2012a).
- Hemley and Mao (1988) R. J. Hemley and H. K. Mao, Phys. Rev. Lett. 61, 857 (1988).
- Lorenzana et al. (1989) H. E. Lorenzana, I. F. Silvera, and K. A. Goettel, Phys. Rev. Lett. 63, 2080 (1989).
- Zha et al. (2013) C.-S. Zha, Z. Liu, M. Ahart, R. Boehler, and R. J. Hemley, Phys. Rev. Lett. 110, 217402 (2013).
- Pickard and Needs (2007) C. J. Pickard and R. J. Needs, Nat. Phys. 3, 473 (2007).
- Azadi and Kühne (2012) S. Azadi and T. D. Kühne, JETP Lett. 95, 449 (2012).
- Azadi et al. (2013) S. Azadi, W. M. C. Foulkes, and T. D. Kühne, New J. Phys. 15, 113005 (2013).
- Azadi and Foulkes (2013) S. Azadi and W. M. C. Foulkes, Phys. Rev. B 88, 014115 (2013).
- Morales et al. (2013) M. A. Morales, J. M. McMahon, C. Pierleoni, and D. M. Ceperley, Phys. Rev. B 87, 184107 (2013).
- Payne et al. (1992) M. C. Payne, M. P. Teter, D. C. Allan, T. A. Arias, and J. D. Joannopoulos, Rev. Mod. Phys. 64, 1045 (1992).
- Kühne (2013) T. D. Kühne, WIREs Comput. Mol. Sci. , 1176 (2013).
- Akahama et al. (2010a) Y. Akahama, H. Kawamura, N. Hirao, Y. Ohishi, and K. Takemura, J. Phys.: Conf. Ser. 215, 012056 (2010a).
- Zha et al. (2012) C.-S. Zha, Z. Liu, and R. J. Hemley, Phys. Rev. Lett. 108, 146402 (2012).
- Blöchl (1994) P. E. Blöchl, Phys. Rev. B 50, 17953 (1994).
- Giannozzi et al. (2009) P. Giannozzi, S. Baroni, N. Bonini, M. Calandra, R. Car, C. Cavazzoni, D. Ceresoli, G. Chiarotti, M. Cococcioni, I. Dabo, A. D. Corso, S. Fabris, G. Fratesi, S. de Gironcoli, R. Gebauer, U. Gerstmann, C. Gougoussis, A. Kokalj, M. Lazzeri, L. Martin-Samos, N. Marzari, F. Mauri, R. Mazzarello, S. Paolini, A. Pasquarello, L. Paulatto, C. Sbraccia, S. Scandolo, G. Sclauzero, A. P. Seitsonen, A. Smogunov, P. Umari, and R. M. Wentzcovitch, J. Phys.: Condens. Matter 21, 395502 (2009).
- Perdew et al. (1996) J. P. Perdew, K. Burke, and M. Ernzerhof, Phys. Rev. Lett. 77, 3865 (1996).
- Monkhorst and Pack (1976) H. J. Monkhorst and J. D. Pack, Phys. Rev. B 13, 5188 (1976).
- Hartwigsen et al. (1998) C. Hartwigsen, S. Goedecker, and J. Hutter, Phys. Rev. B 58, 3641 (1998).
- Perdew and Zunger (1981) J. P. Perdew and A. Zunger, Phys. Rev. B 23, 5048 (1981).
- Car and Parrinello (1985) R. Car and M. Parrinello, Phys. Rev. Lett. 55, 2471 (1985).
- Kühne et al. (2007) T. D. Kühne, M. Krack, F. R. Mohamed, and M. Parrinello, Phys. Rev. Lett. 98, 066401 (2007).
- Debernardi and Baroni (1994) A. Debernardi and S. Baroni, Solid State Commun. 91, 813 (1994).
- Baroni et al. (2001) S. Baroni, S. de Gironcoli, A. Dal Corso, and P. Giannozzi, Rev. Mod. Phys. 73, 515 (2001).
- Loubeyre et al. (2002) P. Loubeyre, F. Occelli, and R. LeToullec, Nature 416, 613 (2002).
- Akahama et al. (2010b) Y. Akahama, M. Nishimura, H. Kawamura, N. Hirao, Y. Ohishi, and K. Takemura, Phys. Rev. B 82, 060101 (2010b).
- Goncharov et al. (2001) A. F. Goncharov, E. Gregoryanz, R. J. Hemley, and H.-K. Mao, Proc. Nat. Acad. Sci. 98, 14234 (2001).
- Hanfland et al. (1993) M. Hanfland, R. J. Hemley, and H.-K. Mao, Phys. Rev. Lett. 70, 3760 (1993).
- Mazin et al. (1997) I. I. Mazin, R. J. Hemley, A. F. Goncharov, M. Hanfland, and H.-K. Mao, Phys. Rev. Lett. 78, 1066 (1997).
- Singh et al. (2014) R. Singh, S. Azadi, and T. D. Kühne, to be published (2014).
- Cui et al. (1995) L. Cui, N. H. Chen, and I. F. Silvera, Phys. Rev. B 51, 14987 (1995).
- Howie et al. (2012b) R. T. Howie, T. Scheler, C. L. Guillaume, and E. Gregoryanz, Phys. Rev. B 86, 214104 (2012b).
- Liu and Ma (2013) H. Liu and Y. Ma, Phys. Rev. Lett. 110, 025903 (2013).
- Magdău and Ackland (2013) I. B. Magdău and G. J. Ackland, Phys. Rev. B 87, 174110 (2013).
- Kaxiras et al. (1991) E. Kaxiras, J. Broughton, and R. J. Hemley, Phys. Rev. Lett. 67, 1138 (1991).
- Perdew and Levy (1983) J. P. Perdew and M. Levy, Phys. Rev. Lett. 51, 1884 (1983).
- Städele and Martin (2000) M. Städele and R. M. Martin, Phys. Rev. Lett. 84, 6070 (2000).
- Barbee III et al. (1989) T. W. Barbee III, A. Garcia, and M. L. Cohen, Nature 340, 369 (1989).
- Richardson and Ashcroft (1997) C. F. Richardson and N. W. Ashcroft, Phys. Rev. Lett. 78, 118 (1997).