Microwave spectroscopic observation of distinct electron solid phases in wide quantum wells
A. T. Hatke, Yang Liu, B. A. Magill, B. H. Moon, L. W. Engel, M. Shayegan,
L. N. Pfeiffer, K. W. West, K. W. Baldwin
National High Magnetic Field Laboratory, Tallahassee, Florida 32310, USA
Department of Electrical Engineering, Princeton University, Princeton, New Jersey 08544, USA
In high magnetic fields (), two dimensional electron systems (2DESs) can form a number of phases in which interelectron repulsion plays the central role, since the kinetic energy is frozen out by Landau quantization. These phases include the well-known liquids of the fractional quantum Hall effect (FQHE), as well as solid phases with broken spatial symmetry and crystalline order. Solids can occur1, 2, 4, 3, 5, 6, 7, 8 at the low Landau filling () termination of the FQHE series, but also within integer quantum Hall effects (IQHEs)9. Here, we present microwave spectroscopy studies of wide quantum wells (WQWs) 10, 11, 12, 13, 14. The spectra clearly reveal two distinct solid phases, hidden within what in dc transport would be the zero diagonal conductivity of an integer quantum Hall effect state. Explanation of these solids is not possible with the simple picture of a Wigner solid (WS) of ordinary (quasi) electrons or holes.
Solid phases of carriers are insulators, owing to pinning by disorder, and are not easily distinguishable from other types of insulators by standard dc transport measurements, but rather by a characteristic resonance, at frequency in their microwave conductivity spectra16, 5, 9, 15. These resonances are understood as pinning modes16, 5 in which pieces of the solid oscillate within the disorder potential, as diagrammed in Fig. 1(a). Pinning modes have been found both near the low termination of the FQHE series5, 15 and within the -ranges of IQHE plateaus9. In the weak pinning picture17, 18, 19 increases when the shear modulus, , decreases, for example by decreasing the density, 20. The inverse relation of and is because carriers associate more closely with minima in the disorder potential17, 18, 19. Consistent with this picture, in wells narrower than those studied here9, a solid within the IQHE range shows a monotonic decrease of as moves away from the quantizing filling, which increases the charge density of the solid.
Here we report pinning modes whose exhibits an upward step as is decreased from 1, in contrast to the monotonic decrease of that was seen in narrower wells. The phenomenon is seen in WQWs, in which the effective electron-electron interaction is softened at short range due to the large growth-direction extent of the wave function. A wider well, or a larger , cause the step to move closer to . We provide a natural interpretation, based on the sensitivity of to the properties of the solid, that the step signals a transition between different solids.
Our samples came from two WQW wafers with different width, . Henceforth in this paper all will be in units of cm-2 for brevity. One WQW has nm, depth of the 2DES from the top nm, and as-cooled . The other has nm, nm, and as-cooled . The data were taken with a charge distribution that is approximately symmetric about the well center (see Methods). Microwave data were taken using the set-up in Figs. 1(b) and (c) .
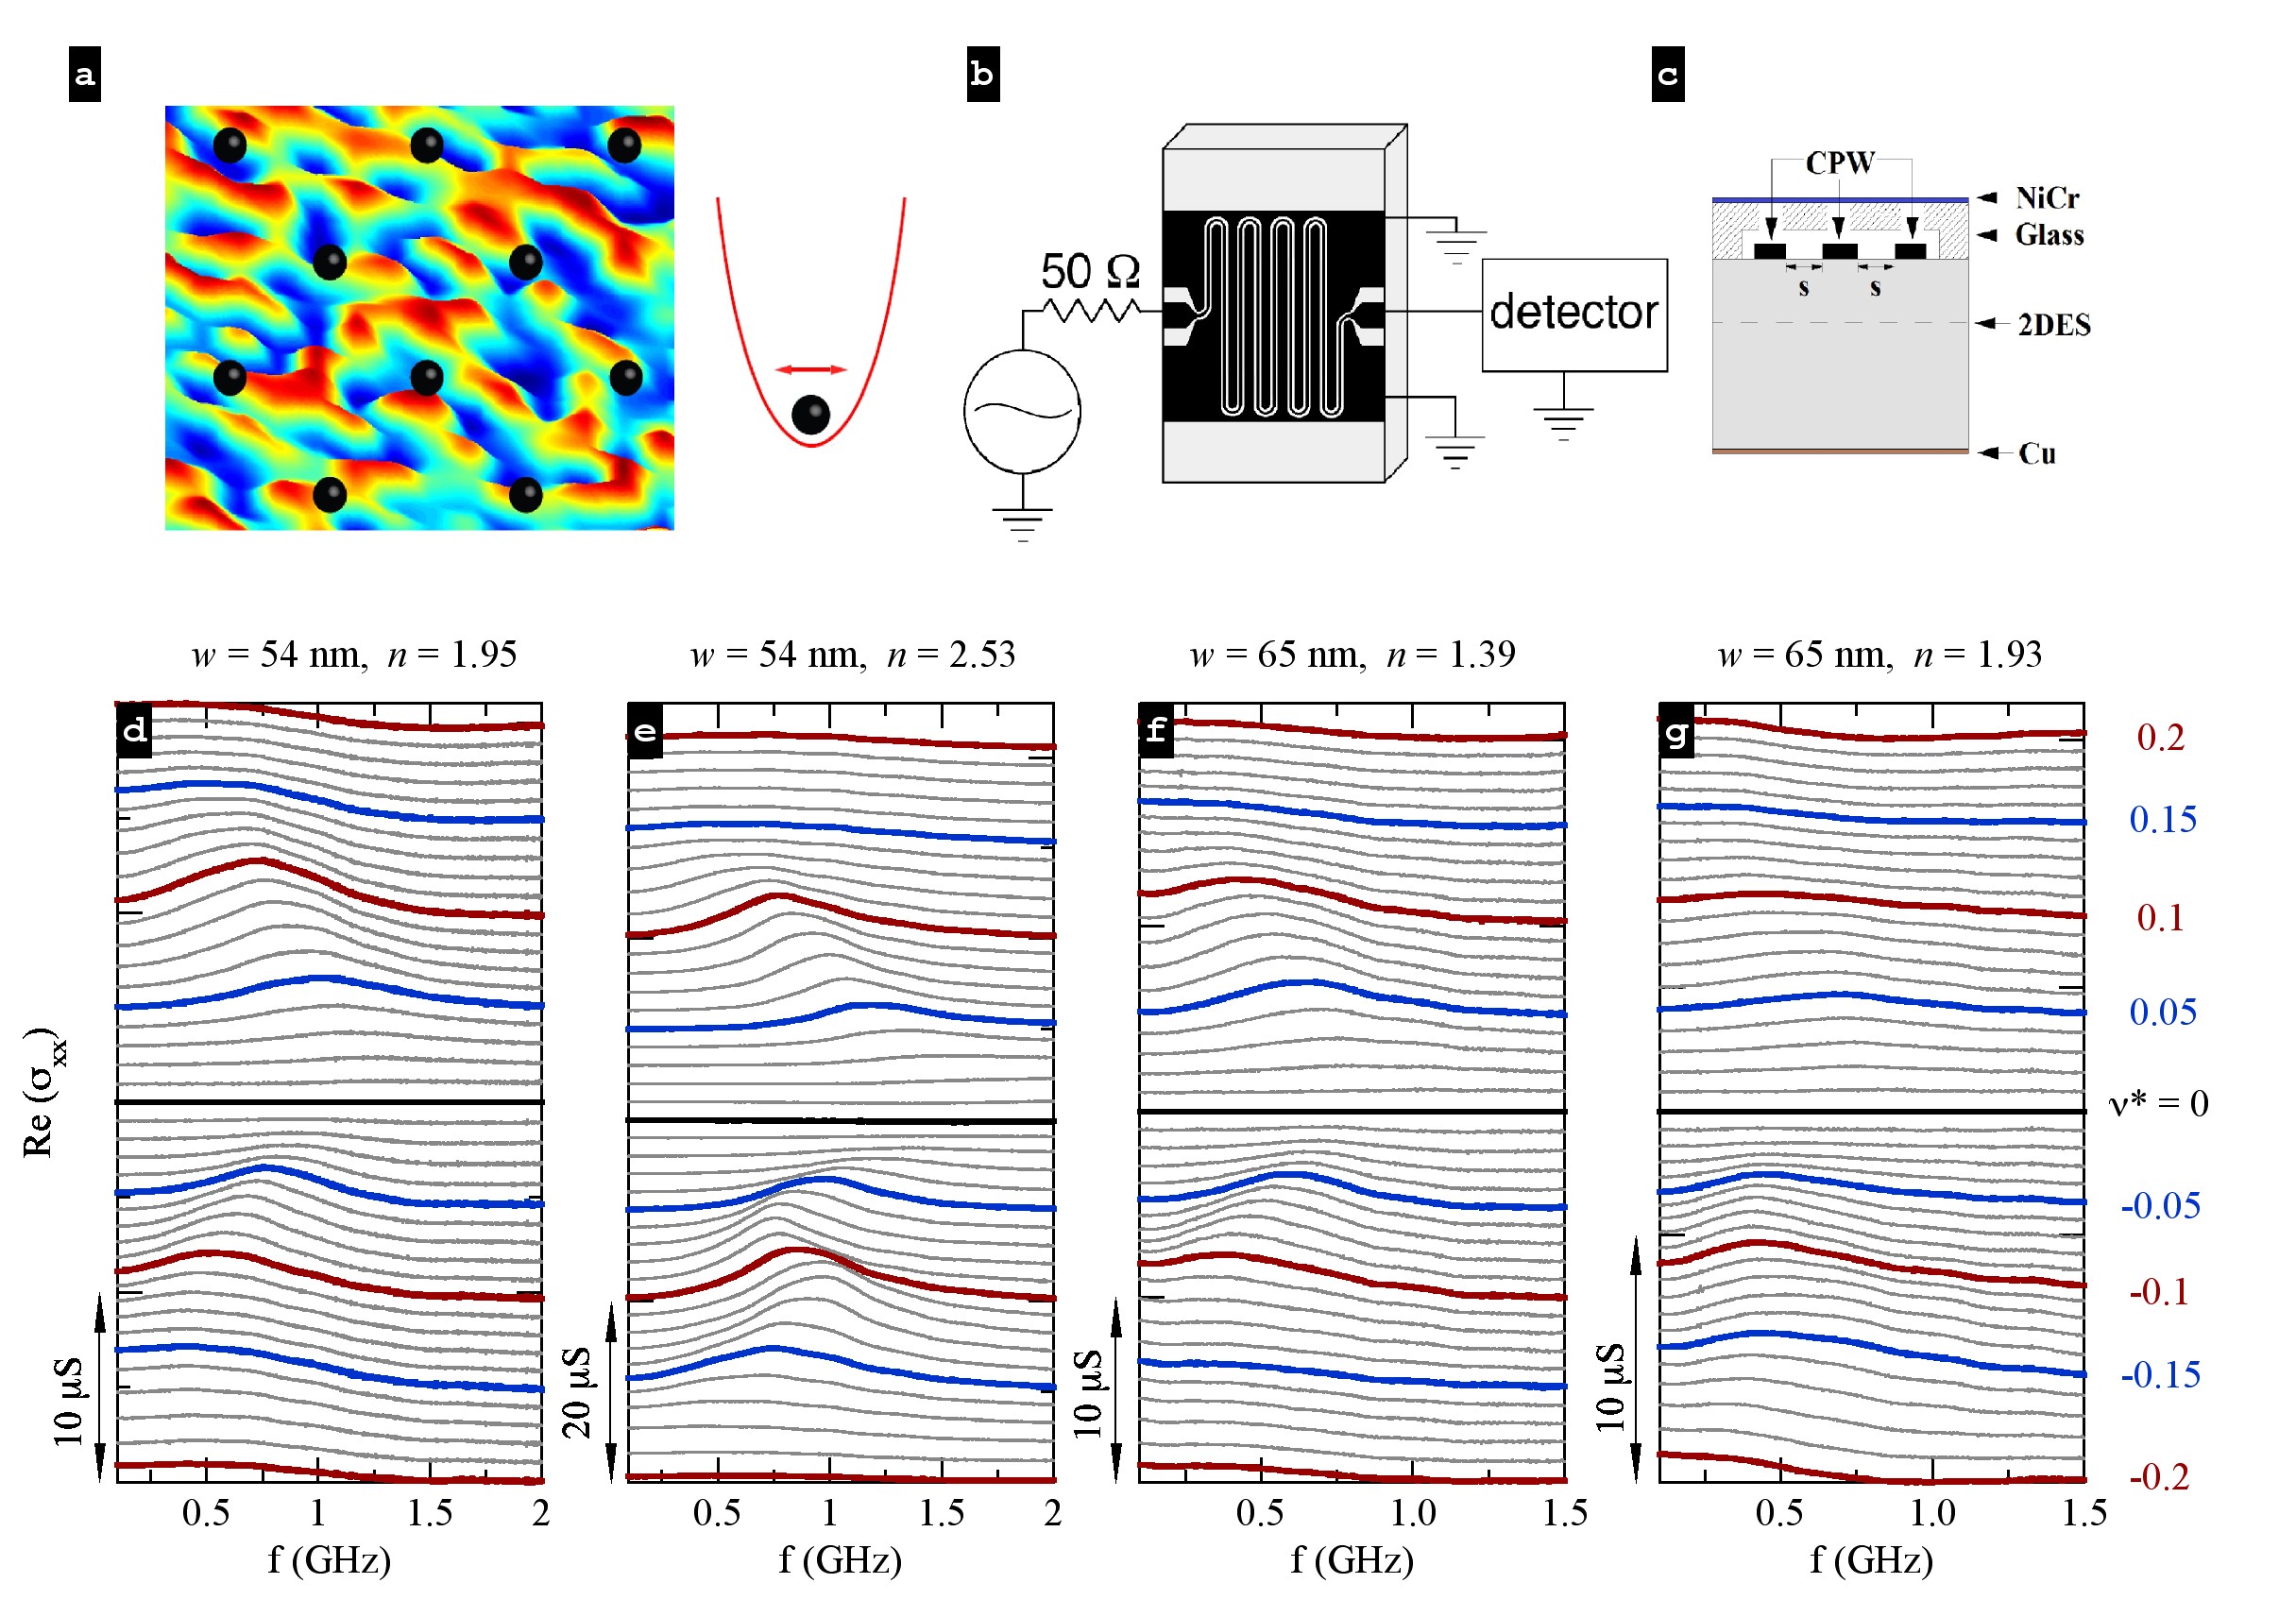
The spectra in Figs. 1(d)-(g) give an overview of the evolution of the resonance with Landau filling at different for the two WQWs. We present results in terms of , where is nearly proportional to the quasiparticle or hole density. In the smaller- states in Figs. 1(d) and (f), and also for the larger- states in Figs. 1(e) and (g) with , resonances develop as in Ref. 9: as increases the resonance forms, develops maximal absorption around to , and then fades away, all as monotonically decreases with . The resonance development is different for the larger- states with . In Figs. 1(e) and (g) decreases with decreasing but near begins to increase. Further decrease of results in an increase of until , below which again decreases.
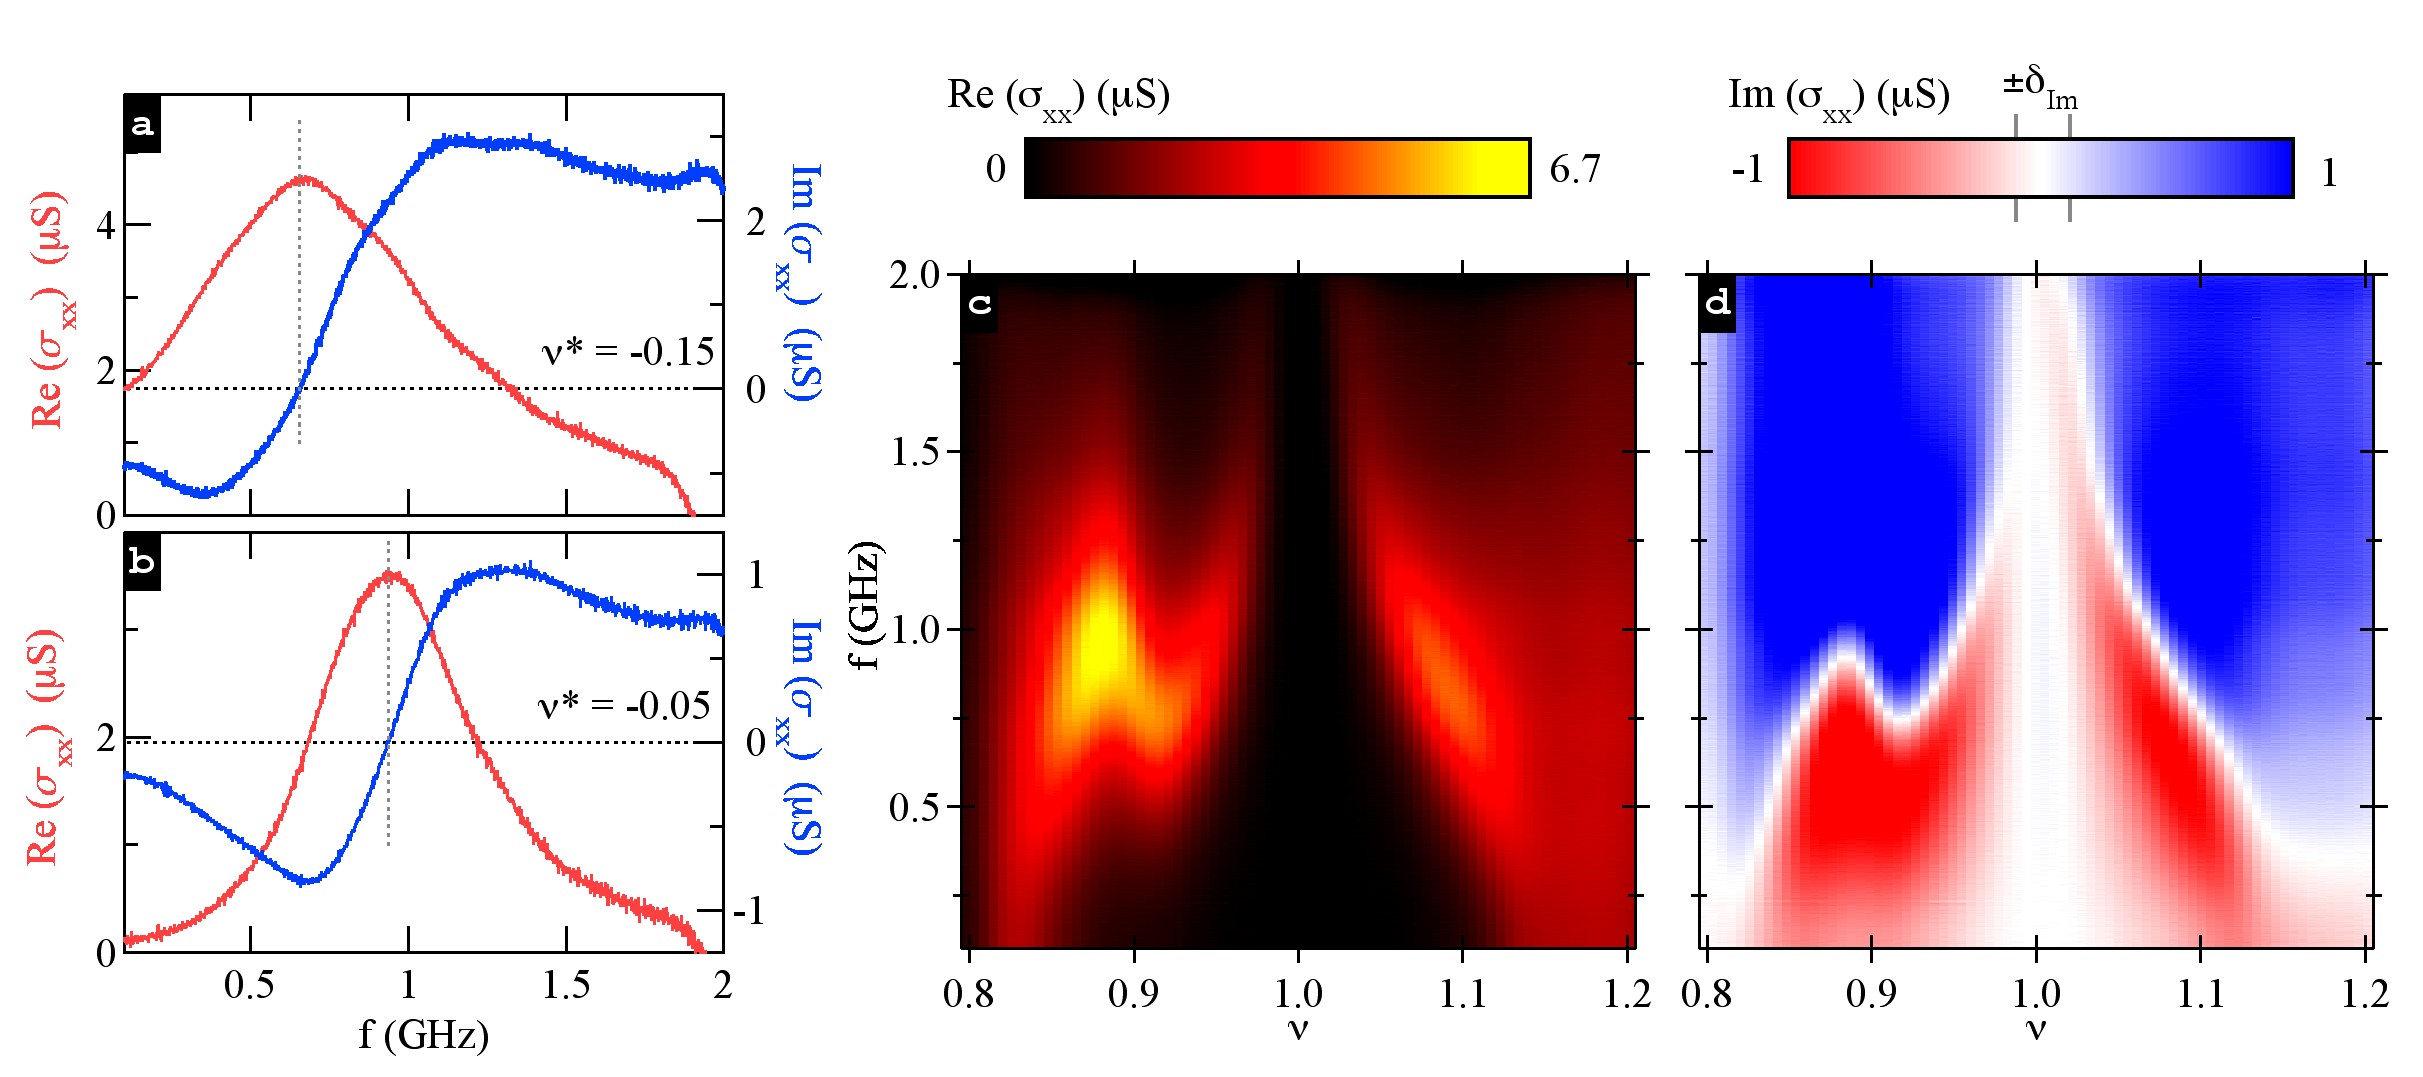
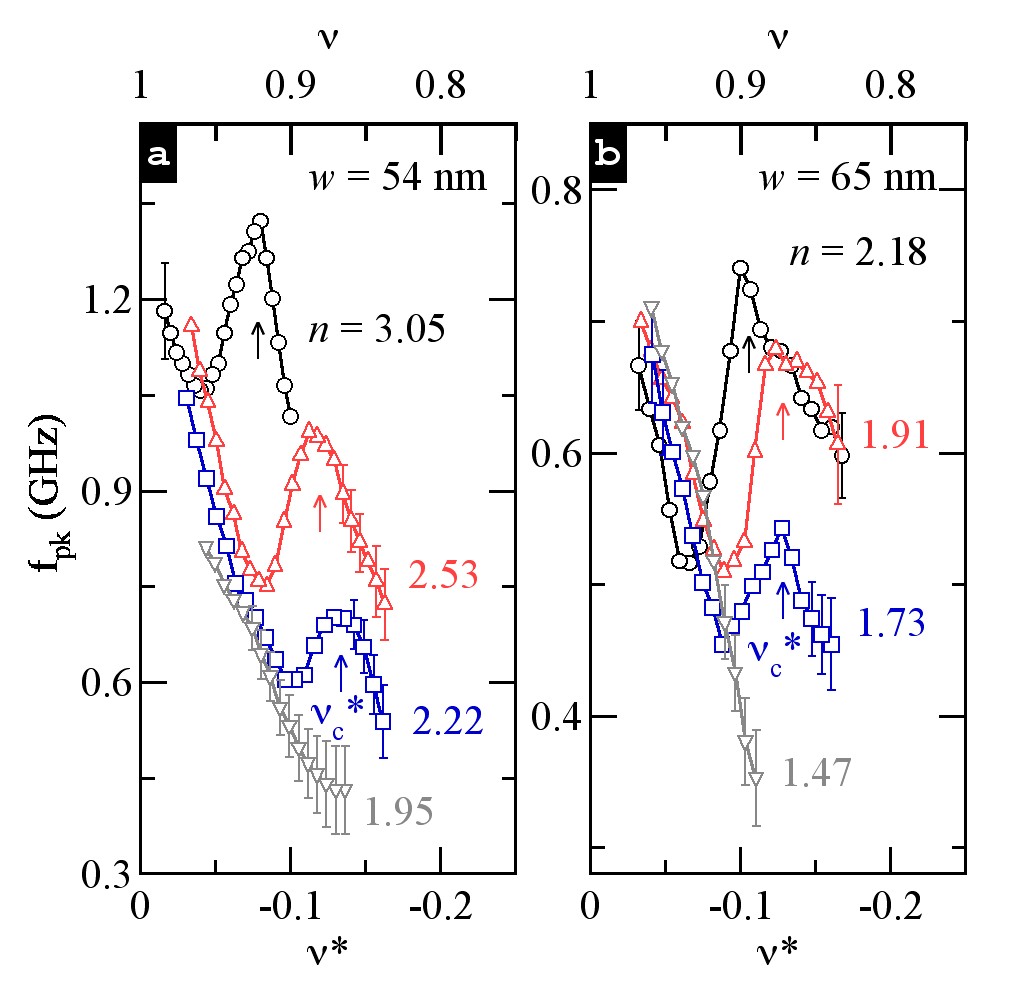
is extracted from the zero crossing of the imaginary conductivity, Im, vs , as explained in Fig. 2. Figure 3 shows plots of vs at several for the two WQWs. For the lowest- traces, vs monotonically decreases, but for larger a local minimum and maximum develop. The minimum and maximum move closer to as increases and are exhibited at lower for the 65 nm sample.
We interpret the results in terms of a transition between two distinct solids. At the lowest for both samples monotonically decreases with . At larger , the vs curves can be divided into two regions. In the smaller regions (closer to ) vs tends toward the lowest- curve, while in the larger regions, to the right of the local maximum in Fig. 3, vs is enhanced relative to the lowest- curve. We take the enhanced as a characteristic of a solid which we call S2. It is distinct from S1, which is the only solid seen in the lowest states of the samples, and which in the larger states is closer to . With increasing the transition from S2 to S1 moves closer to , and the transition appears at lower in the larger sample. Screening of disorder by larger , rather than a transition between solids, would produce a reduced for larger , in contrast to the observed enhanced . Though we focus on the resonance for , we have, at some of the largest , been able to see the step to enhanced as increases for also. The transition thus appears to occur on both sides of , therefore S2 is favored by larger , and .
We also perform dc transport measurements on the same wafers, and find that the solid-solid transition picture can underlie features found earlier11 in dc transport. WQWs were recently found11 to exhibit ranges that are not contiguous with the IQHE minimum centered at , but still have Hall resistance quantized at and vanishing dc longitudinal resistance (). These regions are called reentrant integer quantum Hall effects (RIQHEs)23 and are due to insulating phases of the partially filled Landau level. At sufficiently high , the RIQHEs appear near 11. The RIQHE range extends toward as is increased by gating, and eventually merges with the main IQHE plateau. The RIQHE was ascribed11 to a WS, which can be favored21 over FQHE liquids in WQWs, owing to the softening of the effective electron-electron interaction at short range. The RIQHE sets in for , where is the magnetic length.
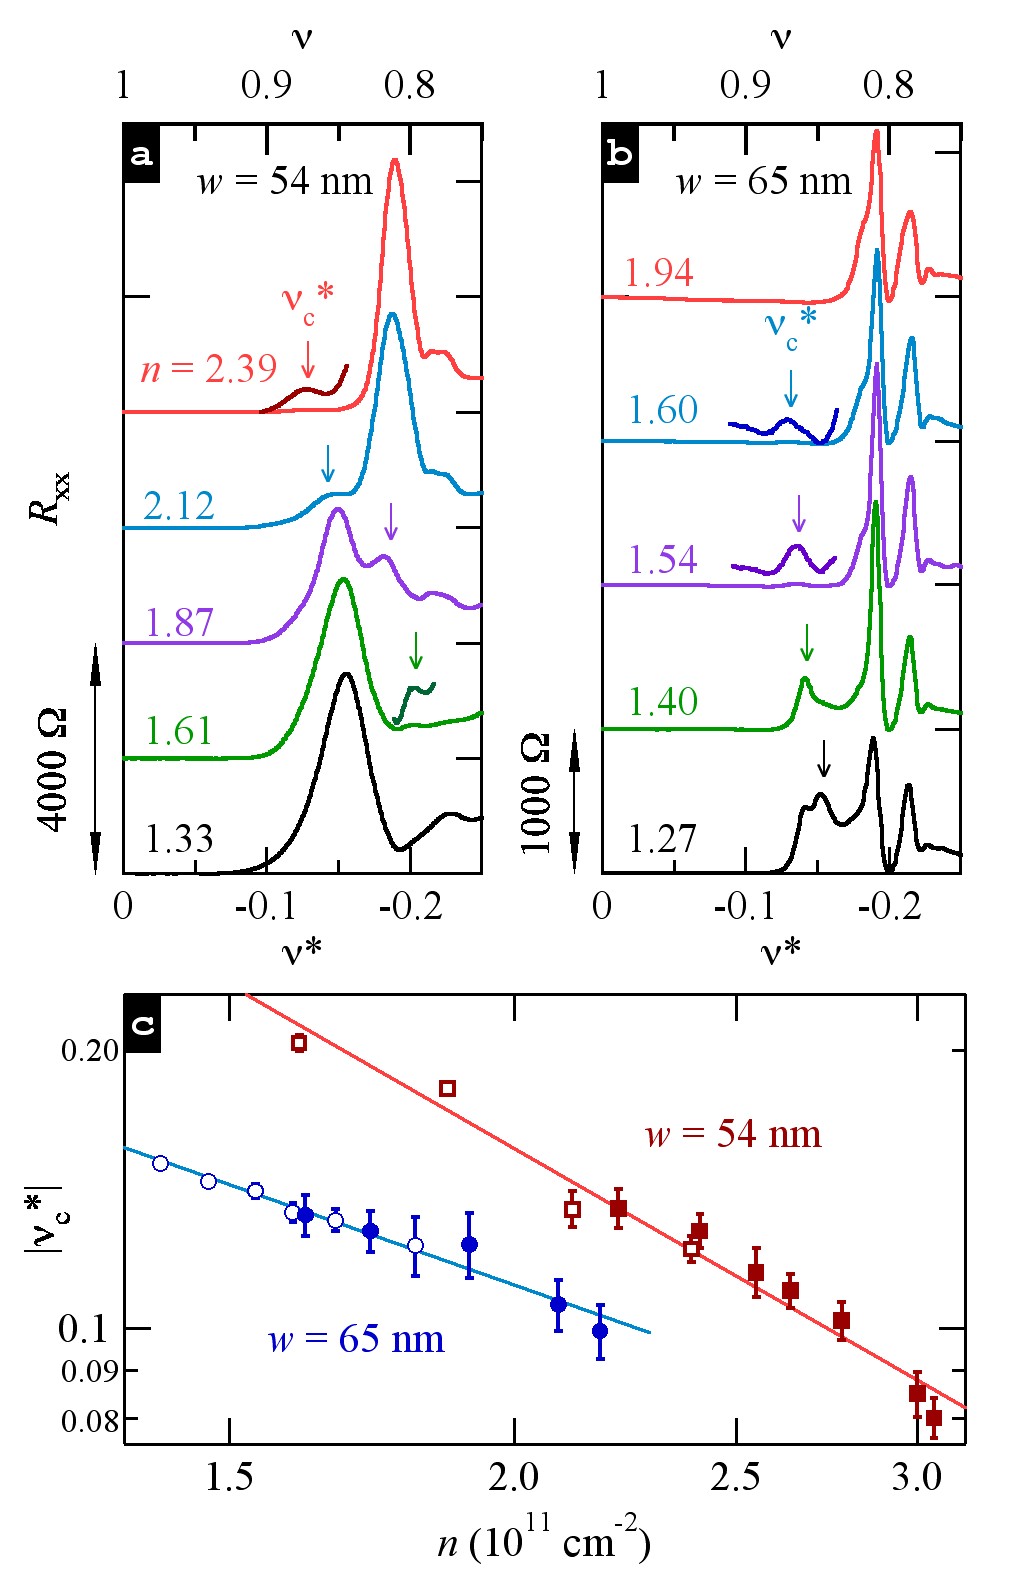
Figures 4 (a) and (b) show plots of vs for the and nm wells at several . Just closer to than the minimum due to the RIQHE, the traces have peaks, both in Ref. 11 and in Figs. 4 (a) and (b), which are denoted with arrows. With increasing the of the peak increases as the RIQHE minimum deepens. At the highest the peak vanishes as the RIQHE minimum merges with the main IQHE minimum. This peak in could be produced by domain-wall conduction at a phase transition11, 22.
To directly compare microwave and dc measurements we define the critical filling as that of the local maximum in the vs measurements and that of the -dependent peak in vs , marked by arrows in Figs. 3 and 4. This results in continuous plots of vs , as shown in Fig. 4 (c), so that S2 can be identified with the dc RIQHE. The -ranges of vs obtained from microwave and dc overlap at intermediate and are remarkably consistent over the entire range. Resonances for S2 set in at larger than required to see the dc transport RIQHE, and can be seen at smaller . When the RIQHE merges with the IQHE the peak at is no longer visible, even when the transition is clearly visible in . Pinning modes are not visible in the RIQHE ranges at larger , possibly because uncondensed carriers are present which dampen the resonance.
Reference 15 reported evolution of the pinning mode with below the termination of the FQHE series, in quantum wells with and nm, but with much lower ( and respectively) than those studied here. For , the spectra appeared irregular with multiple peaks, though well-defined peaks appeared above and below that range. In Ref.15 that range was the same in each sample, and for , the resonance was wave vector () dependent. The dependence was found by comparing transmission lines of different slot width, , (see Methods). Checking for dependence in the present nm WQW sample using m we found none, with excellent agreement between the m vs and the m data shown in Fig. 3(a).
Theories7, 24, 25, 26 have considered crystals of composite fermions (CFs). CFs are categorized by the number, , of vortices bound to a carrier. Theory predicts a series of distinct CF WS (2pCFWS) phases with increasing as decreases7, 24. The transition from to occurs as goes from to . Though is predicted to soften near the transition, well within the 4CFWS it is calculated to be a factor of larger than , and would result in a lower in the 4CFWS. Identifying S2 as a 2CFWS and S1 as a 4CFWS would be consistent with the shear moduli predicted by Ref.7. However, Ref.7 predicts little sensitivity of the phase diagram to , but we do observe dependence of on and .
Are there other possible interpretations for the two solids? A two-component bilayer WS can exist under certain conditions in a WQW13, 12, particularly if the subband gap, , is small enough relative to the Coulomb energy, . Such a two-component WS could have increased disorder and due to charge being pushed closer to the interfaces17, and would be favored by larger , giving smaller carrier spacing, and by larger . For the nm well with typical , , we find from simulations10, 12 that K , which according to Ref.27 is about three times too large for a two-component lattice to form.
A CF ground-state spin transition28, 29 is also unlikely to explain the observed phenomena. The CF spin-Landau levels only cross above the Fermi level29. Though skyrmion solid formation has been reported30 from pinning modes near , at the larger studied here large quasihole density would suppress skyrmion effects.
In summary, near in WQWs, we have found a change in that is naturally interpreted as signature of a transition between two different solids. S2, which exists at larger , larger and larger , has enhanced relative to the other phase. While the origin of the transition remains unclear, the possibilities, particularly of a transition in CFWS vortex number, are of fundamental importance.
Acknowledgements
We thank Jainendra Jain for illuminating discussions.
The microwave spectroscopy work at NHMFL was supported through DOE grant DE-FG02-05-ER46212 at NHMFL/FSU.
The National High Magnetic Field Laboratory (NHMFL), is supported by NSF Cooperative Agreement No. DMR-0654118, by the State of Florida, and by the DOE.
The work at Princeton was funded through the NSF (grants DMR-1305691 and MRSEC DMR-0819860), the Keck Foundation and the Gordon and Betty Moore Foundation (grant GBMF2719).
Methods
For dc measurements the symmetry of the charge distribution about the well center was maintained using the Fourier transform of vs in the Shubnikov-de Haas regime to minimize the gap, , between the lowest and first excited subbands14, 10.
For the microwave measurements, balance of the change between front and back halves of the well was maintained by biasing front and back gates such that individually each would change the carrier density by equal amounts.
Our microwave spectroscopy2 technique 9, 15, 30 uses a coplanar waveguide (CPW) on the surface of a sample. A NiCr front gate was deposited on glass that was etched to space it from the CPW by m. A schematic diagram of the microwave measurement technique is shown in the left panel of Fig. 1(b) and side view of the sample is shown in Fig. 1(c). From the power transmitted through the line, we calculate the diagonal conductivity as , where m is the distance between the center conductor and ground plane, mm is the length of the CPW, and is the characteristic impedance without the 2DES. is the transmitted amplitude at . is the difference between the conductivity and that for ; just at the conductivity is vanishing at low temperature. The microwave measurements were carried out in the low-power limit, where the measurement is not sensitive to the excitation power, and at a temperature of 60 mK. For dc transport measurements no transmission line was used; measurements were performed in a van der Pauw geometry using standard (Hz) lock-in technique at a temperature of about 30 mK, with front and back gates both deposited directly on the sample surfaces.
Author Contributions
A.T.H. performed the microwave measurements, analyzed the data and co-wrote the manuscript.
Y.L. designed, performed and analyzed the dc experiments and did numerical simulations.
B.A.M. and B.H.M. performed initial microwave measurements.
L.W.E. and M.S. conceived and designed the experiment, discussed data analysis, and co-wrote the manuscript.
L.N.P., K.W.W. and K.W.B. were responsible for the growth of the samples.
- Lozovik & Yudson 1975 Lozovik, Y. E. & Yudson, V. Crystallisation of a two dimensional electron gas in magnetic field. JETP Letters 22, 11 (1975).
- Andrei 1988 Andrei, E. Y. et. al. Observation of a magnetically induced Wigner solid. Phys. Rev. Lett. 60, 2765-2768 (1988).
- Goldman et al. 1990 Goldman, V. J., Santos, M., Shayegan, M. & Cunningham, J. E. Evidence for two-dimensional quantum Wigner crystal. Phys. Rev. Lett. 65, 2189–2192 (1990).
- 4 H.-W. Jiang et al. Quantum liquid versus electron solid around Landau-level filling. Phys. Rev. Lett. 65, 633 (1990).
- Williams 1991 Williams, F.I. B. et. al. Conduction threshold and pinning frequency of magnetically induced Wigner solid. Phys. Rev. Lett. 66, 3285-3288 (1991).
- Yang et al. 2001 Yang, K., Haldane, F. D. M. & Rezayi, E. H. Wigner crystals in the lowest Landau level at low-filling factors. Phys. Rev. B 64, 081301 (2001).
- Archer et al. 2013 Archer, A. C., Park, K. & Jain, J. K. Nature of the crystal phase between 1/5 and 2/9 fractional Hall liquids. Phys. Rev. Lett. 111, 146804 (2013).
- Shayegan 1997 Shayegan, M. in Perspectives in quantum Hall effects, edited by S. Das Sarma and A. Pinczuk, 343 (Wiley-Interscience, New York, 1997).
- Chen et al. 2003 Chen, Y. et al. Microwave resonance of the 2D Wigner crystal around integer Landau fillings. Phys. Rev. Lett. 91, 016801 (2003).
- Liu et al. 2011 Liu, Y., Shabani, J. & Shayegan, M. Stability of the fractional quantum Hall states. Phys. Rev. B 84, 195303 (2011).
- Liu et al. 2012 Liu, Y. et al. Observation of reentrant integer quantum Hall states in the lowest Landau level. Phys. Rev. Lett. 109, 036801 (2012).
- Shayegan et al. 1996 Shayegan, M., Manoharan, H. C., Suen, Y. W., Lay, T. S. & Santos, M. B. Correlated bilayer electron states. Semiconductor Science and Technology 11, 1539 (1996).
- Manoharan et al. 1996 Manoharan, H. C., Suen, Y. W., Santos, M. B. & Shayegan, M. Evidence for a bilayer quantum Wigner solid. Phys. Rev. Lett. 77, 1813–1816 (1996).
- Suen et al. 1994 Suen, Y. W., Manoharan, H. C., Ying, X., Santos, M. B. & Shayegan, M. Origin of the fractional quantum Hall state in wide single quantum wells. Phys. Rev. Lett. 72, 3405 (1994).
- Chen et al. 2004 Chen, Y. P. et al. Evidence for two different solid phases of two-dimensional electrons in high magnetic fields. Phys. Rev. Lett. 93, 206805 (2004).
- Fukuyama 1978 Fukuyama, H. & Lee, P. A. Pinning and conductivity of two-dimensional charge-density waves in magnetic fields. Phys. Rev. B 18, 6245-6252 (1978).
- Fertig 1999 Fertig, H. A. Electromagnetic response of a pinned Wigner crystal. Phys. Rev. B 59, 2120–2141 (1999).
- Chitra et al. 2001 Chitra, R., Giamarchi, T. & Le Doussal, P. Pinned Wigner crystals. Phys. Rev. B 65, 035312 (2001).
- Fogler & Huse 2000 Fogler, M. M. & Huse, D. A. Dynamical response of a pinned two-dimensional Wigner crystal. Phys. Rev. B 62, 7553–7570 (2000).
- Li et al. 2000 Li, C.-C. et al. Microwave resonance and weak pinning in two-dimensional hole systems at high magnetic fields. Phys. Rev. B 61, 10905–10909 (2000).
- Price et al. 1995 Price, R., Zhu, X., Das Sarma, S. & Platzman, P. M. Laughlin-liquid˘Wigner-solid transition at high density in wide quantum wells. Phys. Rev. B 51, 2017–2020 (1995).
- Gervais et al. 2004 Gervais, G. et al. Competition between a fractional quantum Hall liquid and bubble and Wigner crystal phases in the third Landau level. Phys. Rev. Lett. 93, 266804 (2004).
- 23 Lilly, M. P. et al. Evidence for an anisotropic state of two-dimensional electrons in high Landau levels. Phys. Rev. Lett. 82, 394 (1999). The RIQHE was first seen in higher Landau levels, and is understood as a signature of bubble phases. Such phases are not predicted for the lowest Landau level, as discussed in Ref. 11.
- Chang et al. 2005 Chang, C.-C., Jeon, G. S. & Jain, J. K. Microscopic verification of topological electron-vortex binding in the lowest Landau-level crystal state. Phys. Rev. Lett. 94, 016809 (2005).
- Narevich et al. 2001 Narevich, F., Murthy, G. & Fertig, H. A. Hamiltonian theory of the composite-fermion Wigner crystal. Phys. Rev. B 64, 245326 (2001).
- Yi & Fertig 1998 Yi, H. & Fertig, H. A. Laughlin-Jastrow-correlated Wigner crystal in a strong magnetic field. Phys. Rev. B 58, 4019 (1998).
- Narasimhan & Ho 1995 Narasimhan, S. & Ho, T.-L. Wigner-crystal phases in bilayer quantum Hall systems. Phys. Rev. B 52, 12291 (1995).
- Du et al. 1995 Du, R. R. et al. Fractional quantum Hall effect around : Composite fermions with a spin. Phys. Rev. Lett. 75, 3926 (1995).
- Yeh et al. 1999 Yeh, A. S. et al. Effective mass and factor of four-flux-quanta composite fermions. Phys. Rev. Lett. 82, 592 (1999).
- Zhu et al. 2010 Zhu, H. et al. Pinning-mode resonance of a skyrme crystal near Landau-Level filling Factor . Phys. Rev. Lett. 104, 226801 (2010).