Melting of Partially Fluorinated Graphene: From Detachment of Fluorine Atoms to Large Defects and Random Coils
Abstract
The melting of fluorographene is very unusual and depends strongly on the degree of fluorination. For temperatures below 1000 K, fully fluorinated graphene (FFG) is thermo-mechanically more stable than graphene but at K FFG transits to random coils which is almost twice lower than the melting temperature of graphene, i.e. 5300 K. For fluorinated graphene (PFG) up to 30 ripples causes detachment of individual F-atoms around 2000 K while for - fluorination, large defects are formed beyond 1500 K and beyond 60 of fluorination F-atoms remain bonded to graphene until melting. The results agree with recent experiments on the dependence of the reversibility of the fluorination process on the percentage of fluorination.
keywords:
melting, fluorographene, molecular dynamics1 Introduction
Several distinct atomic arrangements of adatoms (fluor, hydrogen, chlorine, etc) have been proposed for tuning the electronic properties of graphene (GE) 1, 2, 3. The main advantage of using fluor is that C-F bonds are energetically more stable than e.g. C-H ones 4, 5 because F-atoms posses larger binding and desorption energies to C than H-atoms 1. Furthermore, fluorination is easier to control via temperature and by reactant gases leading to reproducibly precise C/F stoichiometries 6, 7, 8. In the presence of F adatoms C-bonds in graphene transit from sp2 to sp3 hybridization, which turn the conjugated, graphitic C-C bonds into single C-C bonds. The lattice structure results in an Angstrom scale out-of-plane buckled shaped membrane known as chair configuration 4 that influences the high temperature stability of FG. Owing to the properties mentioned above, a complete understanding of the thermal behavior of the FG sheet is hence very important.
Previous studies have shown that, different from graphene, fully fluorinated and also hydrogenated 9, 10 graphene, are more rigid for temperatures up to K. The situation beyond this temperature and up to melting is not yet fully understood. Raman spectroscopy experiments revealed that the fluorination time and the ratio (where and are the number of carbon and fluor atoms, respectively) are two important key factors in the preparation of FG 1, 2. It was found that the process can be reversed for low coverage and during the fluorination process large membrane holes could appear due to losses of C atoms even at room temperature 11, 12. Despite this macroscopic information, the microscopical features and temperature stability is not understood. The aim of this letter is to provide such a detailed microscopic understanding for different level of F coverage and to explain recent experiments. We investigate the importance of the ratio and the modifications induced by vacancy defects on the stability of FG and the melting process.
2 Simulation Method
Molecular dynamics (MD) simulations using reactive force fields (ReaxFF 15, 16, 17) present in the large-scale atomic/molecular massively parallel simulator (LAMMPS) code 18 are used. ReaxFF is a bond-order-dependent potential that describes bond formation and dissociation. Many body interactions such as the valence angle and torsional interactions are formulated as function of bond order. Non bonded interactions, e.g. Coulomb and van der Waals interactions, are included for all pair atoms which are not well treated usually by quantum mechanical methods such as density functional theory (DFT) 19. Excessively close range interactions are avoided by shielding. To account for the van der Waals interaction, a distance-corrected Morse-potential is used. ReaxFF uses the geometry dependent charge calculation scheme (EEM scheme) of Mortier et al 20. Intra-atomic contributions of atomic charges which is required to polarize the atoms, are included in the energy scheme, which allows to apply the force fields to ionic compounds 21. The system energy in ReaxFF consists of a sum of terms:
A detailed general description of each of these terms and their functional forms can be found in the original work 15 and for fluorinated graphene in our previous paper 9. ReaxFF is able to predict very precisely the equilibrium C-F bond length and the C-F bond dissociation energy, close to DFT based energies and geometries for a number of molecules and reactions. We considered square shaped computational unit cells having =1008 C-atoms in the graphene sheet with partial fluorination up to fully fluorinated graphene (FFG). The simulations were performed in the NPT (P=0) ensemble with periodic boundary conditions. Temperature was maintained by the Nosé-Hoover thermostat 22 and the MD time-step was taken to be 0.1 fs.
The partial covered samples (PFG) were designed by adding randomly F atoms equally distributed on both sides of an initially flat graphene lattice 9 such that each carbon gets maximum one fluorine atom. The dependence of the averaged lattice parameter with increasing F concentration was found to be in agreement with recent results 23.
To account for the melting transition we analyzed the variation of the total potential energy per atom with temperature identifying partial contributions from C-atoms () and F-atoms (). The Lindemann criterion was used to characterize the ordered state by considering the modified parameter , used previously for 2D systems 24, 25.
3 Results
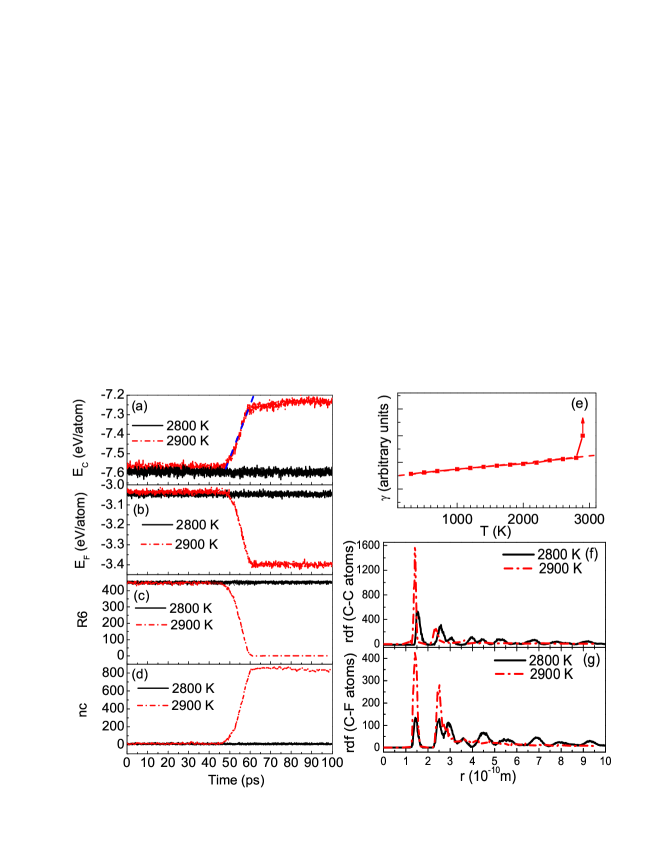
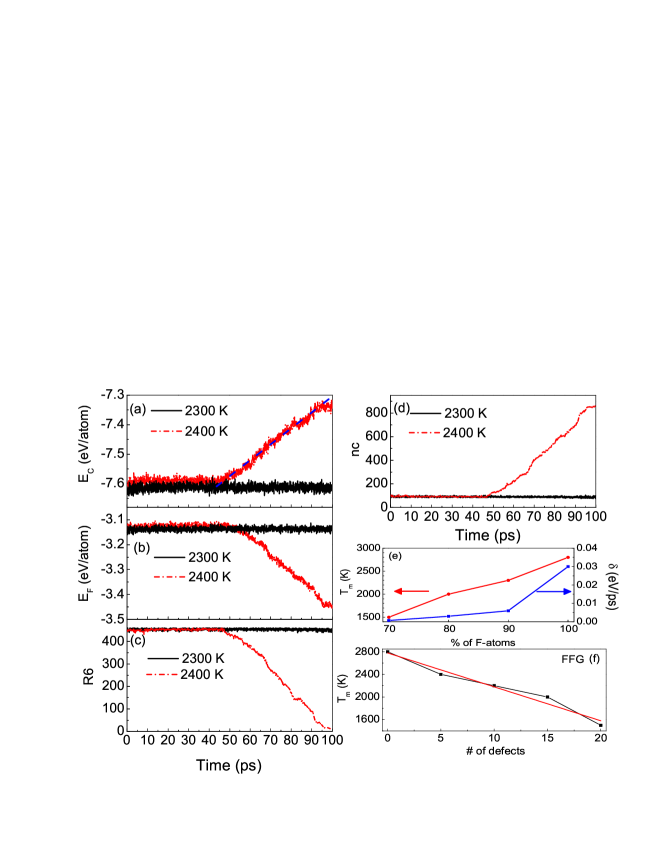
We first analyze the case of FFG. Figures 1(a,b) show the variation of the potential energy per atom of carbon and fluor atoms, i.e. and respectively, with time at K and K. The sharp increase (decrease) in , which is about 4.5 ( about ), is a signature of melting at K. During melting, (10 ps) the number of six-membered rings (R6) of the crystalline phase is reduced (Fig. 1(c)) and chains composed by single C-atoms bonded to F-atoms are formed (Fig. 1(d)). The melting temperature K is further confirmed by the Lindemann parameter (Fig. 1(e)). Due to the strong covalent nearest-neighbor C-C interaction increases linearly up to close the melting temperature where it diverges.
After melting the C-atoms in the single chains remain bonded to the F-atoms, i.e. a spaghetti of 3D-polymers constructed from C-F monomers (a snap shot of the molten FFG will be shown in Fig. 4(c)). For large simulation time the molten structure is composed of C-chains which form an entangled three-dimensional network which looks more like a polymer gel than a simple liquid 13. The larger reduction in suggests that F atoms prefer to be bonded to carbon atoms of rings/chains rather than the carbons of GE. This indicates that in experiments during fluorination F atoms first prefer to be bonded to defective regions, where the environment is more similar to a C-chain. The radial distribution function (rdf) indicates that the C-C distance in chains is shorter and after melting (double bonds appear) only one significant peak remains (see Fig. 1(e)). However the C-F rdf in Fig. 1(e) shows that after melting there are two significant peaks which correspond to the appearance of -C-F2 and -C-F bonds. In the case of PFG, conjugated C-C double bonds in the non-fluorinated parts coexist at low temperatures with covalent C-F bonds in corrugated fluorocarbon regions 26, 27. However the behavior at higher temperature is more complicated. We found three different melting processes depending on the fluor percentage:
3.1 Low fluorination
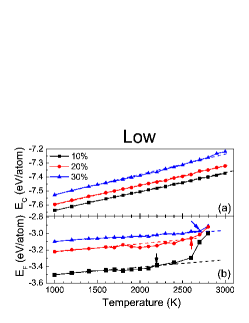
(-). In Figs. 2 (a,b) we display and against temperature. The main feature here is evaporation of F-atoms and the formation of large rings, e.g. R10, R14. While increases linearly against temperature due to a smooth expansion of the C-C inter-atomic distance (small deviations are due to the formation of large rings), because of C-F bond breaking, instead behaves non-linear (and obtains higher energies: F atoms are in the gas phase, see Fig. 4(a)) with Temperature (indicated by the arrows). Detachment starts around K and continues until almost all the F-atoms are removed from the membrane 29. With further increase in temperature, the Lindemann criterion indicates that melting occurs at 5100 K, 4500 K and 3500 K for 10, 20 and 30 fluorination, respectively and F-atoms are less likely to be bonded to the GE. Thus, the linear increase in , Fig. 2(a), shows that the PFGs with turns into pristine graphene (with a few number of rings) around 3000 K.
3.2 Intermediate fluorination
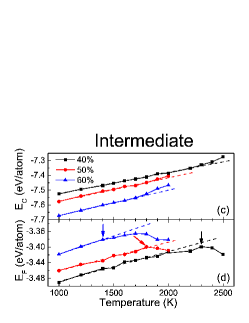
(-). In this regime at about K, shows small deviations from the linear behavior due to the formation of large defective rings (Fig. 2(c)). In contrast to the case of low ratio, shown in Fig. 2(d), becomes more negative since F-atoms instead of being detached from the sheet, now break the original local bonds and are transferred to the edges of the rings (a snapshot of this configuration is shown in Fig. 4(b)). Then, at the melting temperature clusters of C-F are formed near the defects and they detach from the sheet. The microscopic configurations consist of a mixture of 2D and 3D phases.
3.3 High fluorination
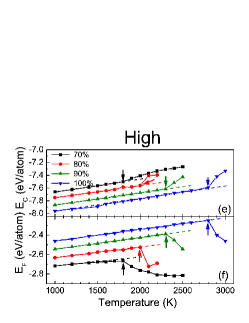
(-). Finally, in the high-fluorination regime with increasing temperature large ripples develop while F atoms remain bonded to graphene until melting occurs. Now, receives positive contributions due to the breaking of C-C bonds at melting (Fig. 2(e)) and since the C-F bond becomes stronger is reduced (Fig. 2(f)). The microscopical features of melting in this case posses similar characteristics as FFG. Notice that arrows in Fig. 2 are not pointing necessarily to the melting transitions, instead they indicate mostly evaporation (b) and defect formation thresholds Figs. 2(d,f). The reduction in indicates the appearance of polymers consisting of C-F monomers. The average melting temperatures were estimated from the behavior of the Lindemann parameter. Starting from , when we increase further the F-content is seen to pass a minimum around and then increases due to the suppression of long wave-length ripples 9.
We depict the energy variation during melting for a typical case of fluorination in Figs. 3(a,b). Here, the number of hexagons approach zero and many single chains are formed as shown in Figs. 3(c,d). From the slope of versus time we obtain the rate at which the hexagonal crystal structure of the sample becomes lost (e.g. dashed blue curve in Fig. 3(a) shows ). Values of are shown in Fig. 3(e) together with . The main result is that the larger the ratio , the higher the melting temperature and the faster that melting takes place.
4 Effect of vacancies on the melting of FFG
It is important to study the effect of the presence of atomic vacancies in FFG on the melting temperature. We performed several additional simulations for FFG with number of vacancies which were randomly distributed over FFG, i.e. and . The presence of atomic defects in the GE sheet makes it less stiff 30 and consequently results in a lowering of the melting temperature, see Fig. 3(f). The melting temperature is fitted by the red line Tm(N)=a+bN, where a=(278075) K, b=(-606) K and N is the number of vacancies. These results clearly indicate that Tm decreases sharply as the number of defects in the FFG increases.
5 Discussion
FFG is an insulator with a large band gap while graphene shows metallic properties, thus one naturally expects the transition from GE to FFG by increasing the ratio . This gives the appropriate melting trend for a typical metal to an insulator. However, the melting of GE and FFG is different because of their 2D-nature. The existence of flexural phonons makes GE and FFG also different from typical 3D crystals 5 and the bending rigidity is a temperature dependence parameter 31, 32. Although at low temperature FFG is thermo-mechanically more stable than GE, by increasing temperature, due to the excitation of the vibrational C-F mode, in FFG the entropy term increases faster with T which is being responsible for the observed lower melting temperature.
In PFG the distribution of masses through the system is non-uniform, hence the vibrational frequencies are not well defined and are position dependent. This randomness in the system produces very large out-of-plane fluctuations even at low temperature. This broadening in the frequency range brings the system closer to the melting transition point.
Moreover, for a low ratio when we heat the system F-atoms are evaporated in order to reduce the total energy. Then, the system behaves like pristine graphene and evaporated F atoms have no chance to be re-bonded to the system. For intermediate ratio , the concentration of F atoms in some random domains make the system unstable due to the growth in the mean square value of the height fluctuations resulting in the formation of ring-defects with increasing temperature and the melting of this new defected FG is more complex. Finally, for high fluorination we deduce that the melting temperature is proportional to the coverage percentage, e.g. decreasing the coverage percentage from 100 to 90 (80) decreases the melting temperature with about 16 (30).
Lets now compare our results with recents experiments 1, 2. Raman spectra of graphene after exposure to atomic F shows dramatic changes induced by fluorination: the D peak emerges at early times of fluorination and the 2D peak is suppressed which indicates that F atoms are bonded to C atoms and atomic defects appear. The process of fluorination has been shown to be reversible only when the exposure time is relatively short ( hours) and the concentration of F atoms is presumably low. FFG is obtained only for longer exposure time, beyond 30 hours, where the evaporation of F atoms and the restoring to pristine graphene is impossible. In our simulations, we found that for low coverage percentage (less than 40) increasing the temperature causes evaporation of F atoms and almost pristine graphene can be recovered in agreement with experiment. However, percentage beyond 40 are related to long time fluorination ( 20 hours) where the process was reported to be irreversible. The presence of vacancies decrease dramatically the melting temperature. Indeed, in experimental PFG samples containing a few vacancies it was found that when they were heated up to much lower temperatures (500-700 K) it was possible to restore to not-perfect pristine graphene 1.
6 conclusion
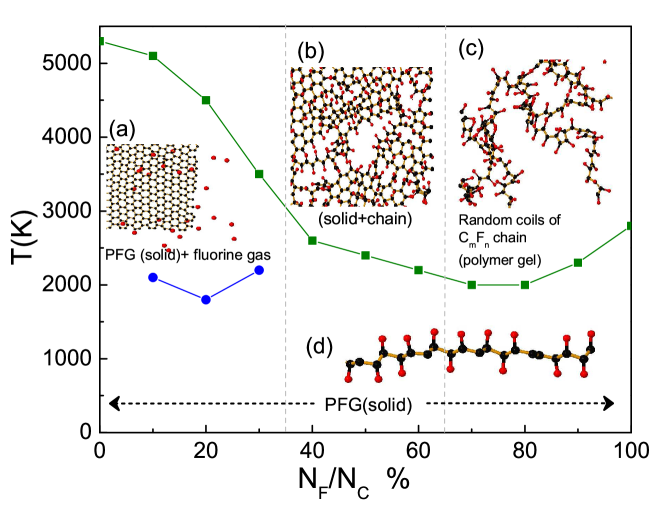
The phase diagram displayed in Fig. 4 summarizes our results: green squares refer to the transition temperature and blue circles indicate the starting point of evaporation of F-atoms. Two insets (b) and (c) show a top views of the system after the transition points, inset (a) shows top view of a snap shot of a system which lost fluor and inset (d) shows a side view of a typical PFG at low temperature. The PFG above the blue symbols for looses fluor and become pristine graphene with some defects and above the green line it transits to the liquid phase, however for 40-60 above the green line and below (5000 K) PFG does not loose F and very slowly transits to the liquid phase so that below 5000 K the liquid and the solid phases coexist. For larger 60-100 above the green curve PFGs rapidly transits to a 3D liquid phase. The minimum melting temperature is found to be around 70 fluorination. The vertical dashed lines separate three different regions for different percentage of F atoms. Our findings are therefore consistent with the experimental reversibility of the fluorination process in single layer graphene.
This work was supported by the EU-Marie Curie IIF postdoc Fellowship/299855 (for M.N.-A.), the ESF-Eurographene project CONGRAN, and the Flemish Science Foundation (FWO-Vl). Financial support from the Collaborative program MINCyT(Argentina)-FWO(Belgium) is also acknowledged.
References
- 1 Nair, R.; Ren, W.; Jalil, R.; Riaz, I.; Kravets, V.; Britnell, L.; Blake, P.; Schedin, F.; Mayorov, A.; Yuan, S.; Katsnelson, M.; Cheng, H.; Strupinski, W.; Bulusheva, L.; Okotrub, A.; Grigorieva, I.; Grigorenko, A.; Novoselov, K.; Geim, A. K. Fluorographene: A Two-Dimensional Counterpart of Teflon. Small 2010, 6, 2877.
- 2 Zboril, R.; Karlicky, F.; Bourlinos, A. B.; Steriotis, T. A.; Stubos, A. K.; Georgakilas, V.; Saf rov , K.; Janc k, D.; Trapalis, C.; Otyepka, M. Graphene Fluoride: A Stable Stoichiometric Graphene Derivative and its Chemical Conversion to Graphene. Small 2010, 6, 2885.
- 3 Elias, D. C.; Nair, R. R.; Mohiuddin, T. M. G.; Morozov, S.V.; Blake, P.; Halsall, M. P.; Ferrari, A. C.; Boukhvalov, D. W.; Katsnelson, M. I.; Geim, A. K.; Novoselov, K. S. Control of Graphene’s Properties by Reversible Hydrogenation: Evidence for Graphane. Science 2009, 323, 610.
- 4 Sofo, J. O.; Chaudhari, A. S.; Barber, G. D. Graphane: A two-dimensional hydrocarbon. Phys. Rev. B 2007, 75, 153401.
- 5 Leenaerts, O.; Peelaers, H.; Hernández-Nieves, A. D.; Partoens, B.; Peeters, F. M. First-principles investigation of graphene fluoride and graphane. Phys. Rev. B 2010, 82, 195436.
- 6 Withers, F.; Dubois, M.; Savchenko, A. K. Electron properties of fluorinated single-layer graphene transistors. Phys. Rev. B 2010, 82, 073403.
- 7 Lee, W. H.; Suk, J. W.; Chou, H.; Lee, J.; Hao, Y.; Wu, Y.; Piner, R.; Akinwande, D.; Kim, K. S.; Ruoff, R. S. Selective-area fluorination of graphene with fluoropolymer and laser irradiation. Nano Lett. 2012, 12, 2374.
- 8 Robinson, J. T.; Burgess, J. S.; Junkermeier, C. E.; Badescu, S. C.; Reinecke, T. L.; Perkins, F. K.; Zalalutdniov, M. K.; Baldwin, J. W.; Culbertson, J. C.; Sheehan, P. E. Properties of Fluorinated Graphene Films. Nano Lett. 2010, 10, 3001.
- 9 Singh, S. K.; Srinivasan, S. G.; Neek-Amal, M.; Costamagna, S.; van Duin, A. C. T.; Peeters, F. M. Thermal properties of fluorinated graphene. Phys. Rev. B 2013, 87, 104114.
- 10 Costamagna, S.; Neek-Amal, M.; Los, J. H.; Peeters, F. M. Thermal rippling behavior of graphane. Phys. Rev. B 2012, 86, 041408(R).
- 11 Paupitz, R.; Autreto, P. A. S.; Legoas, S. B.; Goverapet Srinivasan, S.; van Duin, A. C. T.; Galvão, D. S. Graphene to fluorographene and fluorographane: a theoretical study. Nanotechnology 2013, 24, 035706.
- 12 Cheng, S. H.; Zou, K.; Okino, F.; Gutierrez, H. R.; Gupta, A.; Shen, N.; Eklund, P. C.; Sofo, J. O.; Zhu, J. Reversible fluorination of graphene: Evidence of a two-dimensional wide bandgap semiconductor. Phys. Rev. B 2010, 81, 205435.
- 13 Singh, S. K.; Neek-Amal, M.; Peeters, F. M. Melting of graphene clusters. Phys. Rev. B 2013, 87, 134103.
- 14 Zakharchenko, K. V.; Fasolino, A.; Los, J. H.; Katsnelson, M. I. Melting of graphene: from two to one dimension. J. Phys.: Condens. Matter 2011, 23, 202202.
- 15 van Duin, A. C. T.; Dasgupta, S.; Lorant, F.; Goddard III, W. A. ReaxFF: A Reactive Force Field for Hydrocarbons. J. Phys. Chem. A 2001, 105, 9396.
- 16 van Duin, A. C. T.; Damst, J. S. S. Computational chemical investigation into isorenieratene cyclisation. Org. Geochem. 2003, 34, 515.
- 17 Chenoweth,K.; van Duin, A. C. T.; Goddard III, W. A. ReaxFF Reactive Force Field for Molecular Dynamics Simulations of Hydrocarbon Oxidation. J. Phys. Chem. A 2008, 112, 1040.
- 18 Plimpton, S. Fast Parallel Algorithms for Short-Range Molecular Dynamics. J. Comput. Phys. 1995, 117, 1.
- 19 Boukhvalov, D.; Katsnelson, M. Chemical functionalization of graphene. J. Phys.: Condens. Matter 2009, 21, 344205.
- 20 Mortier, W. J.; Ghosh, S. K.; Shankar, S. Electronegativity-equalization method for the calculation of atomic charges in molecules. J. Am. Chem. Soc. 1986, 108, 4315.
- 21 Touhara, H.; Okino, F. Property control of carbon materials by fluorination. Carbon 2000, 38, 241.
- 22 (a) Hoover, W. G. Canonical dynamics: Equilibrium phase-space distributions. Phys. Rev. A 1985, 31, 1695. (b) Nosé, S. A molecular dynamics method for simulations in the canonical ensemble. Mol. Phys. 1984, 52, 255.
- 23 Junkermeier, C. E.; Reinecke, T. L.; Badescu, S. C. Highly Fluorinated Graphene. arxiv:1302.6878.
- 24 (a) Bedanov, V. M.; Gadyak, G. V.; Lozovik, Yu. E. On a modified Lindemann-like criterion for 2D melting. Phys. Lett. A 1985, 109, 289. (b) Bedanov, V. M.; Peeters, F. M. Ordering and phase transitions of charged particles in a classical finite two-dimensional system. Phys. Rev. B 1994, 49, 2667.
- 25 Zheng, X. H.; Earnshaw, J. G. On the Lindemann criterion in 2D. Europhys. Lett. 1998, 41, 635.
- 26 Zhang, W.; Spinelle, L.; Dubois, M.; Guérin, K.; Kharbache, H.; Masin, F.; Kharitonov, A. P.; Hamwi, A.; Brunet, J.; Varenne, C.; Pauly, A.; Thomas, P.; Himmel, D.; Mansot, J. L. New synthesis methods for fluorinated carbon nanofibres and applications. J. Fluorine Chem. 2010, 131, 676.
- 27 Giraudet, J.; Dubois, M.; Guérin, K.; Delabarre, C.; Hamwi, A.; Masin, F. Solid-state NMR study of the post-fluorination of (C2.5F)n fluorine-GIC. J. Phys. Chem. B 2007, 111, 14143.
- 28 Nair, R. R.; Sepioni, M.; Tsai, I. L.; Lehtinen, O.; Keinonen, J.; Krasheninnikov, A. V.; Thomson, T.; Geim, A. K.; Grigorieva, I. V. Spin-half paramagnetism in graphene induced by point defects. Nat. Phys. 2012, 8, 199.
- 29 The small reduction in the potential energy curves in the temperature range K is due to the appearance of a few large defects (i.e. big rings R10 and R14).
- 30 Neek-Amal, M.; Peeters, F. M. Linear reduction of stiffness and vibration frequencies in defected circular monolayer graphene. Phys. Rev. B 2010, 81, 235437.
- 31 Costamagna, S.; Dobry, A. From graphene sheets to graphene nanoribbons: Dimensional crossover signals in structural thermal fluctuations. Phys. Rev. B 2011, 83, 233401.
- 32 Singh, S. K.; Neek-Amal, M.; Costamagna, S.; Peeters, F. M. Thermomechanical properties of a single hexagonal boron nitride sheet. Phys. Rev. B 2013, 87, 184106.