Detection of Class I Methanol (CH3OH) Maser Candidates in Supernova Remnants
Abstract
We have used the Karl G. Jansky Very Large Array (VLA) to search for 36 GHz and 44 GHz methanol (CH3OH) lines in a sample of 21 Galactic supernova remnants (SNRs). Mainly the regions of the SNRs with 1720 MHz OH masers were observed. Despite the limited spatial extent covered in our search, methanol masers were detected in both G1.40.1 and W 28. Additional masers were found in Sgr A East. More than 40 masers were found in G1.40.1 which we deduce are due to interactions between the SNR and at least two separate molecular clouds. The six masers in W 28 are associated with the molecular cloud that is also associated with the OH maser excitation. We discuss the possibility that the methanol maser may be more numerous in SNRs than the OH maser, but harder to detect due to observational constraints.
Subject headings:
Masers — supernovae: individual(W 28, G1.40.1, SgrAEast) — ISM: supernova remnants – ISM: clouds1. Introduction
In the last few years Class I methanol (CH3OH) masers have been associated with supernova remnants (SNRs). The new capabilities of the Karl G. Jansky Very Large Array (VLA) enabled the detection of 36 GHz methanol masers in the Sgr A East molecular cloud/SNR interaction region (Sjouwerman et al., 2010). In the same region, 44 GHz methanol masers have been found (Yusef-Zadeh et al., 2008; Pihlström et al., 2011). These transitions are pumped by collisions, similar to 1720 MHz OH masers. The 1720 MHz OH maser transition has been recognized as an important molecular tracer of shocks in SNRs (Wardle & Yusef-Zadeh, 2002) and, through extensive observations and theory, became a signpost for the interaction of SNRs with molecular clouds (Claussen et al., 1997; Green et al., 1997; Koralesky et al., 1998; Brogan et al., 2000; Hewitt et al., 2008). The OH molecule is formed downstream of a compression-type shock that has propagated into a molecular cloud (at 2030 km s-1) with densities of order cm-3 at temperatures of 30120 K. Under these conditions a strong collisionally pumped maser transition results for the OH molecule at 1720 MHz (Elitzur, 1976; Lockett et al., 1999; Wardle, 1999; Hewitt et al., 2009). The values of the physical conditions predicted have been verified by various multiwavelength observations of SNRs harboring OH 1720 MHz masers (Frail & Mitchell, 1998; Reach et al., 2005; Lazendic et al., 2010; Brogan et al., 2013). Radiative pumping of the 1720 MHz maser is also possible, in which case it is usually accompanied by bright 1665 MHz and 1667 MHz emission, as observed in star forming regions and evolved stars (Cragg et al., 2002; Karlsson et al., 2003). A detection of a single 1720 MHz OH maser, without a trace of emission at other OH hyperfine transitions (at 1612, 1665 and 1667 MHz) is however unambiguous proof of an interaction, unlike other tracers such as HI or CO emission. From previous VLA observations it was concluded that methanol masers in Sgr A East are located near, but not perfectly co-spatial with the 1720 MHz OH masers indicating that they trace different shocks or different regions of the shock.
Theoretical modeling of methanol shows that the brightest shock-excited masers are expected for the transitions at 36.169 GHz and at 44.070 GHz, with weaker masers at the 84.521 GHz and 95.169 GHz transitions (Morimoto et al., 1985; Cragg et al., 1992). As can be expected, the collisionally pumped 36 GHz and 44 GHz maser lines of methanol have been found associated with outflows in star forming regions (e.g., Kalenskii et al., 2010; Fish et al., 2011). Further work on star forming regions suggest that these methanol maser transitions can be excited over a larger range of densities and temperatures than 1720 MHz OH. Statistical equilibrium calculations supported by large velocity gradient modelling of the maser spectra in specific sources estimate parameter ranges of cm-3 and K (Leurini et al., 2007; Pratap et al., 2008). Litovchenko et al. (2012) further reports on a 35% detection rate of 1720 MHz OH masers in sample of sources harboring collisionally pumped methanol masers. Compared to the 1720 MHz OH which is only detected in 10% of all Galactic SNRs, the expanded range of physical conditions allowing methanol maser action potentially makes methanol a new and more widespread signpost for SNR-molecular cloud interactions. If methanol masers would be detected in a higher percentage of SNRs than OH masers, they open up the possibility to, e.g., further constrain models of hadronic cosmic ray acceleration in SNRs. Such models depend strongly on distance and density (e.g., Drury et al., 1994; Kelner et al., 2006; Cristofari et al., 2013). Molecular lines like OH and methanol are excited under certain conditions and density ranges, yielding density estimates when detected. The maser velocities often agree very accurately with the SNR systemic velocity (Larionov & Val’tts, 2007), allowing the line velocities to be used for kinematic distance estimates, and possibly in the longer term for even more accurate distance measurements using trigonometric parallaxes.
This paper reports on the results of using methanol as a possible SNR/molecular cloud interaction tracer. In Sect. 2 and 3 we describe the observations and results, respectively, which then are discussed in Sect. 4.
| Source | Other name | Right Ascension aaPositions are from Green’s Catalogue of Supernova Remnants (Green, 2009) | Declination aaPositions are from Green’s Catalogue of Supernova Remnants (Green, 2009) | Distance | Ptgs | SNR Size | % Covered | |
|---|---|---|---|---|---|---|---|---|
| (J2000) | (kpc) | (km s-1) | (36 GHz) | () | (36 GHz) | |||
| G189.1 | IC 433 | 06 18 02.7 | 22 39 36 | 1.5 | 7 | 4525 | 1.0 | |
| 1 | 0.1 | |||||||
| G346.6 | 17 10 19.0 | 40 10 00 | 11 | 3 | 88 | 7.3 | ||
| G348.5 | CTB 37A | 17 15 26.0 | 38 28 00 | 8 | 9 | 1515 | 6.3 | |
| 1 | 0.7 | |||||||
| G349.7 | 17 17 59.0 | 38 28 00 | 11 | 5 | 2.52 | 100 | ||
| G357.7 | 17 38 35.0 | 30 44 00 | 6.4 | 4 | 2424 | 1.1 | ||
| G357.70.1 | MSH 17-39 | 17 40 29.0 | 30 58 00 | 6 | 1 | 2020 | 0.4 | |
| G359.1 | 17 45 30.0 | 29 57 00 | 5 | 6 | 2424 | 1.6 | ||
| G000.0 | Sgr A East | 17 45 44.0 | 29 00 00 | 8.5 | bbCenter frequency shifted slightly at a few scheduling blocks to cover a larger velocity range | 28 | 3.52.5 | 100 |
| 1 | 17.9 | |||||||
| G001.05 | 17 48 30.0 | 28 09 00 | 8.5 | 1 | 88 | 2.4 | ||
| G001.4 | 17 49 39.0 | 27 46 00 | 8.5 | 5 | 1010 | 7.8 | ||
| G005.7 | 3.2 | 1 | 48 | 4.9 | ||||
| G005.4 | Milne 56 | 18 02 10.0 | 24 54 00 | 5.2 | 1 | 3535 | 0.1 | |
| G006.4 | W 28 | 18 00 30.0 | 23 26 00 | 2 | 29 | 4848 | 2.0 | |
| G008.7 | W 30 | 18 05 30.0 | 21 26 00 | 3.9 | 1 | 4040 | 0.1 | |
| G009.7 | 18 07 22.0 | 20 35 00 | 4.7 | 1 | 1511 | 0.9 | ||
| G016.7 | 18 20 56.0 | 14 20 00 | 14 | 1 | 44 | 9.8 | ||
| G021.8 | Kes 69 | 18 32 45.0 | 10 08 00 | 11 | 1 | 2020 | 0.4 | |
| G031.9 | 3C 391 | 18 49 25.0 | 00 55 00 | 9 | 2 | 75 | 8.9 | |
| G032.8 | Kes 78 | 18 51 25.0 | 00 08 00 | 11 | 1 | 1515 | 0.7 | |
| G034.7 | W 44 | 18 56 00.0 | 01 22 00 | 2.5 | 23 | 3025 | 4.8 | |
| G049.2 | W 51C | 19 23 50.0 | 14 06 00 | 6 | 1 | 2520 | 0.3 | |
2. Observations
We report on the results from two VLA programs (10B-146 and S3115). Our sample was drawn from all SNRs with known 1720 MHz OH masers, and therefore known to interact with a molecular cloud (Frail, 2011). Of those, the 21 listed in Table 1 have declinations that can be observed from the VLA.
Data were taken during the fall of 2010 and spring of 2011, with the VLA Ka- and Q-band systems to observe the 36.169 GHz and the 44.070 GHz lines. Sgr A East was only observed in the 44 GHz transition, as another observing program was already ongoing for the 36 GHz transition. The array was in C, CnB and B configurations, resulting in synthesized beam sizes of 0.15″2.4″ at 36 GHz and 0.12″2.5″ at 44 GHz with typical synthesized beam sizes of 0.30″0.15″ and 0.25″0.13″, respectively. The VLA field-of-view at 36 GHz and 44 GHz is 1.25′ and 1.02′. In comparison, all SNRs have a large angular extent (see Table 1), and with the small primary beams at Ka- and Q-band, for most sources only a limited part of the SNR angular extent could be covered. The small field-of-view relative to the SNR size presents a challenge for the survey. Our solution was to target the majority of the methanol survey pointings toward the positions of previously known hydroxyl (OH) masers. This strategy was used to good effect in our initial methanol detections in Sgr A East. A few additional pointings in G1.40.1 included positions where the radio continuum showed features (peaks/ridges). Additional observations in W 28 pointed toward shocked gas as indicated by the presence of H2 emission. In total, 84 (or 108) pointings were observed in S3115 and 21 (or 26) pointings in 10B-146 at 36 GHz (or 44) GHz respectively.

The data were calibrated using NRAO’s Astronomical Image Processing System (AIPS) and imaged with robust weighting using standard AIPS procedures. Each observation used 256 frequency channels over 8 MHz bandwidth, resulting in a channel width of 31.25 kHz or 0.26 and 0.21 km s-1 at 36 GHz and 44 GHz respectively. The bandwidth covered a velocity range of 67 km s-1 and 55 km s-1 at 36 GHz and 44 GHz respectively, which was centered at the velocity of the OH masers ( in Table 1). In some cases two velocity settings were used, also noted in Table 1. For each pointing position, the on-source integration time was approximately 10 minutes. The precise integration time varied somewhat between the positions depending on how the observations fit within a 2 hour scheduling block. Typical final rms noises are between 7 and 10 mJy per channel, respectively. No continuum emission was found in the fields.
| Source | Transition | Pointing | Maser position | V | V | Ipeak | |
|---|---|---|---|---|---|---|---|
| (GHz) | RA (J2000) | Dec (J2000) | (km s-1) | (km s-1) | (Jy/beam) | ||
| G000.0 | 36,44 | Multiple | MultipleaaMore than 100 detections were made in Sgr A East at both 36 GHz and 44 GHz. The detailed results of these detections are reported on in a separate paper by Sjouwerman et al., in preparation. | ||||
| G001.4 | 36 | A | 17 49 31.09 | 27 47 36.3bbAt the edge of the primary beam. | 1.6 | 0.09 | |
| 36 | B | 17 49 38.77 | 27 44 22.1 | 1.6 | 0.16 | ||
| 36 | B | 0.5 | 0.16 | ||||
| 36 | B | 17 49 38.41 | 27 44 18.8 | 1.0 | 0.28 | ||
| 36 | B | 17 49 38.23 | 27 44 19.0 | 0.5 | 0.14 | ||
| 0.3 | 0.23 | ||||||
| 36 | B | 17 49 38.15 | 27 44 16.8 | 0.8 | 0.23 | ||
| 36 | B | 17 49 38.09 | 27 44 19.9ccContains multiple spectral features, only the brightest and most distinct ones listed. | 1.0 | 0.20 | ||
| 1.6 | 0.17 | ||||||
| 36 | B | 17 49 37.99 | 27 44 17.5ccContains multiple spectral features, only the brightest and most distinct ones listed. | 1.6 | 0.30 | ||
| 0.24 | |||||||
| 36 | B | 17 49 37.91 | 27 44 23.7ccContains multiple spectral features, only the brightest and most distinct ones listed. | 0.5 | 0.30 | ||
| 36 | B | 17 49 37.85 | 27 44 22.0ccContains multiple spectral features, only the brightest and most distinct ones listed. | 1.8 | 0.18 | ||
| 36 | B | 17 49 37.68 | 27 44 23.0ccContains multiple spectral features, only the brightest and most distinct ones listed. | 1.0 | 0.16 | ||
| 36 | B | 17 49 37.08 | 27 44 18.8 | 0.5 | 0.18 | ||
| 36 | B | 17 49 36.82 | 27 44 20.6ccContains multiple spectral features, only the brightest and most distinct ones listed. | 0.8 | 0.25 | ||
| 36 | B | 17 49 36.63 | 27 44 21.3ccContains multiple spectral features, only the brightest and most distinct ones listed. | 1.8 | 0.33 | ||
| B | 0.3 | 0.10 | |||||
| 36 | B | 17 49 36.56 | 27 44 21.1ccContains multiple spectral features, only the brightest and most distinct ones listed. | 2.3 | 0.21 | ||
| B | 0.5 | 0.20 | |||||
| 36 | B | 17 49 36.43 | 27 44 21.9ccContains multiple spectral features, only the brightest and most distinct ones listed. | 0.5 | 0.89 | ||
| B | 1.3 | 0.22 | |||||
| 36 | C | 17 49 48.53 | 27 43 15.8 | 1.6 | 0.09 | ||
| 36 | C | 17 49 48.47 | 27 44 31.2 | 1.0 | 0.09 | ||
| 36 | C | 17 49 48.23 | 27 43 55.0 | 1.8 | 0.18 | ||
| 36 | C | 17 49 47.59 | 27 44 03.1 | 2.3 | 0.07 | ||
| 36 | C | 17 49 47.56 | 27 44 10.4ddPartly outside frequency band. | 0.5 | 0.14 | ||
| 36 | C | 17 49 46.98 | 27 44 10.4 | 0.8 | 0.07 | ||
| 36 | C | 17 49 46.95 | 27 44 16.8 | 1.3 | 0.08 | ||
| 36 | C | 17 49 45.87 | 27 44 11.8 | 0.5 | 0.07 | ||
| 36 | C | 17 49 45.43 | 27 44 19.4 | 0.5 | 0.21 | ||
| 36 | C | 17 49 44.62 | 27 44 35.2 | 0.8 | 0.06 | ||
| 36 | C | 17 49 44.44 | 27 44 07.0 | 0.5 | 0.08 | ||
| 36 | E | 17 49 50.31 | 27 49 03.2 | 2.3 | 0.22 | ||
| 36 | E | 17 49 50.25 | 28 49 03.6 | 2.1 | 0.24 | ||
| 36 | E | 17 49 50.11 | 27 49 03.6 | 1.0 | 0.18 | ||
| 36 | E | 17 49 49.23 | 27 49 09.3 | 1.0 | 0.28 | ||
| 36 | E | 17 49 49.19 | 27 49 07.8 | 0.8 | 0.43 | ||
| 36 | E | 17 49 48.64 | 27 49 27.7 | 2.3 | 0.17 | ||
| 36 | E | 17 49 50.36 | 27 49 51.7bbAt the edge of the primary beam. | 1.8 | 0.18 | ||
| 36 | E | 17 49 51.69 | 27 50 12.3eeOutside the primary beam. | 1.3 | 0.48 | ||
| G006.4 | 44 | 18 01 41.98 | 23 26 59.9 | 0.8 | 1.20 | ||
| 44 | 18 01 42.42 | 23 26 26.7 | 0.6 | 0.16 | |||
| 44 | 18 01 41.97 | 23 26 26.8 | 0.8 | 0.39 | |||
| 44 | 18 01 40.45 | 23 26 12.9 | 0.8 | 0.15 | |||
| 36 | 18 01 52.90 | 23 19 33.0 | 0.8 | 0.07 | |||
| 36 | 18 01 52.93 | 23 19 33.6 | 1.1 | 0.04 | |||
3. Results
3.1. Maser candidates
Table 2 lists all detections with a signal-to-noise ratio exceeding 10. This conservative limit was set because with no prior knowledge peaks with lower signal-to-noise ratios may be the results of random noise in such large cubes. That is, many of the tentative detections with lower signal-to-noise ratios were only made in a single channel, and thus need confirmation. Over 100 detections were made in Sgr A East, which details will be reported separately in a forthcoming paper (see also Sjouwerman et al. (2010), Pihlström et al. (2011)). In W 28 two detections were made at 36 GHz and four at 44 GHz. The 41 detections in G1.40.1 are all at 36 GHz. All emission is detected as unresolved point sources, and with the single exception of a pointing position in G1.40.1 (Sect. 3.3) the lines are narrow consisting of a single spectral feature. An example of a spectral feature is plotted in Fig. 1. The relatively large synthesized beam of the VLA configurations yield lower limits of the brightness temperatures of 300500 K. Such temperatures could imply thermal emission, since the corresponding thermal linewidth would be 0.7-0.9 km s-1 and thus consistent with the widths of many of the detections. On the other hand, a kinetic temperature of several hundred K is high in a molecular cloud. Molecular observations of W 28 infer that the temperature of the gas region heated by the SNR shock is closer to 100 K, with densities of the order of 105 cm-3 (Reach et al., 2005). A test of the excitation and resulting flux of the 36 GHz and 44 GHz lines was made using the radiative transfer code RADEX (van der Tak et al., 2007). The available collision rates for methanol limits the gas temperature in the calculations to be below 200 K. For densities between cm-3 and temperatures up to 200 K, only maser emission can be produced in the 44 GHz transition. Similar results are expected for the 36 GHz line under such conditions, although temperatures above 20 K results in no convergence in the RADEX calculations. A more complete description of modeling of the methanol excitation conditions in SNRs using the radiative transfer code MOLPOP-CEP (Elitzur & Asensio Ramos, 2006) is being prepared in an accompanying paper (McEwen et al., in prep.), and the initial results thereof show that the 36 GHz and 44 GHz transitions are producing maser emission under the given conditions. Combining these results with the fact that several linewidths are narrower than 0.8 km s-1, and that thermal emission tends to be widespread spatially while our detections are very compact and spot-like, it is likely that most of the detections are masers. Future higher resolution observations will better constrain the brightness temperature.
3.2. Methanol and OH spatial comparison
Our main strategy of searching for methanol masers toward OH masers was non-optimum since the bulk of our observations resulted in non-detections. We discuss the reasons for this more detail in §4.1. In a few sources, like Sgr A East, G1.40.1 and W 28, observations included a few fields offset from the OH maser positions. Interestingly, these three sources contain all the methanol masers detected. In G1.40.1 a single detection is found at the edge of the primary beam centered at the OH maser. The remaining 40 masers are found at distances between 3-6 primary beams away from the OH maser, corresponding to approximately 18-36 pc projected distance. In W 28, the two 36 GHz detections and two 44 GHz masers are located within a primary beam distance from the nearest OH maser, while the last two 44 GHz detections are on distances 1-1.5 beams away (1.2-1.8 pc projected distance).
3.3. Methanol and OH velocity comparison
The methanol maser velocities in W 28 are similar to the OH maser velocities at 7 km s-1. This argues that the OH and methanol masers originate from the same molecular cloud and hence are associated with the SNR. In contrast, the majority of the G1.40.1 masers are found at velocities offset from the OH, at and km s-1 close to the edge of the bandpass. A group of masers in G1.40.1 have multiple peaks scattered around km s-1with =210 km s-1. There are indications that more masers may exist at velocities outside the reported velocity range, since some image cubes show possible maser features near the bandpass edges that were excluded.
4. Discussion
4.1. Detection rate
This project aims to determine whether methanol masers are a common tracer of SNR/molecular cloud interactions, in particular compared to the 1720 MHz OH maser tracer. Aside from Sgr A East where many methanol masers were found, so far only two other SNRs yielded methanol masers in the remaining 20 SNRs with OH masers. While this absolute detection rate is not outstanding, there are two main limitations of our search. First, the bandwidth limited the velocity range (67 and 55 km s-1 at 36 GHz and 44 GHz, respectively) over which we searched. This may have excluded masers if they had velocities much offset from the observed 1720 MHz OH masers (Sect. 3.3).
A second, and major limitation is the small field-of-view at these high frequencies. Table 1 lists the SNR extents as measured from low frequency (up to 2 GHz) maps and the fractional area covered in each SNR in our observations. Except for Sgr A East and G349.70.2 only a tiny fraction of each SNR is covered, on average 2.9% and 1.9% at 36 GHz and 44 GHz, respectively. A maser will only be found in an area actually covered by a molecular cloud, and the clouds presumably have a spatial covering factor . The exact value of will vary from source to source and is not known for all individual objects. As an indicator of the size of , observations of W 28 suggest that about 30% of the SNR is covered by dense gas (Arikawa et al., 1999).
The beam area of OH observations with the VLA is 450 to 680 times larger than the 36 GHz or 44 GHz beam, and considering that most of the SNRs were covered to 100% for the OH maser searches, the number of OH masers per unit area (assuming a cloud covering factor of ) is 0.03/arcmin2. Using the area actually covered by the methanol observations, and assuming a cloud covering factor , the corresponding number of 36 GHz and 44 GHz masers per unit area is higher than the OH at 1.2 and 0.17/arcmin2 respectively. These rough estimates exclude the detections in Sgr A East which may be a special case. However, as will be presented in a forthcoming paper, the number of methanol maser detections in Sgr A East greatly exceeds the number of detected OH masers. Therefore, we conclude that the methanol maser detection rate is consistent with methanol masers being at least as common as the OH masers; probably more common.
In addition to very small field-of-views, the consistent angular offset of the methanol from the selected target OH maser positions does not help in improving the detection rate. In Sgr A East, the methanol masers are offset by 30-40″ from the 1720 MHz OH masers (Pihlström et al., 2011). Most SNRs observed in our program are less distant and, using W 28 as an example, such offsets translate to angular offsets of 120-200″ or 2-4 beams away from the OH positions. Thus, our first order observing strategy to search for methanol near OH masers may have actually excluded many.
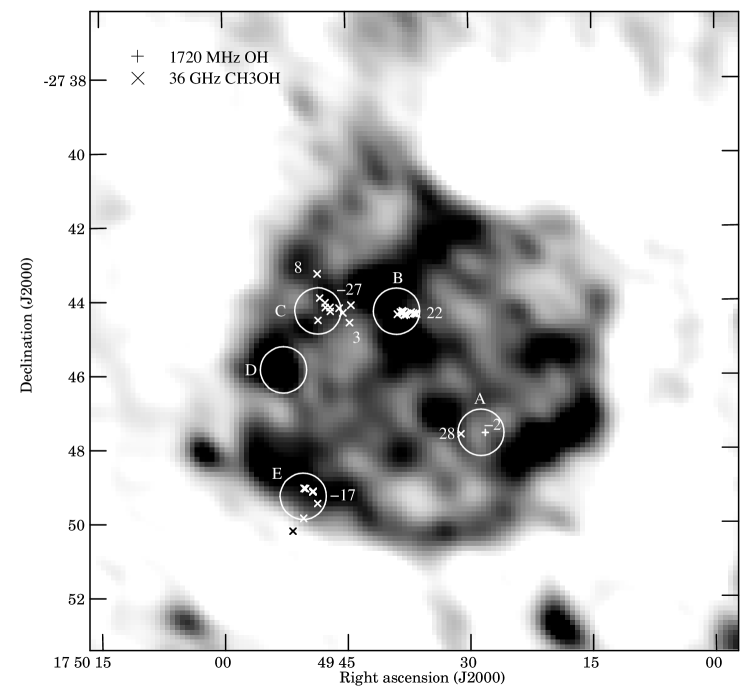
4.2. SNR G1.40.1
The SNR G1.40.1 contains a large number of methanol masers. Figure 2 shows the angular distribution of the masers on a 1.4 GHz gray scale continuum map. Less than 8% of the SNR extent is covered by our observations, implying that more masers may be associated with this object. The mean velocities of the masers at each pointing position, indicated in Figure 2, differs significantly from the velocity of the single 1720 MHz OH maser at km s-1. The methanol is found over the full 60 km s-1 velocity range observed, from about 30 km s-1 to 30 km s-1. Since many masers were detected close to either edge of that range, it is possible that additional masers at higher negative and positive velocities exist.
G1.40.1 has not been studied in much detail as an individual object except for the radio data defining it as an SNR (Liszt, 1992; Gray, 1994; Bhatnagar, S., 2002) and the detection of a 1720 MHz OH maser by Yusef-Zadeh et al. (1999). However, due to its proximity to the Galactic Center the SNR position is covered in a number of surveys toward the GC and coincides with several different species of molecular emission. Oka et al. (1998) performed a survey of 12CO and 13CO of the Galactic Center region including the coordinates of G1.40.1. Both CO isotopes are detected toward the position of G1.40.1, and this region is noted by the authors as belonging to a feature labeled the ’molecular flare’. This flare includes molecular velocities from to km s-1, and consists of both filaments and ’fluffy clouds’. The linewidths are large, consistent with large-scale shocks. Oka et al. (1998) also point out that this region contains arcs and shells of 10-20 pc diameter, implying a dynamic and complex area on the sky. Similarly, Tsuboi et al. (1999) report on CS(1-0) emission in this region, where there is a gap in the CS velocity coverage around 0 km s-1, and two prominent velocity features at 40 and 40km s-1. In their data they define a more distinct feature, where much of the emission belongs to the end of a molecular ridge/streamer arcing in toward the central region of the Galaxy. Comparing these molecular maps to our methanol data, it seems as if G1.40.1 is interacting with two molecular clouds, or with two individual velocity features belonging to the molecular streamer. The negative velocity methanol masers observed at the Eastern side of the SNR agree well with the 40 km s-1 cloud, and similarly, the positive velocity methanol masers at the Western side agree with the 40 km s-1 molecular cloud.
One question to address is whether the methanol masers are associated with an interaction between the SNR and the two molecular clouds observed in CO and CS along the line-of-sight. While the presence of an OH 1720 MHz OH maser normally is taken as a signpost of the passage of a C-type shock (Lockett et al., 1999), the OH maser velocity in G1.40.1 is offset by 5–30km s-1 from the methanol maser velocities. This could perhaps imply that the methanol masers are not associated with the same SNR/molecular cloud interaction. Other possibilities could be like the one explored by (Yusef-Zadeh et al., 2013), where bright 36 GHz methanol maser candidates detected in the inner GC region are explained by an enhanced methanol abundance due to cosmic ray induced photodesorption in molecular clouds. The pumping mechanism of these maser candidates is not clear, but could be from local shocks or, less likely, due to radiation from nearby star formation. However, the offset in velocity between the OH and methanol alone does not exclude an interaction origin. In particular, a similar velocity offset of 5–30km s-1 between the 36 GHz methanol and 1720 MHz OH masers in Sgr A East is observed (Sjouwerman et al., 2010), and may even be a natural consequence of the methanol masers originating closer to the shock front while the OH masers are produced in the post-shock gas. Blue-shifted OH may originate in swept-up gas coming toward us, while methanol is found deeper in the cloud. Other evidence for an interaction may come from morphology of the molecular clouds. Studying the CS and CO channel maps presented by Tsuboi et al. (1999) and Oka et al. (1998), there appears to be a cavity around the extent of the SNR (as outlined by radio continuum), especially significant for the higher velocity cloud on the western side. At the negative velocities, there appears to be an abrupt morphological boundary at the southeastern edge of the remnant, but not as much encompassing morphologically. These morphological signatures (at least for the higher velocities) are remarkably similar to what has been observed in 12CO and 13CO in the SNR 3C397 (Jiang et al., 2010), where a molecular cavity is observed around the SNR. The case for a SNR/cloud interaction in 3C397 is strengthened by a broadening of the blueward side of the spectra toward the interaction region. Comparable kinematical spectral data for G1.40.1 is not readily available in the CS and CO surveys, and it is difficult to make such a detailed study based on the longitude/latitude-velocity plots alone. Additional SNR/cloud interaction evidence may come from emission from shock excited H2 (1-0) S(1), or from line ratios showing a high excitation (e.g., a high CO(2-1)/CO(1-0)) ratio. None of these particular pieces of information currently exists for G1.40.1, but will be explored in the future. However, existing survey data of the Galactic Center region exist in SiO, HCO+ and H13CO+ (Riquelme et al., 2010). From this data we find that the SiO which is often associated with shocks, peaks at +60 km s-1 and around 20 km s-1 across G1.40.1 (extending through the velocities down to +0 km s-1 covered by our methanol search). A similar behaviour is seen also in HCO+ and H13CO+. The presence of shocks is supported by the elevated SiO/HCO+ ratio at the position of G1.40.1 at both cloud velocities. By studying the cubes a signature of a cavity can also be seen like in the CO maps. Again, this signature is much more obvious at the higher velocity cloud.
While there is no conclusive evidence for a SNR/cloud interaction for the clouds where the methanol originates, there is also no evidence for star formation in these clouds causing enhanced methanol abundance or providing pumping. Given the molecular morphology and the supportive evidence of shocks via the OH, SiO and HCO+, an interaction scenario currently seems to best explain the presence of methanol masers.
The positive velocity masers in G1.40.1 (position B in Fig. 2) differ in their characteristics compared to the other masers detected. This group of masers show multiple spectral features, covering a range of velocities. They further align in the East-West direction, which may be a geometry effect, perhaps outlining a region parallel to a shock front where long path lengths of velocity coherent gas exists. Such a shock front may be associated with some of the gas observed in the CO molecular flare region.
All of the masers in G1.40.1 are observed in the 36 GHz transition. Preliminary results from methanol maser modeling (McEwen et al., in prep.) show that the 36 GHz transition dominates at high gas densities. This would imply that the gas may be associated with a shock front, in agreement with what was found in the GC (Sjouwerman et al., 2010). Given the broad overlap in physical conditions under which 36 GHz and 44 GHz methanol masers arise, it is intriguing that 44 GHz masers are not detected in this SNR that is otherwise rich in 36 GHz masers. A possible explanation could be that 44 GHz emission only appears in regions of these molecular clouds at velocities beyond the range observed here.
4.3. SNR W 28
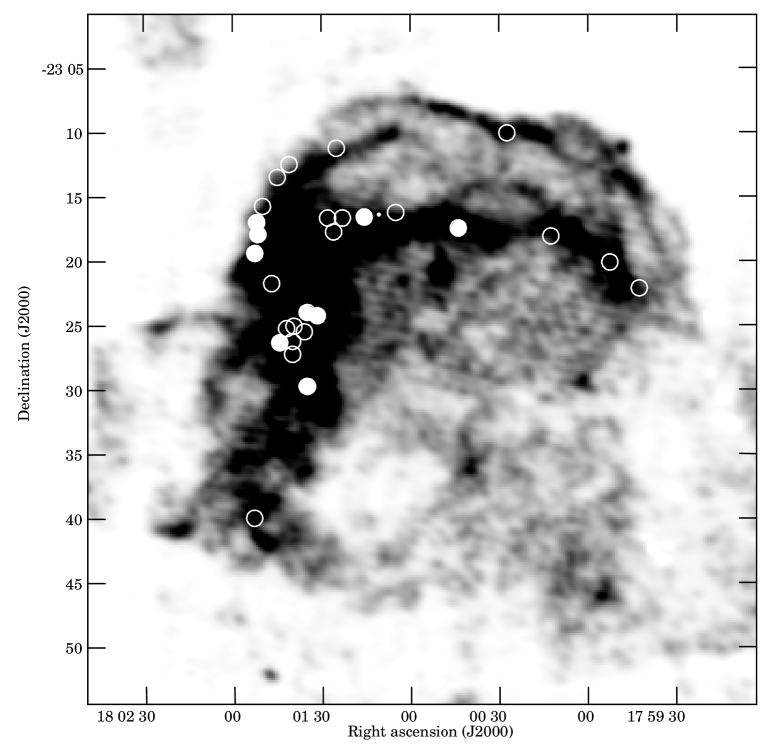
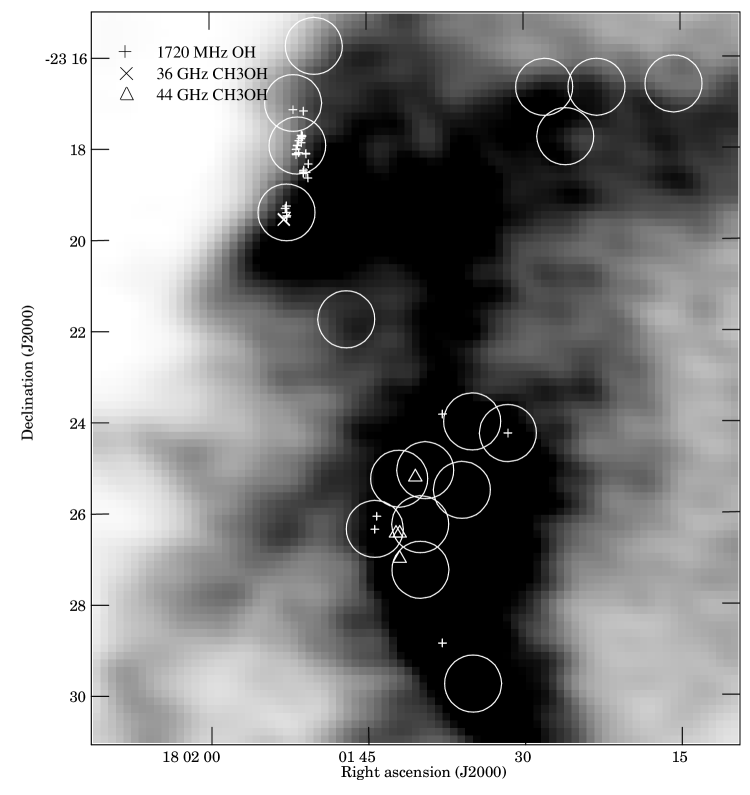
W 28 is the archetype of an SNR interacting with a molecular cloud. The evidence for such an interaction for W 28 comes from several sources. It is the first and best-studied SNR to have larger numbers of shock-excited OH 1720 MHz masers (Frail et al., 1994; Claussen et al., 1997, 1999; Hoffman et al., 2005). Observations of millimeter and near-infrared lines reveal bright clumps of dense molecular gas with broad-line profiles indicative of shock disruption (Arikawa et al., 1999; Reach et al., 2005; Nicholas et al., 2011, 2012). Figure 3 overlays the observed primary beams on a grey scale 327 MHz continuum map of SNR W 28. The beams with OH masers are indicated as filled circles, other observed beams are open circles. A zoom of the Eastern side is shown in Fig. 4, plotting the relative positions of the OH and methanol masers. The methanol masers are all detected within a tight velocity range between 6.88.2 km s-1, with no spread or multiple lines. The close agreement between the velocity of the methanol masers and both the molecular cloud and the OH masers, argues for a physical association rather than a line-of-sight coincidence.
All the masers are found in the northeastern cloud that is thought to delineate a strong interaction of W 28 SNR with a molecular cloud. However, the positions of 44 GHz masers do not not coincide with any 36 GHz masers, implying a density or temperature gradient between the regions. The 36 GHz masers are coincide with the broad line regions defined by Reach et al. (2005) at the northern part of this cloud. The 44 GHz masers are found near the peak of Core 2, a region rich with shocked molecular species including NH3, CS, SiO and thermal CH3OH, detected in the extensive 7 mm and 12 mm surveys by Nicholas et al. (2011, 2012). Of particular interest is this northeastern cloud is also the location of the TeV source HESS J1801233 (Aharonian et al., 2008). Both the Fermi and AGILE satellites have detected GeV emission in this vicinity also (Abdo et al., 2010; Giuliani et al., 2010). The TeV emission is found extending across both groups of masers, but is seems to be stronger near the group of 44 GHz masers. W 28 is thus an interesting source to test hadronic cosmic ray models using masers. This study will be deferred to a future paper.
4.4. Methanol as an SNR/molecular cloud tracer
The formation of methanol molecules is enhanced in regions where icy dust grains are subject to UV rays, cosmic ray irradiation or some other heating mechanism (Whittet et al., 2011). In SNRs no UV irradiation is expected, but in regions where an SNR interacts with the surrounding molecular gas, cosmic rays may be produced and accelerated. Cosmic rays have been shown to be a viable source of heating resulting in widespread methanol maser emission in molecular clouds throughout the inner region of the Galaxy (Yusef-Zadeh et al., 2013). Thus, the interaction between the SNR and the molecular cloud provides a direct source of heating via slow and non-dissociative shocks. In W 28 and G1.40.1 the OH masers indicate such interactions. In G1.40.1 there are at least two distinct molecular clouds interacting with the SNR shell, which probably explains the wealth of masers in this source. The molecular cloud associated with W 28 is displaying less turbulent features, consistent with a more constrained interaction region.
These observations show that Class I methanol masers exist in other SNRs than Sgr A East, and that they are associated with molecular cloud interactions. As such, they are useful line tracers to estimate physical conditions in the interaction regions. It is not yet clear whether they are more abundant than the OH masers due to the limited angular and frequency coverage of our observations. Complete surveys of SNRs are expensive at these frequencies due to the small primary beams.
In Sgr A East we have previously argued that the bright 36 GHz masers are better tracers of the shock front than the 44 GHz masers (Pihlström et al., 2011). Ongoing modeling of methanol maser conditions implies that this situation occurs at relatively high densities, consistent with a special region of the shock front and at higher densities than where the OH is found (McEwen et al., in prep.). The 44 GHz masers may be found deeper in the cloud, where the gas yet has to be compressed and heated by the shock front. With slightly different excitation conditions there may also be a difference in geometry, since bright masers arise along specific, long path lengths of velocity coherent gas. More detailed modeling and comparison of conditions giving rise to the different maser lines will be discussed elsewhere.
5. Summary
We have presented the results of a targeted search for Class I methanol masers in a sample of Galactic SNRs with known 1720 MHz OH masers, and thus a search in SNRs that interact with the surrounding molecular environment. Due to limited angular coverage and a restricted velocity range, the methanol detections were limited to three SNRs: Sgr A East, W 28 and G1.40.1. We conclude that at this point information is insufficient to determine whether methanol masers are better SNR/MC interaction tracers than OH masers, though the brightest 36 GHz methanol maser may trace the denser shock front the most accurate. Surveys covering a larger part of the SNRs are needed or better estimates for the location of methanol (i.e., other than the OH masers) must be determined. Other future work includes radiative transfer modeling of methanol, and applying the maser detections in Sgr A East, W 28 and G1.40.1 to study the hadronic cosmic ray model.
References
- Aharonian et al. (2008) Aharonian, F., Akhperjanian, A. G., Bazer-Bachi, A. R., et al. 2008, A&A, 481, 401
- Abdo et al. (2010) Abdo, A. A., Ackermann, M., Ajello, M., et al. 2010, ApJ, 718, 348
- Arikawa et al. (1999) Arikawa, Y., Tatematsu, K., Sekimoto, Y., & Takahashi, T. 1999, PASJ, 51, L7
- Bhatnagar, S. (2002) Bhatnagar, S., 2002, MNRAS, 332, 1
- Brogan et al. (2013) Brogan, C.L., Goss, W.M., Hunter, T.R., et al., 2013, ApJ, 771, 91
- Brogan et al. (2000) Brogan, C. L., Frail, D.A., Goss, W. M., & Troland, T. H., 2000, ApJ, 537, 875
- Claussen et al. (1997) Claussen, M. J., Frail, D. A., Goss, W. M., & Gaume, R. A., 1997, ApJ, 489, 143
- Claussen et al. (1999) Claussen, M. J., Goss, W. M., Frail, D. A., & Desai, K. 1999, ApJ, 522, 349
- Cragg et al. (2002) Cragg, D.M., Sobolev, A.M., & Godfrey, P.D., 2002, MNRAS, 331, 521
- Cragg et al. (1992) Cragg, D. M., Johns, K. P., Godfrey, P. D., & Brown, R. D., 1992, MNRAS, 259, 203
- Cristofari et al. (2013) Cristofari, P., Gabici, S., Casanova, S., Terrier, R., & Parizot, E., 2013, MNRAS, 434, 2748
- Drury et al. (1994) Drury, L. O’C., Aharonian, F. A., & Völk, H. J., 1994, å, 287, 959
- Elitzur & Asensio Ramos (2006) Elitzur, M., & Asensio Ramos, A., 2006, MNRAS, 365, 779
- Elitzur (1976) Elitzur, M., 1976, ApJ, 203, 124
- Fish et al. (2011) Fish, V.L., Muehlbrad, T.C., Pratap, P., et al., 2011, ApJ, 729, 14
- Frail & Mitchell (1998) Frail, D.A., & Mitchell, G.F., 1998, ApJ, 508, 690
- Frail et al. (1994) Frail, D. A., Goss, W. M., & Slysh, V. I. 1994, ApJ, 424, L111
- Frail (2011) Frail, D. A. 2011, Mem. Soc. Astron. Italiana, 82, 703
- Giuliani et al. (2010) Giuliani, A., Tavani, M., Bulgarelli, A., et al. 2010, A&A, 516, L11
- Gray (1994) Gray, A.D., 1994, MNRAS, 270, 847
- Green et al. (1997) Green, A. J., Frail, D. A., Goss, W. M., & Otrupcek, R., 1997, AJ, 114, 2058
- Green (2009) Green D. A., 2009, Bulletin of the Astronomical Society of India, 37, 45
- Hewitt et al. (2008) Hewitt, J. W., Yusef-Zadeh, F., & Wardle, M., 2008, ApJ, 683, 189
- Hewitt et al. (2009) Hewitt, J W., Yusef-Zadeh, F., & Wardle, M., 2009, ApJ, 706, L270
- Hoffman et al. (2005) Hoffman, I. M., Goss, W. M., Brogan, C. L., & Claussen, M. J. 2005, ApJ, 620, 257
- Jiang et al. (2010) Jiang, B., Chen, Y., Wang, J., et al. 2010, ApJ, 712, 1147
- Kalenskii et al. (2010) Kalenskii, S.V., Johansson, L.E.B., Bergman, P., et al., 2010, MNRAS, 405, 613
- Karlsson et al. (2003) Karlsson, R., Sjouwerman, L. O., Sandqvist, Aa., & Whiteoak, J. B., 2003, A&A, 403, 1011
- Kelner et al. (2006) Kelner, S.R., Aharonian, F.A., & Bugayov, V.V., 2006, PhRvD, 74, 4018
- Koralesky et al. (1998) Koralesky, B., Frail, D. A., Goss, W. M., Claussen, M. J., & Green, A. J., 1998, AJ, 116, 1323
- Larionov & Val’tts (2007) Larionov, G.M., & Val’tts, I.E., 2007, ARep, 51, 756
- Lazendic et al. (2010) Lazendic, J. S., Wardle, M., Whiteoak, J. B., Burton, M. G., & Green, A. J., 2010, MNRAS, 409, 371
- Leurini et al. (2007) Leurini, S., Schilke, P., Wyrowski, F., & Menten, K.M., 2007, A&A, 466, 215
- Liszt (1992) Liszt, H., 1992, ApJSS, 82, 495
- Litovchenko et al. (2012) Litovchenko, I.D., Bayandina, O.S., Alakoz, A.V., et al., 2012, ARep, 56, 536
- Lockett et al. (1999) Lockett, P., Gauthier, E., & Elitzur, M., 1999, ApJ, 511, 235
- Morimoto et al. (1985) Morimoto, M., Kanzawa, T., & Ohishi, M., 1985, ApJ, 288, L11
- Nicholas et al. (2012) Nicholas, B. P., Rowell, G., Burton, M. G., et al. 2012, MNRAS, 419, 251
- Nicholas et al. (2011) Nicholas, B., Rowell, G., Burton, M. G., et al. 2011, MNRAS, 411, 1367
- Oka et al. (1998) Oka, T., Hasegawa, T., Sato, F., Tsuboi, M., & Miyasaki, A., 1998, ApJSS, 118, 455
- Pierce-Price et al. (2000) Pierce-Price, D., et al., 2000, ApJL, 545, L121
- Pihlström et al. (2011) Pihlström, Y. M., Sjouwerman, L. O., & Fish, V. L., 2011, ApJ, 739, L21
- Pratap et al. (2008) Pratap, P., Shute, P. A., Keane, T. C., Battersby, C., & Sterling, S., 2008, AJ, 135, 1718
- Reach et al. (2005) Reach, W.T., Rho, J., & Jarrett, T.H., 2005, ApJ, 618, 297
- Riquelme et al. (2010) Riquelme, D., Bronfman, L., Mauersberger, R., May, J., & Wilson, T.L., 2010, A&A, 523, A45
- Sjouwerman et al. (2010) Sjouwerman, L. O., Pihlström, Y. M., & Fish, V. L., 2010, ApJ, 710, L111
- van der Tak et al. (2007) van der Tak, F. F. S., Black, J. H., Schöier, F. L., Jansen, D. J., & van Dishoeck, E. F., 2007, A&A, 468, 627
- Tsuboi et al. (1999) Tsuboi, M., Handa, T., & Ukita, N., 1999, ApJSS, 120, 1
- Wardle & Yusef-Zadeh (2002) Wardle, M. & Yusef-Zadeh, F., 2002, Science, 296, 2350
- Wardle (1999) Wardle, M., 1999, ApJ, 525, L101
- Whittet et al. (2011) Whittet, D.C.B., Cook, A.M., Herbst, E., Chiar, J.E., & Shenoy, S.S., 2011, ApJ, 742, 28
- Yusef-Zadeh et al. (1999) Yusef-Zadeh, F., Goss, W.M., Roberts, D.A., Robinson, B., & Frail, D.A., 1999, ApJ, 527, 172
- Yusef-Zadeh et al. (2008) Yusef-Zadeh, F., Braatz, J., Wardle, M., & Roberts, D., 2008, ApJ, 683, L147
- Yusef-Zadeh et al. (2013) Yusef-Zadeh, F., Cotton, W., Viti, S., Wardle, M., & Royster, M., 2013, ApJL, 764, L19