Evolution of ferroelectricity in tetrathiafulvalene-p-chloranil as a function of pressure and temperature
Abstract
The neutral-to-ionic phase transition in the mixed-stack charge-transfer complex tetrathiafulvalene-p-chloranil (TTF-CA) has been studied by pressure-dependent infrared spectroscopy up to kbar and down to low temperatures, K. By tracking the C=O antisymmetric stretching mode of CA molecules, we accurately determine the ionicity of TTF-CA in the pressure-temperature phase diagram. At any point the TTF-CA crystal bears only a single ionicity; there is no coexistence region or an exotic high-pressure phase. Our findings shed new light on the role of electron-phonon interaction in the neutral-ionic transition.
pacs:
77.80.B-, 71.30.+h, 63.20.kdI Introduction
While many of the exotic ground states investigated in condensed matter physics are only of academic interest, ferroelectricity has already realized widespread applications for a century.Nicola A. Spaldin and Ramesh (2010); Nan et al. (2008) Organic charge-transfer salts have an enormous potential in the field of ferroelectricity and even multiferroicity;Brazovskii (2008); Horiuchi and Tokura (2008); Lunkenheimer et al. (2012); Dressel et al. (2012) and for many decades TTF-CA is considered the prime candidate.Torrance et al. (1981a) The mixed-stack compound is composed of the electron donor tetrathiafulvalene (TTF) and the acceptor chloranil (CA), which makes the physical properties rather one dimensional.Le Cointe et al. (1995) The charge transfer between TTF(+ρ) and CA(-ρ) is strongly temperature-dependent and commonly described as ionicity . At ambient conditions the material is a paraelectric insulator with a room-temperature ;Lemée-Cailleau et al. (1997) this phase is called quasi-neutral. Upon cooling down, the ionicity gradually increases to until the first-order transition takes place at K characterized by a jump to where TTF-CA enters the quasi-ionic phase. The neutral-ionic transition (NIT) is accompanied by a Peiers-like dimerization of the stacks leading to permanent dipoles and thus a ferroelectric state.Okamoto et al. (1991); Le Cointe et al. (1995); Lemée-Cailleau et al. (1997); Kishida et al. (2009); Masino et al. (2006); Girlando et al. (2008) The ground state continues to be a subject of intense research because of many outstanding questions and not yet completely understood properties such as light-induced metastable states,Nagahori et al. (2013) negative differential resistance,Tokura et al. (1988) anomalous dielectric response due to electronic ferroelectricity,Okamoto et al. (1991); Kobayashi et al. (2012) a possibly multiferroic character of the ionic phase,Giovannetti et al. (2009) or an exotic high-pressure quasi-ionic state.Masino et al. (2007)
Ground states of many organic conductor are found to be highly sensitive to hydrostatic pressure, and TTF-CA is no exception.T. et al. (1998) The NIT in TTF-CA can be driven either by pressure (-transition)Torrance et al. (1981b); Takaoka et al. (1987); Moreac et al. (1996) or temperature (-transition).Torrance et al. (1981a) The pressure-driven transition at room temperature has attracted enormous interest since its discovery almost three decades ago.Tokura et al. (1986); Mitani et al. (1987) In contrast to the -transition, the -transition does not exhibit a jump in ionicity but a gradual increase of which crosses 0.5 at about kbar.Matsuzaki et al. (2005) This leads to the open question of the role of the electron-phonon interaction in the realization of the ionic state.
Optical spectroscopy is a powerful experimental method to determine the charge of molecules and molecular materials.Dressel and Drichko (2004); Drichko et al. (2009); Girlando (2011); Sedlmeier et al. (2012) Certain intra-molecular vibrations have a strong and in first approximation linear dependence of their resonance frequencies on the molecular charge. If these charge-sensitive vibrations are isolated in frequency, the molecular charge can be easily and accurately estimated from infrared as well as Raman spectroscopy. The findings coincide very well with theoretical calculations and alternative methods such as NMR and x-ray scattering. In case the modes of interest are not well-isolated in frequency or even overlap, the pressure and temperature dependences may help to distinguish the charge-sensitive vibrations from other features. In TTF-CA the most interesting vibration is the stretching mode of the CA molecule which mainly involves the C=O bond.Girlando et al. (1983) Its frequency strongly depends on the charge and follows the relation
| (1) |
Temperature-dependent experiments at ambient pressure clearly show a jump in the resonance frequency at . On the other hand, pressure-dependent measurement at room temperature reveal only a gradual evolution of the resonance frequency and suggest a different high-pressure phase. There is an ongoing discussion whether already at kbar the system enters a state in which two sorts of CA-molecules with different ionicities are presentMasino et al. (2004, 2007) or whether a pressure of 16.5 kbar and more is necessary to induce the coexistence of quasi-ionic and quasi-neutral phases.Matsuzaki et al. (2005)
Previous optical experiments of TTF-CA under pressure could give only an incomplete picture since they were strongly limited in temperature,Takaoka et al. (1987) hence we investigated the neutral-ionic transition in a wide temperature range down to K and up to a pressure of 11 kbar. The ionicity of TTF-CA was extracted from the stretching vibration of CA for all measured pressures and temperatures. This gives some insight concerning the coexistence of different ionicities at high pressures and temperatures.
II Experimental
Optical reflectivity measurements of TTF-CA samples were performed in the mid-infrared frequency range from 500 to 8000 cm-1 utilizing a Fourier-transform infrared spectrometer of the type Bruker IFS 66v/S equipped with a CryoVac He-flow cryostat which could reach temperature as low as 10 K. In order to investigate the optical properties under hydrostatic pressure, we employed a piston cylinder cell CC33 of the Institute of High-Pressure Physics, Russian Academy of Sciences, and Daphne 7373 as pressure medium. The sample was directly mounted onto the type IIa diamond window; hence, we probe the reflectivity off the diamond-sample interface. In the frequency range between 1800 and 2700 cm-1 the strong multi-phonon absorption in diamond prevents reliable measurements. Pressure of up to 11 kbar was applied at room temperature and the cell closed. When the copper beryllium cell is cooled down, the actual pressure is significantly reduced due to thermal contraction. Hence we thoroughly determined the temperature-dependent pressure loss beforehand, using ruby fluorescence spectroscopy. With this pressure calibration, the real low-temperature pressure is known within an error of kbar.Beyer et al. (2014) The pressure cell with the mounted sample was not opened until the measurements were completed at all desired temperatures and pressure values.
Fresh TTF-CA single crystals were grown by plate sublimation method.Demianets et al. (1980) The obtained specimens, however, were too thin for optical measurement and partially transparent in the mid-infrared frequency range. Therefore, the measurements were performed on 1 mg of powdered TTF-CA crystals that were finely ground and firmly pressed. Obviously, we do not gain information on the optical anisotropy and also the absolute conductivity values are not particularly meaningful. With this in mind we analyzed the measured reflectivity spectra directly by a fit to a sum of Lorentz terms Dressel and Grüner (2002) with additional Fano contributions in order to better describe coupled vibrational features.Fano (1961); Damascelli et al. (1997); Sedlmeier et al. (2012) Here the contribution of a single vibrational model to the real and imaginary part of optical conductivity reads
| (2a) | |||||
| (2b) | |||||
where is the resonance frequency, the phenomenological coupling parameter, and the amplitude of the Fano contribution. The linewidth relates to the damping constant as .
III Results
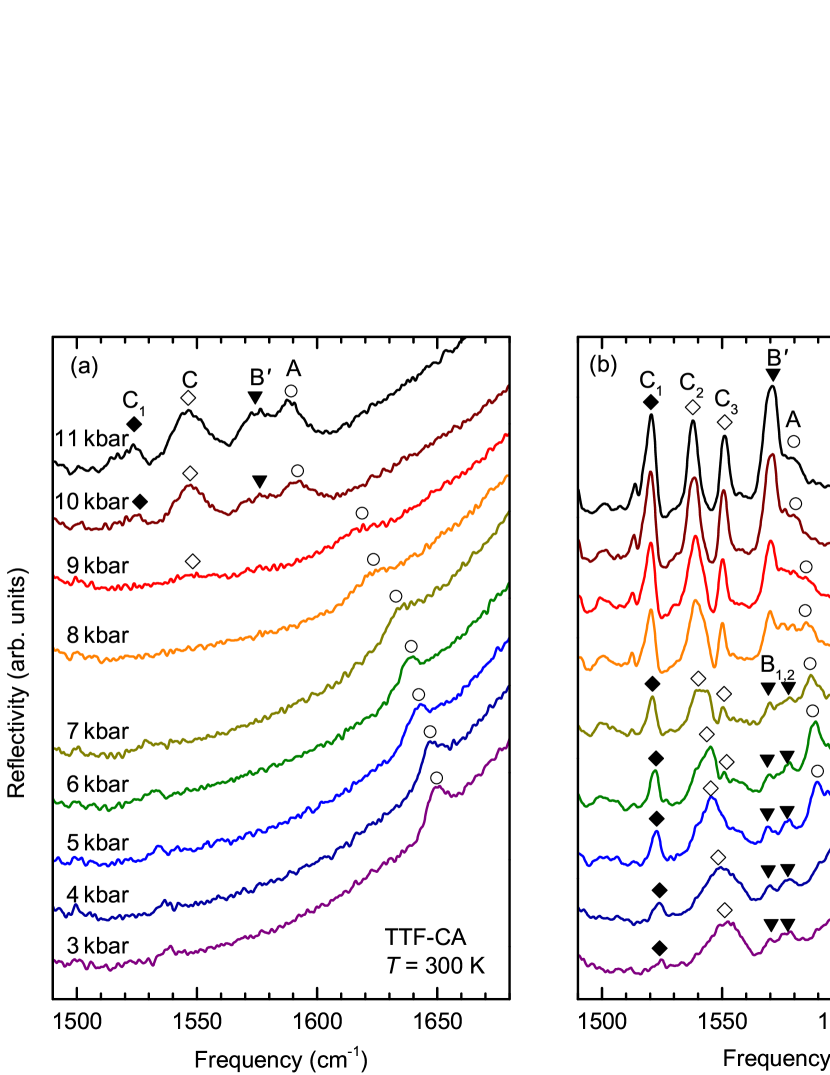
In Fig. 1(a) the room temperature reflectivity spectra of powdered TTF-CA crystals are plotted for the spectral range around the mode. The increase of the reflectivity with frequency is an artifact caused by the multi-phonon absorption of the diamond window that becomes dominant above 1700 cm-1; here we focus on the vibrational features seen as small but distinct bands on top of it. At ambient condition and low pressure values, we identify a single band around 1650 cm-1 that is assigned to the mode of the C=O stretching vibration (labeled as A band). With increasing pressure this band shifts to lower frequencies, and broadens slightly. Above 9 kbar additional features appear: the B′ band at 1575 cm-1 together with two C bands at lower frequencies. As discussed in more details below, these bands are due to symmetric vibrations that become infrared-active by the interaction with electrons, the so-called electron-molecular vibration (emv) coupling.Dressel and Drichko (2004) At the pressure-induced neutral-ionic transition kbar the charge transfer increases and dimerization of the TTF-CA stacks is modified; hence the emv-coupled modes become pronounced.Girlando et al. (1983) Our findings agree well with previous pressure-dependent measurements at room temperature.
The temperature dependence of the reflectivity is displayed by Figs. 1(c) and (d) for low and high pressure, respectively. Note that the indicated pressure values correspond to the pressure applied at K; it decreases with cooling. In Fig. 1(c) it is seen that starting with kbar at room temperature, the mode (A band) shifts only weakly with cooling. The NIT is evident by a jump to lower frequencies at K. Additional B′ and C bands appear in the quasi-ionic phase as observed for the -driven transition [Fig. 1(a)].
Fig. 1(b) displays the pressure dependence of the bands of interest at K, the lowest temperature measured. The pressure values shown are corrected for the pressure loss. Since the A band is always observed below 1605 cm-1, which corresponds to the threshold ionicity of 0.5, the system remains in the quasi-ionic state for any pressure. Accordingly, the emv-coupled B′ and C bands can be identified at low temperatures for any pressure applied. The B′ further becomes resolved into two vibrations labeled B1 and B2 at lower pressures. On the other hand, the C3 band seems to merge with the C2 at low pressure. Similarly, the two modes cannot be distinguished in the room temperature spectra even at high pressure, as seen in Fig. 1(d).
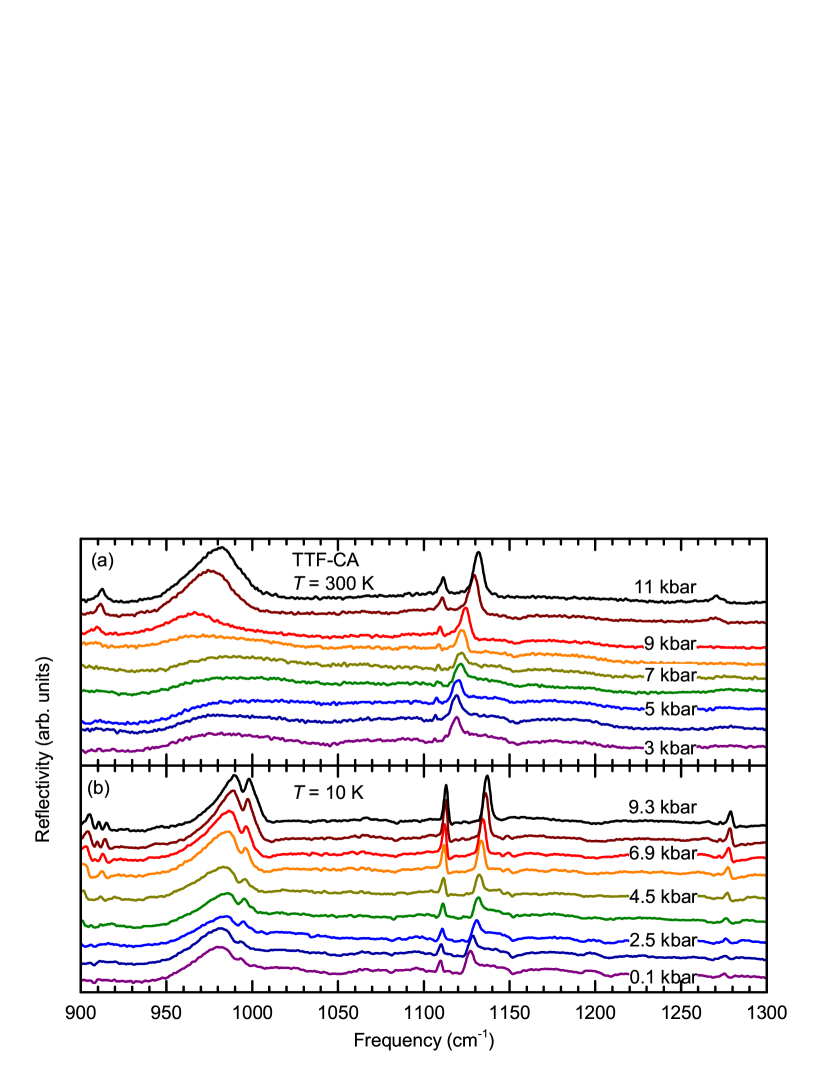
In Fig. 2 the vibrational bands of TTF-CA found at lower frequencies are displayed for different pressure values; the spectra are taken at and 10 K, as indicated. The two asymmetric modes around 1110 cm-1 and 1125 cm-1 are assigned to the vibration of TTF and the mode of CA, respectively. The assignment of the symmetric bands at 910 cm-1, 980 cm-1 and 1275 cm-1 is not that clear. The broad band at 980 cm-1 is most likely due to the vibration of CA,Girlando et al. (1983) but the origin of the peaks at high pressures and low temperatures [top curve of Fig. 2(b)] remains unresolved. All four vibrations are emv-coupled. Somewhat unexpectedly, they all sharpen significantly under pressure at all temperatures.
IV Discussion
In Fig. 1 we have noticed that at high pressure values and at low temperatures a new set of modes appear, labeled as B′ and C bands. Since they are not prominent in the neutral phase, it is safe to conclude that these bands are infrared silent modes. The C2 and C3 bands become infrared-active only by emv-coupling and hence are symmetric modes, probably the mode of TTF and the mode of the CA molecule, respectively.Girlando et al. (1983) The C1 mode is the only one which can also be identified in the quasi-neutral phase, and thus we assign to the asymmetric mode of TTF.
The assignment of the B′ band around 1575 cm-1 is not straightforward as it contains two components, one of which was controversially discussed in previous publications.Masino et al. (2007); Matsuzaki et al. (2005) In single-crystal measurements a mode appears at 1570 cm-1 below the transition temperature, for light polarized parallel to the stacking direction. This mode can be unambiguously assigned to the symmetric vibration of CA. While the mode is present only in the ionized state, its resonance frequency does not depend on the ionicity of CA.Girlando et al. (1983) Driving TTF-CA through the -dependent transition at room temperature leads to the rise of an additional feature at 1580 cm-1 above the critical pressure. This band was observed in single-crystal measurements by several groups,Masino et al. (2007); Matsuzaki et al. (2005) but its origin is still under discussion (it is commonly called B band). Masino et al. link it to the of CA; they also assign their A band to the same CA vibration.Masino et al. (2007) Accordingly, they claim the appearance of a second ionicity and thus a new state in which two different sorts of molecules with distinct ionicities coexist. Their assignment is mostly based on the fact that this band is only detected in the ionized state and that previous measurements and calculations do not predict other molecular vibrations in this frequency range.Girlando et al. (1983) On the other hand, Matsuzaki et al. assign the same vibration to an infrared-active mode, as they are able to identify the B band also in the neutral state thanks to measurements of superior sensitivity.Matsuzaki et al. (2005) No matter whether one follows their assignment, it is important to notice that the mode exists in the neutral state and that its frequency does not depend on the ionicity.
At low temperatures and low pressures the two contributions to the B′ band can be resolved and assigned: the lower-frequency B1 band to the vibration and the B2 band to the other vibration discussed above. Applying a careful fitting procedure, we can further resolve the two vibrations for higher pressures at the lowest temperature. Thus we conclude that the high-temperature B′ band consists of two components, one being of CA and the other an infrared-active mode of unclear assignment, both of which are not charge sensitive. It is well-established that at ambient pressure the ionic phase consists of only one sort of TTF-CA molecule with a single well-defined ionicity. From Figs. 1(b) and (d) it is clearly seen that the B′ band does exist at low temperatures for all pressure values measured, and that it changes smoothly through cooling at high pressures; we see no evidence of an extra component. Within our temperature and pressure range the high-pressure phase comprises only one type of CA molecule. Table 1 summarizes the final mode assignment.
| Label | Vibrational mode | Label | Vibrational mode | |
|---|---|---|---|---|
| A | of CA | C1 | of TTF | |
| B1 | of CA | C2 | of TTF | |
| B2 | unclear assignment, see text | C3 | of CA |
According to the above arguments there is no ground left to claim a non-dimerized quasi-ionic phase of TTF-CA that exists at room temperature above 9 kbar. In TTF-CA the emv-coupled modes are activated by the stack dimerization.Girlando et al. (1983) A non-dimerized quasi-ionic state should show fewer, or different, emv-coupled modes compared to the regular state. However, Figs. 1(a) and 2(a) provide strong evidence that the number of emv-coupled vibrations does not change with increasing pressure; the same is true for the high-pressure (11 kbar) spectra with varying temperature, as shown by Fig. 1(d). These results rule out a non-dimerized quasi-ionic phase of TTF-CA above 9 kbar.
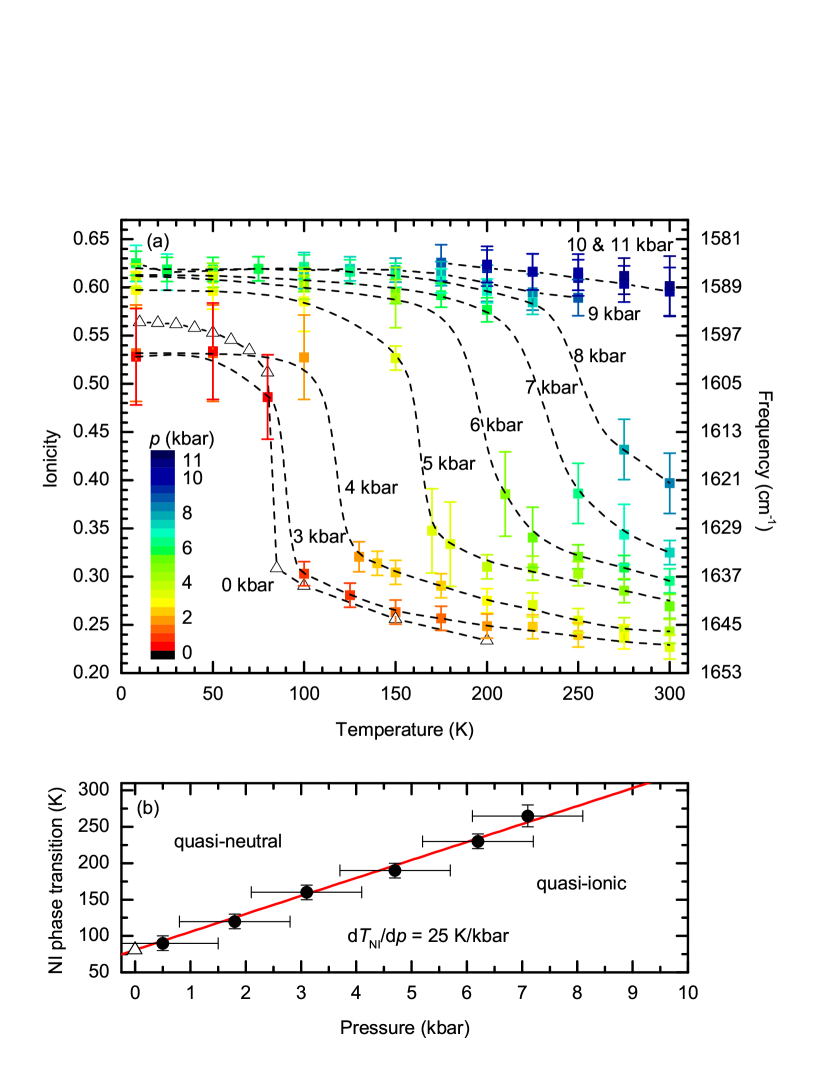
From our experiments we can can safely conclude that TTF-CA crystals have only one ionicity within our temperature and pressure ranges. From the advanced fit of the reflectivity spectra with Fano terms for vibrational features we obtain the resonance frequency of the feature and calculate the ionicity of TTF-CA at all temperatures and pressure values, according to Eq. (1). At low pressures [cf. Fig. 1(b)] and close to the transition temperature [cf. Fig. 1(c), 90 K] the A band is somewhat smeared out, which makes the estimation of the resonance frequency very difficult in these regions. Accordingly, certain points in the phase diagram contain rather large error bars. Fig. 3(a) exhibits the ionicity of TTF-CA as a function of temperature for different pressure runs. The corrected pressure is displayed as the color of individual points. Even with the rough temperature steps chosen in these optical experiments ( K), it can be seen that the transition gets broader with increasing pressure. Surprisingly, in the quasi-neutral state both pressure and temperature have a significant effect on the ionicity, while the ionicity hardly changes anymore once the quasi-ionic phase is stabilized; neither with pressure nor with temperature.
Based on our extensive optical investigations we can construct a revised phase diagram of TTF-CA as a function of pressure and temperature, displayed in Fig. 3(a). As our findings do not give any indications for an exotic phase above 9 kbar, only two different phases are shown in Fig. 3(b). The temperature of the NIT has a linear dependence on pressure with a slope of 25 K/kbar; note that we refer to the actual pressure present at low temperatures. Extrapolation of our data reveal that at room temperature the dimerized-stack, quasi-ionic phase sets in at about kbar. This optical phase diagram is in good agreement with previous pressure-dependent studies.Takaoka et al. (1987); Lemee-Cailleau et al. (1992); Mitani et al. (1987) We do not observe a critical pressure below which the NIT-temperature levels off at K. This contradicts previous dc transport measurements of Mitani et al.,Mitani et al. (1987) who report a pressure-independent transition temperature. This discrepancy at low-temperatures can be explained by the precaution we have taken to carefully include the pressure loss with cooling in the entire temperature range. The pressure loss in piston cylinder cells generally becomes stronger at lower temperatures and is especially important at low pressures: for instance, Fig. 1(b) demonstrates how the pressure in the cell is reduced from 3 kbar at room temperature to only 0.1 kbar at 10 K.
There is another observation we would like to draw the attention to. Usually vibrational modes become sharper upon cooling, as a consequence of thermal broadening. They also are smeared out when pressure is applied because the phonon density of states spreads out with pressure, leading to a larger probability for phonon-phonon scattering and a widening of the vibration lines. In the present case of TTF-CA, however, our pressure- and temperature-dependent measurements reveal a rather unexpected behavior. As shown in Figs. 1(a), (b) and 2, the B1, C1 and C3 bands as well as the lower-frequency bands around 980, 1110, and 1250 cm-1 clearly become more pronounced with pressure. One might argue that the phonon-phonon interaction does not increase with pressure, thus allowing the modes to narrow even though the phonon density of states becomes wider. However, the mode narrowing is also seen at temperatures as low as 10 K where we do not expect the phonon-phonon scattering to play any significant role.
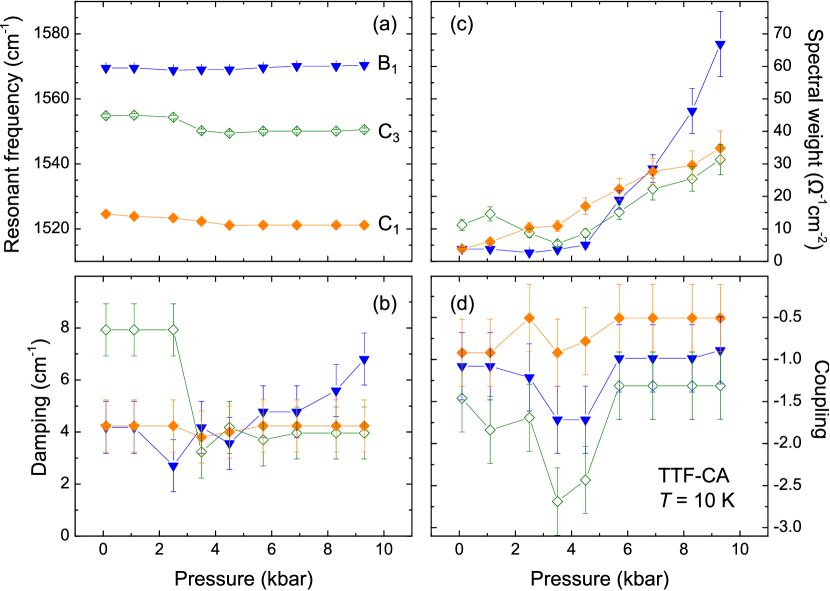
For a more quantitative analysis of these pressure-dependent modes we apply a Fano fit according to Eq. (2). It is instructive to represent the mode strength of each Fano contribution by spectral weight (the absolute value has to be taken because the Fano contribution to conductivity can also be negative in sign). Fig. 4 displays the low-temperature parameters of the B1, C1 and C3 bands as a function of pressure. For clarity’s sake we leave out the low-frequency vibrational bands which become stronger with pressure in a similar manner, as well as the A and C2 bands which do not show a clear trend with pressure. It is apparent that for the modes shown in Fig. 4 the spectral weight increases with pressure, especially above 4 kbar. This further corresponds with a dip in the coupling constant and a change of damping in C3 around 4 kbar, the origin of which is as of yet not understood. The vibrations in question include some emv-coupled as well as infrared-active modes. As pressure is applied, the modes become more pronounced because the ionicity is not independent on pressure. As demonstrated by Fig. 3(a), the low-temperature ionicity gradually increases with pressure. Certain molecular vibrations depend on ionicity, and the coupling can change not only their resonant frequencies but also other parameters, including strength. In the ionic phase of TTF-CA the latter is particularly noticable for some CA modes [the B1 band, ; the C3 band, ; the around 1125 cm-1; the 980 cm-1 band which is most likely the of CA] and TTF modes [the C1 band, ; the around 1110 cm-1].
V Conclusion
We have performed comprehensive reflectivity measurements on TTF-CA under hydrostatic pressure up to 11 kbar in the temperature range from 300 K down to 10 K. By evaluating the charge-sensitive vibrational mode of the CA molecule, we determined the ionicity of the system as a function of both temperature and pressure; hence we could compose a revised phase diagram of TTF-CA which connects the temperature-driven neutral-ionic transition with a critical temperature of K and the pressure-driven transition with a critical pressure of kbar. By carefully comparing the pressure-dependent spectra at high and low temperatures with the temperature-dependent spectra at high and low pressures, we can exclude an exotic high-pressure phase in the measured region. In contrast to previous suggestions,Masino et al. (2004, 2007) the phase diagram constructed from our optical measurements contains only two phases: the quasi-neutral and one quasi-ionic phase. The neutral-to-ionic transition temperature increases linearly with pressure by 25 K/kbar. We additionally point out the atypical pressure dependence of the vibrational mode strength in the quasi-ionic phase, most likely due to the coupling to ionicity.
Acknowledgements.
We wish to thank A. Girlando and M. Masino for enlightening discussions. This work was supported by the Deutsche Forschungsgemeinschaft (DFG). T.P. acknowledges the support of Carl Zeiss Stiftung.References
- Nicola A. Spaldin and Ramesh (2010) S.-W. C. Nicola A. Spaldin and R. Ramesh, Phys. Today 63, 38 (2010), URL http://scitation.aip.org/content/aip/magazine/physicstoday/article/63/10/10.1063/1.3502547.
- Nan et al. (2008) C.-W. Nan, M. I. Bichurin, S. Dong, D. Viehland, and G. Srinivasan, J. App. Phys. 103, 031101 (2008), URL http://scitation.aip.org/content/aip/journal/jap/103/3/10.1063/1.2836410.
- Brazovskii (2008) S. A. Brazovskii, The Physics of Organic Superconductors and Conductors (Springer Verlag, Berlin, 2008).
- Horiuchi and Tokura (2008) S. Horiuchi and Y. Tokura, Nat. Mater. 7, 357 (2008), ISSN 1476-1122, URL http://dx.doi.org/10.1038/nmat2137.
- Lunkenheimer et al. (2012) P. Lunkenheimer, J. Müller, S. Krohns, F. Schrettle, A. Loidl, B. Hartmann, R. Rommel, M. de Souza, C. Hotta, J. A. Schlueter, and M. Lang, Nat. Mater. 11, 755 (2012), URL http://www.nature.com/nmat/journal/v11/n9/full/nmat3400.html.
- Dressel et al. (2012) M. Dressel, M. Dumm, T. Knoblauch, B. Köhler, B. Salameh, and S. Yasin, Advances in Condensed Matter Physics 2012, 398721 (2012), URL http://dx.doi.org/10.1155/2012/398721.
- Torrance et al. (1981a) J. B. Torrance, A. Girlando, J. J. Mayerle, J. I. Crowley, V. Y. Lee, P. Batail, and S. J. LaPlaca, Phys. Rev. Lett. 47, 1747 (1981a), URL http://link.aps.org/doi/10.1103/PhysRevLett.47.1747.
- Okamoto et al. (1991) H. Okamoto, T. Mitani, Y. Tokura, S. Koshihara, T. Komatsu, Y. Iwasa, T. Koda, and G. Saito, Phys. Rev. B 43, 8224 (1991), URL http://link.aps.org/doi/10.1103/PhysRevB.43.8224.
- Le Cointe et al. (1995) M. Le Cointe, M. H. Lemée-Cailleau, H. Cailleau, B. Toudic, L. Toupet, G. Heger, F. Moussa, P. Schweiss, K. H. Kraft, and N. Karl, Phys. Rev. B 51, 3374 (1995), URL http://link.aps.org/doi/10.1103/PhysRevB.51.3374.
- Lemée-Cailleau et al. (1997) M. H. Lemée-Cailleau, M. Le Cointe, H. Cailleau, T. Luty, F. Moussa, J. Roos, D. Brinkmann, B. Toudic, C. Ayache, and N. Karl, Phys. Rev. Lett. 79, 1690 (1997), URL http://link.aps.org/doi/10.1103/PhysRevLett.79.1690.
- Kishida et al. (2009) H. Kishida, H. Takamatsu, K. Fujinuma, and H. Okamoto, Phys. Rev. B 80, 205201 (2009), URL http://link.aps.org/doi/10.1103/PhysRevB.80.205201.
- Masino et al. (2006) M. Masino, A. Girlando, A. Brillante, R. D. Valle, E. Venuti, N. Drichko, and M. Dressel, Chem. Phys. 325, 71 (2006), ISSN 0301-0104, URL http://www.sciencedirect.com/science/article/pii/S0301010405004428.
- Girlando et al. (2008) A. Girlando, M. Masino, A. Painelli, N. Drichko, M. Dressel, A. Brillante, R. G. Della Valle, and E. Venuti, Phys. Rev. B 78, 045103 (2008), URL http://link.aps.org/doi/10.1103/PhysRevB.78.045103.
- Nagahori et al. (2013) A. Nagahori, N. Kubota, and C. Itoh, Eur. Phys. J. B 86, 1 (2013), ISSN 1434-6028, URL http://dx.doi.org/10.1140/epjb/e2013-30616-4.
- Tokura et al. (1988) Y. Tokura, H. Okamoto, T. Koda, T. Mitani, and G. Saito, Phys. Rev. B 38, 2215 (1988), URL http://link.aps.org/doi/10.1103/PhysRevB.38.2215.
- Kobayashi et al. (2012) K. Kobayashi, S. Horiuchi, R. Kumai, F. Kagawa, Y. Murakami, and Y. Tokura, Phys. Rev. Lett. 108, 237601 (2012), URL http://link.aps.org/doi/10.1103/PhysRevLett.108.237601.
- Giovannetti et al. (2009) G. Giovannetti, S. Kumar, A. Stroppa, J. van den Brink, and S. Picozzi, Phys. Rev. Lett. 103, 266401 (2009), URL http://link.aps.org/doi/10.1103/PhysRevLett.103.266401.
- Masino et al. (2007) M. Masino, A. Girlando, and A. Brillante, Phys. Rev. B 76, 064114 (2007), URL http://link.aps.org/doi/10.1103/PhysRevB.76.064114.
- T. et al. (1998) T. Ishiguro, K. Yamaji, and G. Saito, Organic Superconductors (Springer Verlag, Berlin, Heidelberg, New York, 1998).
- Torrance et al. (1981b) J. B. Torrance, J. E. Vazquez, J. J. Mayerle, and V. Y. Lee, Phys. Rev. Lett. 46, 253 (1981b), URL http://link.aps.org/doi/10.1103/PhysRevLett.46.253.
- Takaoka et al. (1987) K. Takaoka, Y. Kaneko, H. Okamoto, Y. Tokura, T. Koda, T. Mitani, and G. Saito, Phys. Rev. B 36, 3884 (1987), URL http://link.aps.org/doi/10.1103/PhysRevB.36.3884.
- Moreac et al. (1996) A. Moreac, A. Girard, and Y. Delugeard, J. Phys.: Condens. Matter 8, 3569 (1996), URL http://stacks.iop.org/0953-8984/8/i=20/a=005.
- Tokura et al. (1986) Y. Tokura, H. Okamoto, T. Koda, and T. Mitani, Solid State Commun. 57, 607 (1986), ISSN 0038-1098, URL http://www.sciencedirect.com/science/article/pii/0038109886903327.
- Mitani et al. (1987) T. Mitani, Y. Kaneko, S. Tanuma, Y. Tokura, T. Koda, and G. Saito, Phys. Rev. B 35, 427 (1987), URL http://link.aps.org/doi/10.1103/PhysRevB.35.427.
- Matsuzaki et al. (2005) H. Matsuzaki, H. Takamatsu, H. Kishida, and H. Okamoto, J. Phys. Soc. Jpn. 74, 2925 (2005), URL http://jpsj.ipap.jp/link?JPSJ/74/2925/.
- Dressel and Drichko (2004) M. Dressel and N. Drichko, Chem. Rev. 104, 5689 (2004), URL http://pubs.acs.org/doi/abs/10.1021/cr030642f.
- Drichko et al. (2009) N. Drichko, S. Kaiser, Y. Sun, C. Clauss, M. Dressel, H. Mori, J. Schlueter, E. I. Zhyliaeva, S. A. Torunova, and R. N. Lyubovskaya, Physica B 404, 490 (2009), ISSN 0921-4526, URL http://www.sciencedirect.com/science/article/pii/S0921452608005681.
- Girlando (2011) A. Girlando, J. Phys. Chem. C 115, 19371 (2011), eprint http://pubs.acs.org/doi/pdf/10.1021/jp206171r, URL http://pubs.acs.org/doi/abs/10.1021/jp206171r.
- Sedlmeier et al. (2012) K. Sedlmeier, S. Elsässer, D. Neubauer, R. Beyer, D. Wu, T. Ivek, S. Tomić, J. A. Schlueter, and M. Dressel, Phys. Rev. B 86, 245103 (2012), URL http://link.aps.org/doi/10.1103/PhysRevB.86.245103.
- Girlando et al. (1983) A. Girlando, F. Marzola, C. Pecile, and J. B. Torrance, J. Chem. Phys. 79, 1075 (1983), URL http://link.aip.org/link/?JCP/79/1075/1.
- Masino et al. (2004) M. Masino, A. Girlando, A. Brillante, R. D. Valle, and E. Venuti, Mater. Sci.-Poland 22 (2004), URL http://materialsscience.pwr.wroc.pl/index.php?id=5&vol=vol22no4.
- Beyer et al. (2014) R. Beyer, N. Barišić, and M. Dressel, to be published (2014).
- Demianets et al. (1980) L. N. Demianets, G. A. Emelchenko, J. Hesse, N. Karl, A. N. Lobachev, and H. Maier, Organic Crystals, Germanates, Semiconductors (Springer, Berlin Heidelberg, 1980), URL http://link.springer.com/book/10.1007%2F978-3-642-67764-9.
- Dressel and Grüner (2002) M. Dressel and G. Grüner, Electrodynamics of Solids: Optical Properties of Electrons in Matter (Cambridge University Press, Cambridge, 2002).
- Fano (1961) U. Fano, Phys. Rev. 124, 1866 (1961), URL http://link.aps.org/doi/10.1103/PhysRev.124.1866.
- Damascelli et al. (1997) A. Damascelli, K. Schulte, D. van der Marel, and A. A. Menovsky, Phys. Rev. B 55, R4863 (1997), URL http://link.aps.org/doi/10.1103/PhysRevB.55.R4863.
- Lemee-Cailleau et al. (1992) M. H. Lemee-Cailleau, B. Toudic, H. Cailleau, F. Moussa, M. L. Cointe, G. Silly, and N. Karl, Ferroelectrics 127, 19 (1992), URL http://dx.doi.org/10.1080/00150199208223340.