11email: johan.vanderwalt@nwu.ac.za
Pumping of the 4.8 GHz HCO masers and its implications for the periodic masers in G37.55+0.20
Abstract
Context. Periodic or regular flaring of class II masers in nine high mass star forming regions is now a well established phenomenon. Amongst the nine star forming regions, G37.55+0.20 is the only case at present where apart from the presence of a periodic class II maser, correlated flaring of another masing species, in this case, has been detected.
Aims. We perform numerical calculations to investigate under which conditions the transition (4.8 GHz) of ortho- is inverted in order to address the question of the correlated flaring of the 6.7 GHz and 4.8 GHz masers in G37.55+0.20
Methods. We developed a numerical code to study the population inversion of o-. Equilibrium solutions for the level populations are found by integrating the rate equations using Heun’s method.
Results. It is found that collisional excitation with as well as radiative excitation by the free-free radio continuum radiation from a nearby ultra- or hyper-compact H II region can invert the transition. It is also found that radiative excitation by the dust infrared radiation field does not lead to an inversion of the transition. The (14.5 GHz) and (28.9 GHz) transitions are inverted only in the presence of the free-free continuum radiation field of a very compact H II region.
Conclusions. Due to the different pumping mechanisms of the and masers it is unlikely that the near simultaneous flaring of the and masers in G37.55+0.20 is due to changes in the pumping of the masers.
Key Words.:
masers – Stars: formation – ISM: molecules – Radio lines: ISM1 Introduction
The phenomenon of periodic or regular flaring of class II masers associated with a small number of high mass star forming regions is now well established and is considered as one of the most peculiar phenomena in maser science (Menten 2012). Periodic or regular flaring behaviour of 6.7, 12.2, and 107 GHz masers have been reported and discussed by Goedhart et al. (2003, 2007, 2009), van der Walt et al. (2009), Araya et al. (2010) and Szymczak et al. (2011). Currently nine confirmed periodic maser sources are known.
Since the original discovery of periodic flaring of the 6.7 GHz masers in G9.62+0.20E by Goedhart et al. (2003), numerous suggestions/hypotheses have been proposed about the underlying mechanisms responsible for the periodic behaviour of the masers. The underlying mechanisms can be divided into two groups, ie. radiative mechanisms that affect the pumping of the masers and, background source effects which affect the flux of seed photons amplified by the maser.
Amongst the nine known periodic maser sources, G37.55+0.20 (IRAS 18566+0408) is at present the only where another masing species, in this case, shows flaring behaviour which occurs almost coincident in time with the maser flares (Araya et al. 2010). Based on the fact that both species flare and that is radiatively pumped (Sobolev & Deguchi 1994; Sobolev et al. 1997), Araya et al. (2010) concluded that the maser in G37.55+0.20 must also be radiatively pumped. These authors therefore proposed an underlying mechanism which raises the dust temperature and which in turn affects the infrared pumping radiation field, resulting in an increase in the amplification of the masers.
Level population calculations for have been done in the past by eg. Thaddeus (1972), Boland & de Jong (1981), and Baan et al. (1986). Boland & de Jong (1981) presented a model in which the masers in NGC 7538-IRS1 are radiatively pumped by the free-free radio continuum radiation of a nearby compact H II region. A number of authors eg. Mehringer et al. (1994) and Hoffman et al. (2003), however, argued that the Galactic 4.8 GHz maser emission is due to collisional rather than radiative excitation from dust emission. On the other hand, numerical calculations strongly suggest that the class II masers are pumped by infrared radiation (Sobolev & Deguchi 1994; Sobolev et al. 1997) which obviously raises the question of the underlying mechanism that apparently drives both the and maser flares in G37.55+0.20.
Thus, although the pumping of the Galactic 4.8 GHz masers is an interesting problem as such, the near simultaneous flaring of the 6.7 GHz and 4.8 GHz masers in G37.55+0.20 puts the question of the pumping of the masers in a new context. In fact, careful comparison of the 6.7 GHz and 4.8 GHz flare profiles as presented by Araya et al. (2010) reveals a remarkable similarity between the two. This also again raises the question of the pumping of the 4.8 GHz masers and what the implication thereof is for identifying the underlying mechanism responsible for the and maser flares in G37.55+0.20 especially when considering that the two types of masers are 2000 AU apart (Araya et al. 2010). The aim of this paper is to present the results of an investigation into the pumping of the 4.8 GHz masers and to use the results as a step to understand the underlying mechanism for the flaring of the masers in G37.55+0.20 and hopefully also of the other periodic maser sources.
2 Theory and Calculational procedure
Within the framework of the escape probability method the rate equations for the level populations can be written as
| (1) | |||||
where is the number density in level , the statistical weight of level , the Einstein-A coefficient for spontaneous emission between levels and , the dilution factor for an external radiation field and the photon occupation number for this field at frequency . is the collision rate with the number density and the collision rate coefficient. is the escape probability. The rate equations were supplemented with the particle number conservation requirement
| (2) |
with the abundance of the molecule under consideration relative to that of .
We assume that the maser region is embedded in or surrounded by a layer of warm dust at temperature . For the dust radiation field we assume the isotropic optically thin case and therefore that the dust radiation field is given by
| (3) |
with the Planck function and the dust optical depth where we have set and (see eg. Pavlakis & Kylafis 1996; Sobolev et al. 1997; Cragg et al. 2002). is a geometric dilution factor.
The photon occupation number, , enters in the derivation of Eq. 1 through the product of with the mean intensity of the continuum radiation field averaged over the line profile. For dust emission it is given by
| (4) |
while for the radiation field of a nearby H II region it is given by
| (5) |
where is the electron temperature, the optical depth of the H II region at frequency , and the corresponding geometric dilution factor. In the case where the continuum radiation field consists of both that of dust and an H II region the product in Eq. 1 is to be replaced by .
The optical depth between levels and is given by
| (6) |
where and are the fractional number of molecules in levels and respectively, the column density of the masing molecule under consideration with the source dimension that determines the photon escape, and the FWHM of the local velocity field. Following Cragg et al. (2002, 2005) we will refer to the quantity as the specific column density. For the escape probability we used the expression for the large velocity gradient approximation, ie.
| (7) |
The set of rate equations was solved using Heun’s method (Kreyszig 1979) with a time step of one second. Using Heun’s method requires an initial distribution for the level populations which we took as a Boltzmann distribution with a temperature equal to the gas kinetic temperature (henceforth indicated by ). For a given the calculation always started with a small specific column density such that the system is completely optically thin in all radiative transitions. An equilibrium solution for this initial specific column density was then found by letting the system evolve over a long enough time. The specific column density is then increased by a small amount and the equilibrium solution for the previous value of the specific column density is then used as the initial distribution. The process is repeated until the required specific column density is reached. Experimentation with this procedure has shown that starting with the optically thin case and progressively calculating solutions for increasing optical depth is very stable and repeatable.
In applying the above method in more extensive calculations it is not practical to find the equilibrium level populations by letting the system evolve over, eg. seconds. Instead we used a convergence criterium to determine when to stop the calculation. For the present calculations it was required that the maximum value of the relative change in one time step over all levels be less than , ie. for all . From a number of trial runs it was found that when using this convergence criterium, the level populations differ by less than 1% from the equilibrium solutions found when allowing the system to evolve over a sufficiently long time ( seconds).
The Einstein-A and collision rate coefficients of the first 40 levels of o- were taken from the Leiden Atomic and Molecular Database (Schöier et al. 2005). The - collision rate coefficients used are from the recent calculations of Wiesenfeld & Faure (2013).
The calculational procedure was tested by considering the two limiting cases where (a) collisions dominate and, (b) where the radiation field dominates and is an undiluted black body radiation field. In the first case it is expected that in equilibrium the level populations be described by a Boltzmann distribution with temperature equal to the gas kinetic temperature and in the second case by a Boltzmann distribution with temperature equal to that of the black body. In both these cases it was found that the equilibrium level populations calculated with the above method produced the correct temperatures with an accuracy of less than one per cent.
3 Results
There are basically three processes in the physical environment that can play a role in the pumping of the masers, ie. collisional excitation, radiative excitation via the dust continuum emission, and radiative excitation through the free-free continuum emission from an ultra- or hypercompact H II region. We consider each of these separately. The focus will be on the transition but we will also later present results for other possible masing transitions.
3.1 Collisional excitation
In the absence of radiation fields the effect of collisions on the level populations is determined by , , and the relative abundance of , . We do not consider explicitly the dependence on the relative abundance of but implicitly through the specific column density, (Eq. 6). For illustrative purposes we considered gas kinetic temperatures in steps of 40 K between 140 K and 300 K and densities between and .
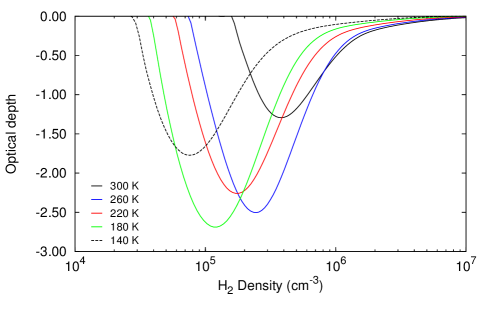
In Fig. 1 we show the optical depth, , of the transition as a function of the specific column density for five values of . The calculation was done for a specific value of for each value of . The choices for the densities will be explained below. It is seen that for the combinations of lower temperatures and densities there is no inversion below specific column densities of about . For the higher temperatures, ie. 260 K and 300 K, an inversion occurs already from the lowest considered specific column densities with the resulting optical depth being very small ( ) for specific column densities less than about . Significant amplification for all five combinations of and occurs only for specific column densities greater than about .

To investigate and illustrate the behaviour of for more general combinations of and in terms of the dependence of on the specific column density would require a large number of graphs such as in Fig. 1 which is unpractical. Instead we will characterize the dependence of on the specific column density for a single combination of and with (max), the maximum negative value of over the considered range of specific column densities. The detailed information of the dependence of on specific column density for a given combination of and is therefore lost. However, (max) is still a usefull quantity to investigate under which conditions a population inversion occurs.
In Figure 2 we therefore show the dependence of (max) on for for the five values of used in Fig. 1. For each temperature the population inversion occurs only above a “threshold” value of which increases with increasing . It is also seen that the density where (max) is a maximum ranges from about at = 140 K to about at 300 K and that (max) is a maximum for 180 K. The respective densities used in Fig. 1 are those where (max) has a maximum for the five values of . It is also interesting to note that the densities where (max) is a maximum are significantly smaller for what is found, for example, for OH masers (Pavlakis & Kylafis 1996).
3.2 Radiative excitation: Dust infra-red radiation
We examined the effect of the dust radiation field for different dust temperatures, and values of and (equation 4) when collisions are absent. It can be stated that no instance could be found where the dust emission on its own results in a population inversion, not for the transition nor between any other levels.
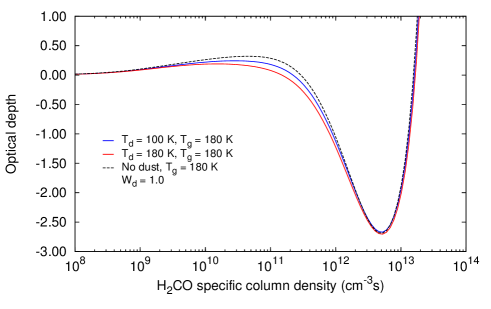
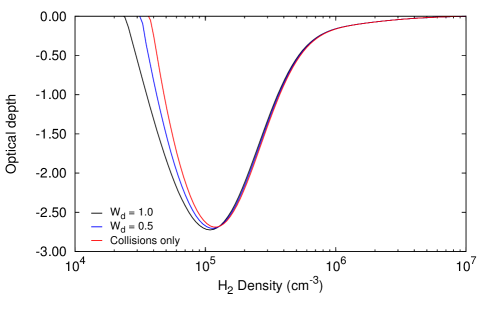
Although the dust radiation field in itself does not lead to a population inversion, it nevertheless affects the level populations and therefore the population inversion of the transition. The effect of the dust radiation field is small as is shown in Fig. 3 where we compare for the case of = 180 K for equal to 100 K and 180 K with pure collisional excitation when = 180 K. In Fig. 4 we show the dependence (max) on for = 180 K, = 100 K and for equal 0.5 and 1.0. The dust infrared radiation field is seen to mostly affect (max) for less than .
3.3 Radiative excitation: Free-free continuum emission
In Fig. 5 we show the dependence of (max) on the emission measure for an H II region with an electron temperature of K and a dilution factor, = 1 and where collisions were ignored. The range in emission measures from to corresponds to turnover frequencies in the radio continuum spectral energy distribution from about 4 GHz to 274 GHz. It is seen that the free-free emission from the H II region can cause a population inversion for the transition. For emission measures greater than about increases very rapidly to a value of 500 and remains constant at that value. The maximum negative optical depth is found at an emission measure of about which translates to a turnover frequency of about 80 GHz.

The effect of including collisional excitation is shown in Fig. 6. The same combinations of and as used in Fig. 2 have been used. The underlying dependence of on the specific column density as seen in Fig. 2 can also be seen in this case. However, comparison with Fig. 2 shows that the free-free emission has a significant effect in that an inversion of the transition now occurs for all five combinations of and already at a specific column density of whereas this is not the case when collisions are the only excitation mechanism. In fact, the effect on is seen to be greatest for the lower temperatures. The maximum negative values which can have are, however, less than in the case of pure collisional excitation. It should also be noted that the specific column densities where has a maximum negative value has shifted to larger values in the presence of the free-free continuum radiation field than without it.

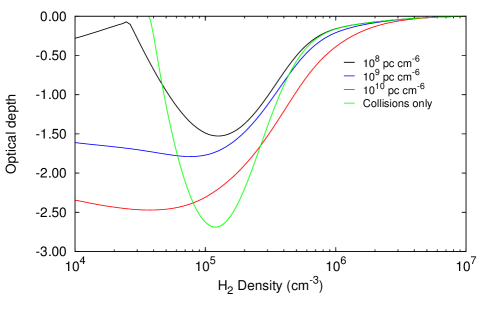
With regard to the influence of the free-free continuum radiation field we lastly compare in Fig. 7 the dependence of (max) on for emission measures of , , and . Also shown is the case for collisional excitation. In all four cases we used = 180 K. The free-free continuum radiation field is seen to significantly affect the optical depth over most of the range of with the effect being greatest toward lower densities where the inversion is exclusively due to that of the free-free continuum radiation.
3.4 Inversion of other transitions
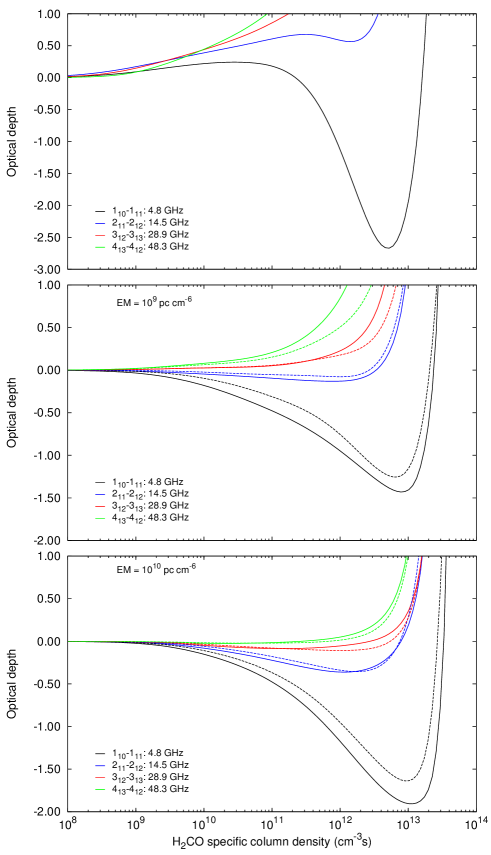
In Fig. 8 we compare the dependence of the optical depth on the specific colum density for a number of transitions in order to investigate the possibility of a population inversion for other transitions. We are in particular interested in the transition since Boland & de Jong (1981) predicted a detectable maser line for this transition. In the upper panel we show the results for the case of collisional excitation for the transition as well as for the (14.5 GHz), (28.9 GHz) and (48.3 GHz) transitions. Our choice for the last three transitions is based on the slower spontaneous decay rates from the upper to the lower levels for these transitions compared to other transitions. The gas kinetic temperature was taken as 180 K and = . In this case only the transition shows a population inversion.
The middle and bottom panels show the results for more general cases where collisions and the dust- and free-free continuum radiation fields were included. The middle panel is for the case when the associated H II region has an emission measure of and the bottom panel for an emission measure of . The transition is seen to show only a very weak inversion while there are no inversions for the and transitions for an emission measure of . For an emission measure of the transition shows a larger negative optical depth while the transition shows only a very weak inversion. These results suggests that apart from the transition, the and transitions are inverted only in the presence of the free-free continuum radiation field and then only for fairly large values of the emission measure. The optical depth for the 28.9 GHz maser is, however, so small that it is unlikely that it will be detected while the 14.5 GHz maser is expected to be detectable but significantly fainter than the 4.8 GHz maser.
4 Discussion
The results presented above show that the 4.8 GHz masers can be pumped via collisions with as well as radiatively by the free-free continuum emission from a nearby ultra- or hypercompact H II region but not by the dust infrared radiation field. Before discussing the implication of this result for the interpretation of the and flares in G37.55+0.20E is it necessary to consider a few aspects of the results presented above.
Inspection of Figs. 1, 2, and 5 shows that the maximum value for the optical depth for the transition lies between -2.5 and -3.0. This means that our calculations predict an amplification factor () of at most 20. Even if the brightness temperature of the background source is K it will therefore not be possible to explain maser brightness temperatures greater than K. On the other hand, the model by Boland & de Jong (1981) could produce optical depths of -5 with which it is possible to explain brightness temperatures of the order of K. The reason for this difference between the present calculations and that of Boland & de Jong (1981) is not clear. Within the framework of the present calculations is it therefore possible to explain the fainter but not the brightest Galactic 4.8 GHz masers.
A second point to be noted is that in the case of purely collisional excitation the specific column density where is a maximum lies between about and . Although the aim of the present calculations is not to discuss any particular source, the values of the specific column density where reaches a maximum should be taken note of as it might imply very large maser path lengths. For example, for = 180 K and = (see Fig. 1), is a maximum at an specific column density of . With the specific column density given by , the maser path length, , is found to be 7.5 pc with and . Such long path lengths are certainly not realistic for masers associated with Galactic star forming regions. It is interesting to note that Araya et al. (2007) refer to having found a similar result, ie. that very long, parsec scale, path lengths are required to explain the observed brightness temperatures of the 4.8 GHz masers.
To try to address this problem we note the following. First, in a recent study McCauley et al. (2011) used the and transitions of o- to estimate densities in 23 well studied molecular cores. The specific column densities found by these authors lie between and with an average of . If the pumping is purely collisional then, refering to Fig. 1, it is seen that these specific column densities are well below of what is required for a reasonable amplification factor for the transition. In the presence of a very compact H II region some inversion of the and transitions would have been possible (bottom panel of Fig. 8) at these specific column densities. But even in this case the masers would have been very weak. It would therefore appear as if masing of at least the transition requires larger specific column densities than what seems to be typically found for . The need for larger specific column than what is normally found for in star forming regions might be a reason for the rarity of the masers.
As already noted, the relatively large specific column densities where the amplification is significant implies unrealistically long maser path lengths. For a given density, , and specific column density, the only way to significantly reduce the maser path length is to increase the relative abundance of . In the above example we assumed a relative abundance of . However, Maret et al. (2004) found relative abundances for of up to in the inner warm regions of low mass protostellar envelopes. Applying this abundance to the above example would reduce the maser path length to 0.63 pc, which still might be too large. Cragg et al. (2005) found that the 6.7 and 12.2 GHz masers have their maximum brightness temperatures for a specific column density of about which is comparable to what is required for the 4.8 GHz maser. However, this result was found for = which is almost two orders of magnitude larger than the densities where (max) for the 4.8 GHz masers is a maximum. Using an average relative abundance for of (Maciel 2013) and , a maser path length of is found. If the path length of the 4.8 GHz maser is assumed to have this value, the relative abundance is required be approximately .
Such a large relative abundance for might seem unreasonable and it is beyond the scope of the present work to make any statements in this regard. However, given the rarity of masers it might not be unreasonable to postulate rare physical and chemical conditions in localized regions that can give rise to higher relative abundances. To explain the rarity of masers Hoffman et al. (2003) suggested that the 4.8 GHz maser inversion might be due to a rare collisional excitation. Our calculations have shown that inversion of the transition can be achieved through collisional excitation with and that it is not necessary to invoke a rare collisional mechanism. However, it seems as if it is still necessary to invoke some rare conditions to explain the 4.8 GHz masers. Gray (2012) proposes that the rarity of the 4.8 GHz masers might be due to a short lifetime of these masers. A short lifetime alone, however, might not be sufficient to explain the rarity of the masers. In addition to a short lifetime, larger than average abundances also seems to be required for the masers to operate.
We now turn to the implications of the above results for the masers in G37.55+0.20. The results presented above that the transition can be inverted collisionally via and radiatively via the free-free continuum radiation but not through the dust radiation field is contrary to the conclusion of Araya et al. (2010) that the correlated variability of the and masers in G37.55+0.20 implies the same excitation (pumping) mechanism for the two molecules. If the pumping mechanisms of and are in fact different then any proposed mechanism should be such that it can affect not only the dust temperature but also the gas kinetic temperature and/or the free-free emission from an associated H II region. As already pointed out the and maser flare profiles presented by Araya et al. (2010) are very similar. Thus, a further constraint is that whatever mechanism is proposed to simultaneously affect the pumping of the and masers, it should be such that the dust and gas temperatures and/or the properties of the H II region vary correctly in order to produce similar flare profiles. It is very difficult to envisage a single mechanism or even a number of coupled processes that can be responsible for such fine tuning, especially if the two masers are 2000 AU apart.
If the near simultaneous flaring of the and masers cannot be due to pumping effects, the only other possibility left is that it is due to changes in the background seed photon flux. It has been postulated that the periodic maser flares in G9.62+0.20E and G22.357+0.066 are due to changes in the free-free emission from parts of the background H II region against which they are projected (van der Walt 2011; Szymczak et al. 2011). Given that the flare profiles for the two masers in G37.55+0.20 are very similar and also resemble that of the periodic masers in G9.62+0.20E and G22.357+0.066, it is possible that the same underlying mechanism might be responsible for the maser flaring in these three sources.
5 Conclusions
We presented the results of a numerical calculation to determine the physical conditions under which a population inversion for the transition of can occur. The underlying aim of these calculations was to interpret the near simultaneous flaring of the 6.7 GHz and 4.8 GHz masers in G37.55+0.20. Considering the results presented above we conclude the following:
-
•
The transition can be inverted via collisional excitation with as well as by the free-free continuum of H II regions with emission measures greater than about .
-
•
The dust infrared emission does affect the level populations but does not result in a population inversion of the transition nor of any other possible masing transitions.
-
•
The maximum amplification found within the framework of our calculations is only about 20 which cannot explain the brightest 4.8 GHz masers.
-
•
If collisions are the only excitation mechanism a noteable amplification for the 4.8 GHz masers exists only for specific column densities above about . These specific column densities are significantly larger than what is derived from thermal line emission of .
-
•
To avoid unrealistically large maser path lengths it is necessary to postulate higher than average relative abundances for in the regions where the 4.8 GHz masers operate.
-
•
The and transitions are inverted only in the presence of the free-free continuum radiation field of very compact H II regions.
-
•
Due to the different pumping mechanisms of the and masers it is unlikely that the near simultaneous flaring of the and masers in G37.55+0.20 is due to changes in the pumping of the masers. Instead, as an alternative it is suggested that the flaring is due to a single process that affects the flux of the background seed photon flux for both of the masers even though they are 2000 AU apart.
Acknowledgements.
I would like to thank Melvin Hoare and Sharmila Goedhart for valuable comments on an earlier version of the manuscript as well as an anonymous referee and Malcolm Walmsley for useful comments. This work was supported by the National Research Foundation under grant number 2053475.References
- Araya et al. (2007) Araya, E., Hofner, P., Kurtz, S., et al. 2007, in IAU Symposium, Vol. 242, IAU Symposium, ed. J. M. Chapman & W. A. Baan, 140–141
- Araya et al. (2010) Araya, E. D., Hofner, P., Goss, W. M., et al. 2010, ApJ, 717, L133
- Baan et al. (1986) Baan, W. A., Guesten, R., & Haschick, A. D. 1986, ApJ, 305, 830
- Boland & de Jong (1981) Boland, W. & de Jong, T. 1981, A&A, 98, 149
- Cragg et al. (2002) Cragg, D. M., Sobolev, A. M., & Godfrey, P. D. 2002, MNRAS, 331, 521
- Cragg et al. (2005) Cragg, D. M., Sobolev, A. M., & Godfrey, P. D. 2005, MNRAS, 360, 533
- Goedhart et al. (2003) Goedhart, S., Gaylard, M. J., & van der Walt, D. J. 2003, MNRAS, 339, L33
- Goedhart et al. (2007) Goedhart, S., Gaylard, M. J., & van der Walt, D. J. 2007, in IAU Symposium, Vol. 242, IAU Symposium, ed. J. M. Chapman & W. A. Baan, 97–101
- Goedhart et al. (2009) Goedhart, S., Langa, M. C., Gaylard, M. J., & van der Walt, D. J. 2009, MNRAS, 398, 995
- Gray (2012) Gray, M. 2012, Maser Sources in Astrophysics (Cambridge University Press)
- Hoffman et al. (2003) Hoffman, I. M., Goss, W. M., Palmer, P., & Richards, A. M. S. 2003, ApJ, 598, 1061
- Kreyszig (1979) Kreyszig, E. 1979, Advanced Engineering Mathematics (Wiley)
- Maciel (2013) Maciel, W. J. 2013, Astrophysics of the Interstellar Medium (Springer)
- Maret et al. (2004) Maret, S., Ceccarelli, C., Caux, E., et al. 2004, A&A, 416, 577
- McCauley et al. (2011) McCauley, P. I., Mangum, J. G., & Wootten, A. 2011, ApJ, 742, 58
- Mehringer et al. (1994) Mehringer, D. M., Goss, W. M., & Palmer, P. 1994, ApJ, 434, 237
- Menten (2012) Menten, K. M. 2012, in IAU Symposium, Vol. 287, IAU Symposium, ed. R. S. Booth, W. H. T. Vlemmings, & E. M. L. Humphreys, 506–515
- Pavlakis & Kylafis (1996) Pavlakis, K. G. & Kylafis, N. D. 1996, ApJ, 467, 309
- Schöier et al. (2005) Schöier, F. L., van der Tak, F. F. S., van Dishoeck, E. F., & Black, J. H. 2005, A&A, 432, 369
- Sobolev et al. (1997) Sobolev, A. M., Cragg, D. M., & Godfrey, P. D. 1997, A&A, 324, 211
- Sobolev & Deguchi (1994) Sobolev, A. M. & Deguchi, S. 1994, A&A, 291, 569
- Szymczak et al. (2011) Szymczak, M., Wolak, P., Bartkiewicz, A., & van Langevelde, H. J. 2011, A&A, 531, L3
- Thaddeus (1972) Thaddeus, P. 1972, ApJ, 173, 317
- van der Walt (2011) van der Walt, D. J. 2011, AJ, 141, 152
- van der Walt et al. (2009) van der Walt, D. J., Goedhart, S., & Gaylard, M. J. 2009, MNRAS, 398, 961
- Wiesenfeld & Faure (2013) Wiesenfeld, L. & Faure, A. 2013, MNRAS, 432, 2573