Search for gamma-ray-emitting active galactic nuclei in the Fermi-LAT unassociated sample using machine learning
Abstract
The second Fermi-LAT source catalog (2FGL) is the deepest all-sky survey available in the gamma-ray band. It contains 1873 sources, of which 576 remain unassociated. Machine-learning algorithms can be trained on the gamma-ray properties of known active galactic nuclei (AGN) to find objects with AGN-like properties in the unassociated sample. This analysis finds 231 high-confidence AGN candidates, with increased robustness provided by intersecting two complementary algorithms. A method to estimate the performance of the classification algorithm is also presented, that takes into account the differences between associated and unassociated gamma-ray sources. Follow-up observations targeting AGN candidates, or studies of multiwavelength archival data, will reduce the number of unassociated gamma-ray sources and contribute to a more complete characterization of the population of gamma-ray emitting AGN.
Subject headings:
catalogs, galaxies: active, gamma rays: galaxies, methods: statistical1. Introduction
The identification of astrophysical MeV and GeV sources has been a long-standing question in gamma-ray astronomy, mainly due to the limited angular resolution of gamma-ray detectors. The pioneer SAS-2 and COS-B satellites reported detections of 26 sources with median location error of (Hartman et al., 1979; Swanenburg et al., 1981). However, only the emission from the Crab (catalog ) and Vela (catalog ) pulsars and the quasar 3C 273 (catalog 3C 273) could be firmly identified. The deeper survey by EGRET reported 271 gamma-ray sources with a median location error of , but only 101 identifications were reported (Hartman et al., 1999).
The Large Area Telescope (LAT) aboard the Fermi Gamma-ray Space Telescope started operations in 2008. The increased effective area, reduced dead time, and use of silicon tracker technology resulted in an order of magnitude improvement in source location compared to its predecessors. The second Fermi-LAT source catalog (2FGL, Nolan et al., 2012) characterizes 1873 gamma-ray sources between 0.1 and 100 GeV with a median location error of . A total of 1297 sources in the 2FGL are either identified through variability or morphology, or reliably associated with counterparts from catalogs of candidate gamma-ray-emitting source classes. The remaining 576 sources for which no counterpart was identified are left unassociated.
| Class | Description | Source count | Label |
|---|---|---|---|
| bzb | BL Lac-type blazar | 436 | AGN |
| bzq | FSRQ-type blazar | 370 | AGN |
| agu | AGN of uncertain type | 257 | AGN |
| agn | Non-blazar AGN | 11 | AGN |
| rdg | Radio galaxy | 12 | AGN |
| sey | Seyfert galaxy | 6 | AGN |
| psr | Pulsar | 108 | non-AGN |
| glc | Globular cluster | 11 | non-AGN |
| snr | Supernova remnant | 10 | non-AGN |
| pwn | Pulsar wind nebula | 3 | non-AGN |
| spp | SNR / PWN | 58 | non-AGN |
| hmb | High-mass binary | 4 | non-AGN |
| nov | Nova | 1 | non-AGN |
| gal | Normal galaxy | 6 | non-AGN |
| sbg | Starburst galaxy | 4 | non-AGN |
| Unassociated sources | 576 |
Several studies have addressed the nature of unidentified gamma-ray sources. Searches for counterparts have been carried out through dedicated observations of the source error boxes (e.g., Ozel et al., 1988; Crawford et al., 2006) or cross-correlations with multiwavelength catalogs (Romero et al., 1999; Sowards-Emmerd et al., 2003). Others studied latitude and flux distributions to discriminate between different source populations in the unidentified sample (Lamb & Macomb, 1997; Gehrels et al., 2000), or compared the properties of unidentified sources to those of candidate source populations (Mukherjee et al., 1995; Kaaret & Cottam, 1996; Merck et al., 1996). A new possibility offered by the large number of sources reported by Fermi-LAT is to train machine-learning algorithms on populations of known gamma-ray sources to find similar candidates in the unassociated sample. Ackermann et al. (2012) characterized the gamma-ray properties of pulsars and active galactic nuclei (AGN) in the LAT 11-month catalog (Abdo et al., 2010b), and listed unassociated sources with similar characteristics. Mirabal et al. (2012) followed a similar approach, finding candidate classifications for unassociated 2FGL sources at high Galactic latitudes (), while Lee et al. (2012) used a Bayesian approach to find pulsar candidates.
In this work, machine-learning algorithms are used to identify unassociated sources in the 2FGL catalog with properties similar to gamma-ray-emitting AGN. Two different learning algorithms are trained on the gamma-ray properties of the known AGN in the 2FGL catalog. Only the sources selected by both algorithms independently are considered AGN candidates, adding robustness to the classification method. In addition, a realistic way of estimating the performance of classification methods is presented that takes into account the differences between the associated and unassociated source samples. Section 2 of this paper describes the properties of the 2FGL catalog. Section 3 shows how the data was prepared and which classification algorithms were tested, while Section 4 discusses how the algorithms were optimized. The method for performance estimation is discussed in Section 5, and the final results are presented in Section 6. Finally, Section 7 summarizes the main conclusions of this study.
2. Source classes in the 2FGL catalog
There are fourteen classes of gamma-ray sources represented in the 2FGL catalog (Table 1). The different types of AGN add up to 60% of the population. The rest of the catalog is distributed among unassociated sources (31%), and source classes with smaller number counts.
In this study, the classification of unassociated 2FGL sources is approached as a two-class problem, where each source is either labeled as “AGN” or “non-AGN” (see Table 1). Of the total number of associated sources, 1092 are labeled as AGN and 205 as non-AGN: mostly pulsars, pulsar wind nebulae and supernova remnants.
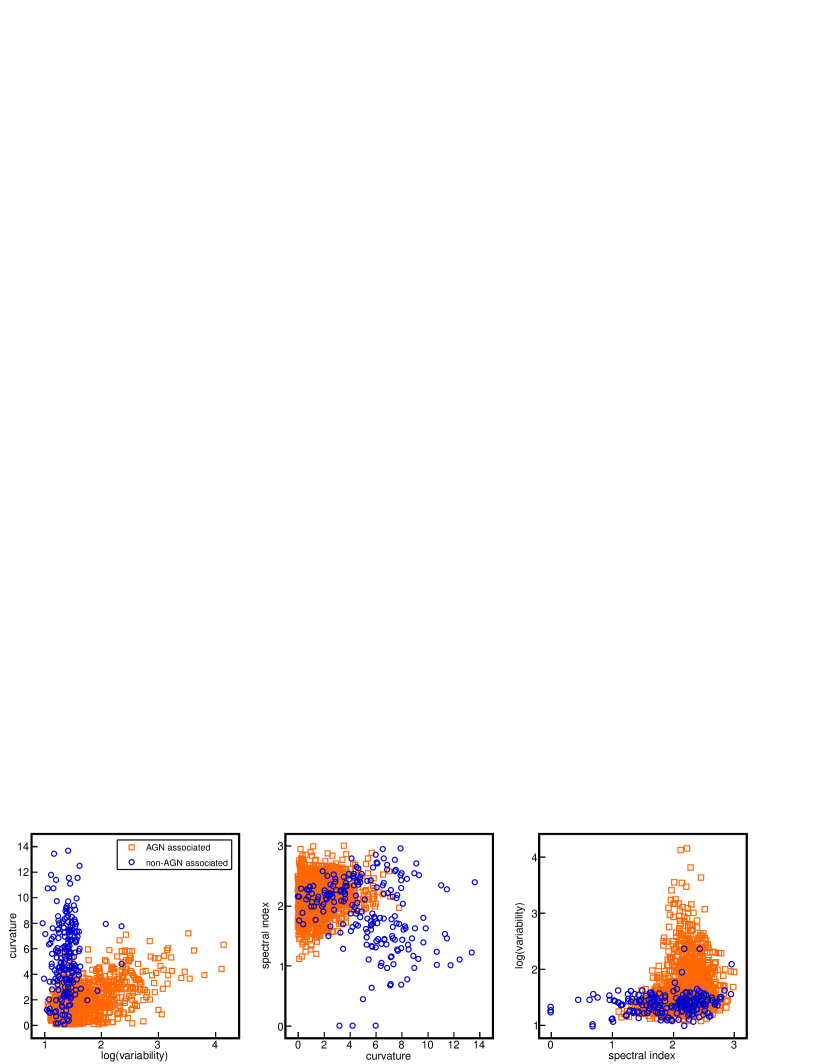
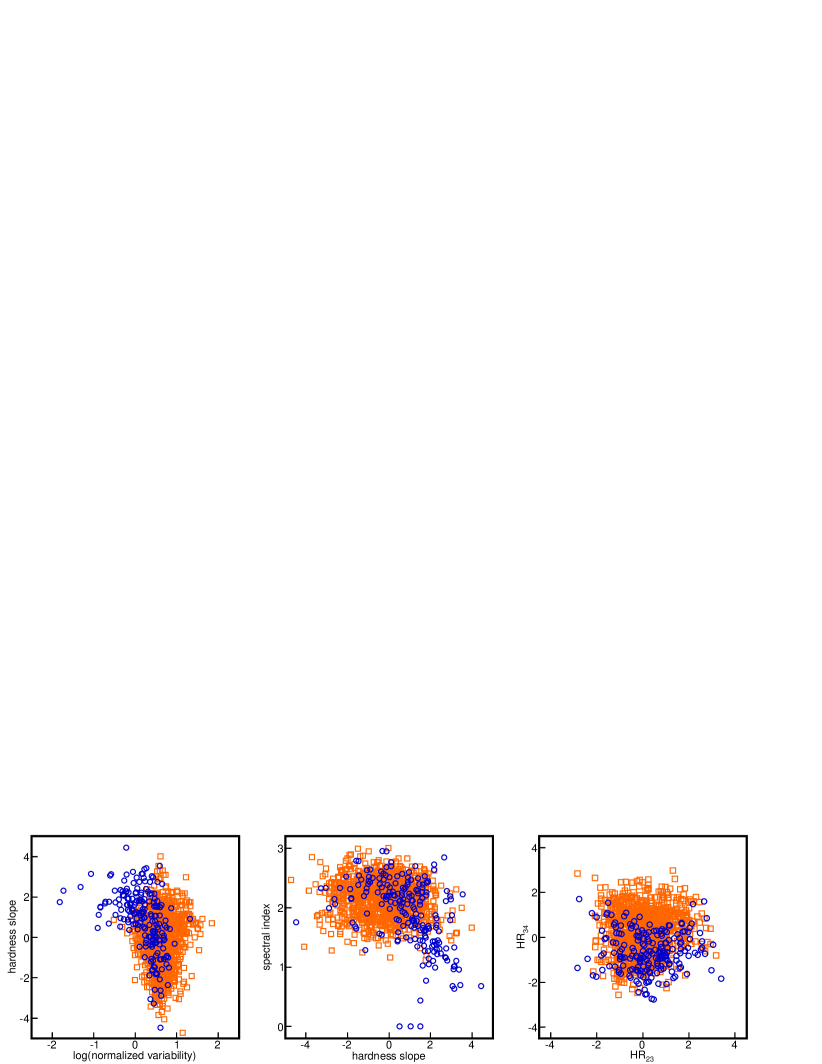
The gamma-ray properties of LAT-detected sources are discussed in detail in Nolan et al. (2012). Bright AGN exhibit significant flux variability, while pulsars show indication of spectral curvature (Ackermann et al., 2012). The top panels of Figure 1 show differences between AGN and non-AGN in some parameter distributions. Given these differences, machine-learning algorithms can be trained to recognize unassociated sources with AGN-like properties. Although pulsars also have distinct gamma-ray properties, they are not treated as a separate population to produce a list of pulsar candidates in this work. Detailed searches for pulsar candidates and multiwavelength counterparts have received much more attention than AGN in the recent literature (see, e.g., Keith et al., 2011; Kerr et al., 2012; Lee et al., 2012; Abdo et al., 2013).
3. Data preparation and classification methods
Before starting the learning process, the sample of associated sources (1297 objects) was split into two subsamples: training (70% of the sources) and test (30%). Subsamples were selected using stratified sampling to avoid biasing the parameter distributions. The training sample was used to train the learning algorithms and optimize their performance, while the test sample was set aside to evaluate the performance of the classification methods once all the optimizations were made.
Two quantities characterize the performance of classification algorithms: recall and false-association rate. The recall is calculated in this study as the fraction of true AGN that are correctly labeled as AGN, and the false-association rate is defined as the fraction of non-AGN sources that are misclassified as AGN.
In a first step, a variety of supervised machine-learning classification methods were investigated, covering random forest (Breiman, 2001), support vector machines (Chang & Lin, 2011), support vector networks (Cortes & Vapnik, 1995), bayesian classification (Berger, 1980), logistic regression (Hosmer & Lemeshow, 2000), nearest-neighbor pattern classification (Cover & Hart, 1967), and multi-layer perceptrons, also known as neural networks (Rosenblatt, 1961; Cybenko, 1989). Algorithms were trained using the variables from Ackermann et al. (2012) and default settings (e.g., number of iterations). The performance parameters were estimated using ten-fold cross-validation on the training sample, where the classifier is iteratively trained on 90% of the sample and tested on the remaining 10%, repeating the process ten times until the entire training sample has been tested.
Based on performance, random forest (RF) and neural networks (NN) were selected. The choice of two independent algorithms adds robustness to the overall classification scheme (RF & NN), which requires both RF and NN to label a source as AGN for it to be considered an AGN candidate. Combinations of three or more learning algorithms were also explored without showing any significant improvement of the performance.
The selection of RF and NN was done after a coarse test over several algorithms. It is not excluded that, after a better optimization, other algorithms could slightly improve the results presented here.
4. Optimization of the learning algorithms
Optimization of the RF and NN methods was done by selecting the set of parameters that optimizes the learning process, tuning the running parameters of the classification algorithms, and adjusting the confidence thresholds to select AGN candidates.
Different attributes from the 2FGL catalog were used during the learning process: spectral index, (flux in the 5 reported energy bands), variability, curvature, and significance (square root of the value). The best separation power between the populations of AGN and non-AGN was found using spectral index and seven combinations of the abovementioned parameters (many already introduced in Ackermann et al. (2012)): , , , , hardness slope, normalized variability, and normalized curvature. describes the hardness ratio between the energy fluxes measured in two contiguous spectral bands:
| (1) |
where and are, respectively, the flux and mean energy in the -th spectral energy band. A hardness slope parameter was also defined as
| (2) |
which presents a powerful handle to separate possible AGN candidates from pulsar-like sources. Two additional parameters were also included:
| (3) | |||
| (4) |
Direct use of variables correlated with the overall flux of each source was avoided, and all parameter distributions were renormalized between 0 and 1 to minimize the influence of their very different ranges.


| AGNAGN | non-AGNAGN | recall | false-assoc. rate | |
|---|---|---|---|---|
| random forest | 289 | 12 | 88.1% | 16.3% |
| neural networks | 278 | 12 | 84.7% | 13.5% |
| RF & NN | 261 | 9 | 79.6% | 11.2% |

The two selected learning algorithms have parameters that can be tuned to improve the performance of the method (see Breiman, 2001; Cybenko, 1989, for definitions). The RF parameters were adjusted to and . For NN, values of , , and were found to be optimal.
After the learning process, RF and NN independently give a likelihood of a tested source to be an AGN. Figure 2 shows likelihood distributions obtained with the RF and NN applied to the test sample. Thresholds of and were required for each method to label a source as an AGN. The thresholds were optimized targeting a false-association rate of for the combined classification method (RF & NN).
5. Performance of the classification method
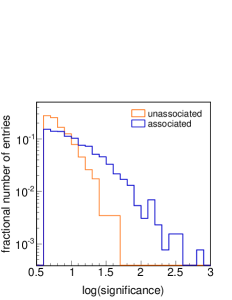
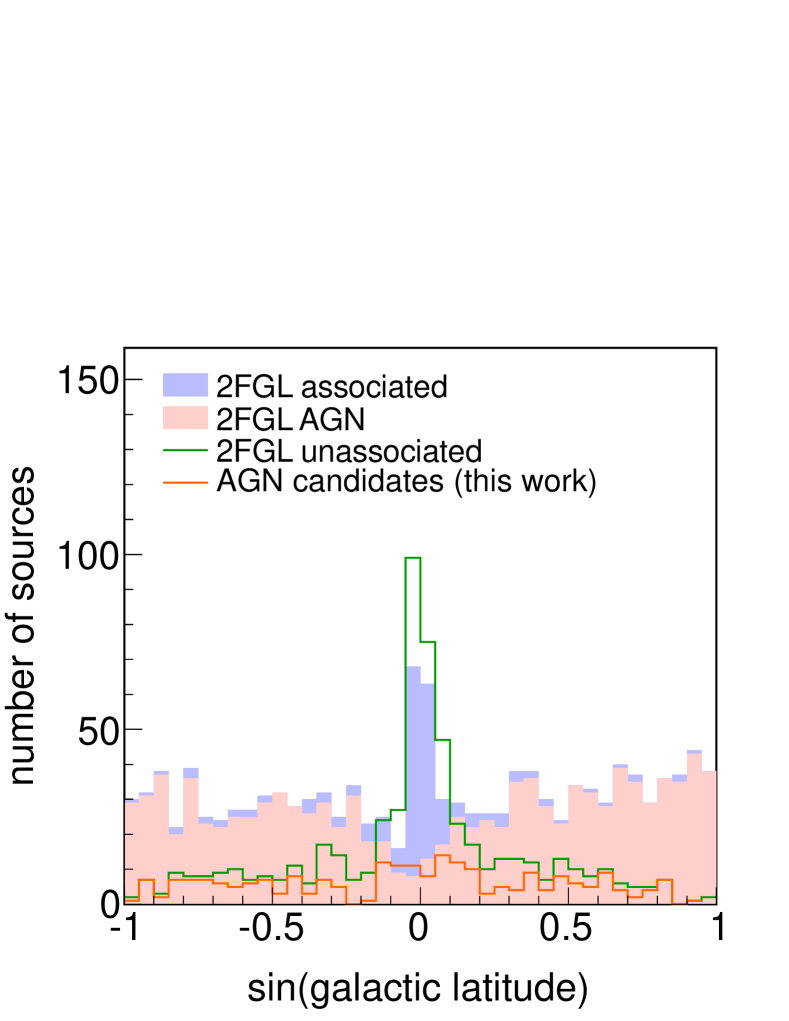
The performance of the classification algorithms is evaluated on the test sample, and is used to predict the completeness and number of spurious sources present in the final list of AGN candidates. However, the gamma-ray properties of associated (test) and unassociated sources differ in parameters that affect the performance of the classification methods. Figure 3 shows that unassociated sources appear to be more clustered at low significances and low Galactic latitudes than sources in the associated sample. This is expected, as association probabilities are lower for sources with larger location errors, and counterpart catalogs tend to be incomplete near the Galactic plane (see Nolan et al., 2012, also discussion in Section 7).
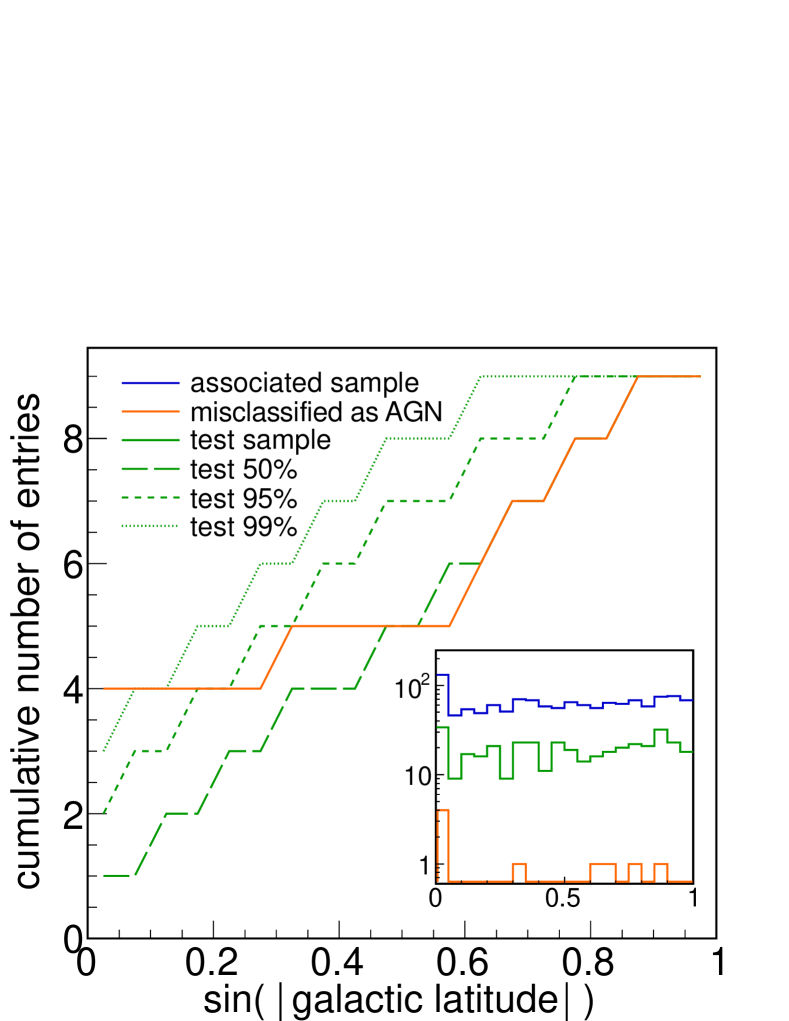
Low-significance and low-latitude sources also challenge machine-learning classification algorithms. They are often too faint and/or influenced by the bright Galactic foreground to extract definitive information on their spectral shape and flux variability. As shown in the top panel of Figure 4, the number of sources incorrectly labeled as AGN at low latitudes has a probability of of arising from random sampling the test sample. It is also shown (Figure 4, bottom panel) that all misclassified sources have . This scenario has a chance probability of 1% if the performance of the classification algorithm would not depend on significance. These trends, and the differences between populations shown in Figure 3, imply that sources in the test sample are easier to classify (or less likely to be misclassified) than unassociated sources. Therefore, a false-association rate directly evaluated on the test sample will lead to an over-optimistic performance estimate.
To overcome this limitation, sources are binned in significance and Galactic latitude. Then, weights are calculated as , where and are, respectively, the number of associated and unassociated sources in the -th bin. The actual binning and weight values are shown in the right panel of Figure 3. The false-association rate is then estimated as
| (5) |
where is the number of sources misclassified as AGN on each bin, and the number of sources labeled as AGN. The use of weights corrects the bias introduced by the differences between source populations, giving a realistic estimate of the false-association rate.
The performance of the classification algorithm (RF & NN), together with the individual performance of each learning method, is shown in Table 2. The algorithm is expected to recognize 80% of the AGN present in the unassociated sample, with a false-association rate of 11%.
6. List of AGN candidates
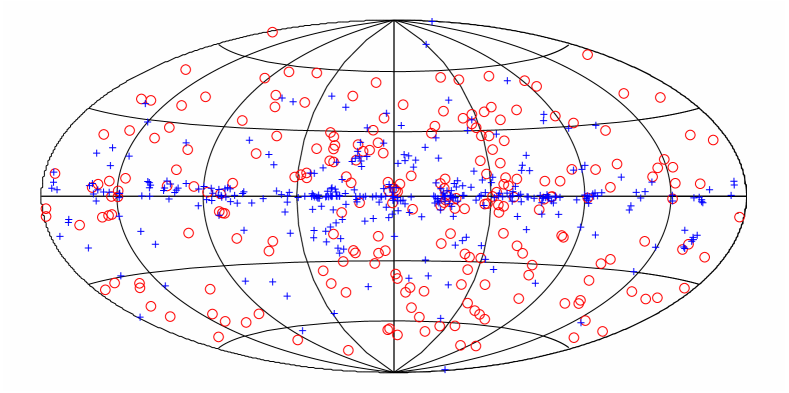
The classification algorithm (RF & NN) was applied to the sample of unassociated 2FGL sources to produce the list of high-confidence AGN candidates shown in Table 3, which is the main result of this study. A total of 231 AGN candidates are found among the 576 unassociated sources that were studied. The sky distribution of the AGN candidates, together with the unassociated sources that were not conclusively labeled, is shown in Figure 5.
The 231 AGN candidates constitute 40% of the 2FGL unassociated sources. This is in line with estimates from similar works, that predicted of unassociated gamma-ray sources detected by Fermi-LAT to be AGN (Ackermann et al., 2012; Ferrara et al., 2012). Out of 159 AGN candidates at , 156 are also listed as likely AGN according to a previous work by Mirabal et al. (2012) that focused only on 2FGL sources outside the galactic plane.
Sources potentially confused with interstellar emission (flagged with a “c” designator in the 2FGL catalog) were treated as regular sources throughout the analysis. Those constitute 22% of the unassociated sample, and have typically low detection significances. The list of 231 AGN candidates contains 22 sources with “c” designator (9%), showing that confused sources were less likely to be labeled as high-confidence AGN, as expected for weak sources where the spectral and variability properties are less certain.
The classification algorithm finds 11 sources at with no significant similarities with known AGN ( & ). These could potentially be interesting, as searches for dark matter annihilation or decay signals from dark subhaloes target high-latitude unassociated sources with no obvious counterparts (Nieto et al., 2011; Zechlin & Horns, 2012). However, all but 2FGL J0538.5-0534c (catalog 2FGL J0538.5-0534c) are pulsar candidates (Ackermann et al., 2012; Mirabal et al., 2012; Lee et al., 2012) or have known X-ray counterparts (Takeuchi et al., 2013).
| 2FGL name | R.A. [∘] | decl. [∘] | (1) | (2) | ||
|---|---|---|---|---|---|---|
| J0004.2+2208 | 1.056 | 22.137 | 0.98 | 0.97 | A | |
| J0014.3-0509 | 3.581 | -5.153 | 1.00 | 1.00 | A | |
| J0031.0+0724 | 7.775 | 7.414 | 0.99 | 1.00 | A | b |
| J0032.7-5521 | 8.179 | -55.356 | 1.00 | 1.00 | A | |
| J0048.8-6347 | 12.218 | -63.79 | 0.90 | 0.92 | A | b |
| J0102.2+0943 | 15.553 | 9.726 | 1.00 | 1.00 | A | b |
| J0103.8+1324 | 15.953 | 13.401 | 0.96 | 1.00 | A | b |
| J0116.6-6153 | 19.174 | -61.887 | 1.00 | 1.00 | A | ab |
| J0133.4-4408 | 23.364 | -44.142 | 0.99 | 1.00 | A | ab |
| J0143.6-5844 | 25.917 | -58.745 | 0.98 | 1.00 | A | abc |
7. Discussion and conclusions
This work studied the sample of unassociated gamma-ray sources in the Fermi-LAT 2FGL catalog, finding 231 AGN candidates based on their gamma-ray properties. Two independent machine-learning algorithms (random forest and neural networks) were used to asses the likelihood of each source to be an AGN, and intersected to add robustness to the classification method and reduce the number of false associations.
The study includes for the first time an estimate of the false-association rate that takes into account the differences between associated and unassociated gamma-ray sources. By evaluating the performance using a test sample weighted in significance and Galactic latitude, the obtained 11% false-association rate can be considered a realistic estimate of the fraction of spurious sources present in the AGN-candidate list. Ackermann et al. (2012) obtained a lower false-association rate directly evaluated on the test sample, which is likely an optimistic performance estimate as discussed in Section 5. Similarly, Mirabal et al. (2012) used cross-validation on the training sample, which is known to give an optimistic performance, as the same sources used to optimize the classification method are used to calculate the false-association rate.
The list of AGN candidates (Table 3) covers the whole sky, studying for the first time the strip that covers the Galactic plane, where more than 50% of the unassociated 2FGL sources are located. About 210 AGN are expected at extrapolating from high-latitude observations (Ackermann et al., 2011), while only 104 are listed in the 2FGL catalog. Even though low-latitude sources are harder to classify, 72 AGN candidates were found at (see Figure 6), which could be a significant fraction of the missing AGN close to the Galactic plane. At , the list of AGN candidates is in good agreement with previous work by Mirabal et al. (2012). Their study found 60 additional AGN candidates, which could be a combination of their method being more sensitive, as it was trained on a cleaner sample of high-latitude sources, and a lower confidence threshold to identify AGN candidates.
Close to the Galactic plane, AGN are difficult to identify due to optical extinction and the bright foreground in radio and soft X-rays. Counterpart catalogs are usually incomplete at low latitudes or skip the Galactic plane altogether (e.g., Healey et al., 2008; Massaro et al., 2009). Galactic absorption for gamma rays is negligible below 10 TeV (Moskalenko et al., 2006), making low-latitude AGN detectable in the gamma-ray band but difficult to catalog at lower frequencies. In fact, numerous identifications of AGN behind the Galactic plane have been triggered by gamma-ray detections at GeV (Mukherjee et al., 2000; Mirabal & Halpern, 2009; Kara et al., 2012) and TeV energies (Abramowski et al., 2011; Archambault et al., 2013).
The list of 231 candidate AGN presented here cannot be considered source associations, but only objects likely to be associated with AGN. In case of gamma-ray-emitting AGN, detectable levels of non-thermal emission in radio, optical, and X-ray frequencies are expected, and follow-up observations in those bands are needed to unambiguously identify the nature of the gamma-ray emission. Observations in the X-ray band (0.2-10 keV) have been successful in finding counterparts of unidentified gamma-ray sources (e.g., Mukherjee et al., 2000). The angular resolution of X-ray telescopes ( for Swift-XRT) can resolve individual sources inside the typical error box of unassociated 2FGL sources. Follow-up observations in radio and optical spectroscopy of candidate X-ray counterparts can then provide a solid AGN identification and spectral class (e.g., Halpern et al., 2001).
The Swift X-ray satellite has observed a good fraction of the 2FGL unassociated sources. A complete summary of these observations can be found in http://www.swift.psu.edu/unassociated/ (Stroh & Falcone, 2013). So far, 135 out of the 231 candidate AGN have at least 2 ks of Swift-XRT exposure. A good fraction of these have also been analyzed in Paggi et al. (2013), finding 85 sources with at least one point-like X-ray counterpart. Infrared counterparts with AGN-like spectra have been identified for 56 of the AGN candidates in the WISE all-sky survey (Massaro et al., 2013b). Recently, Acero et al. (2013) presented a multiwavelength study of seven unassociated sources where four AGN candidates were investigated and confirmed to have AGN-like properties in the radio and X-ray bands. These counterparts are listed in Table 3.
Counterpart catalogs of gamma-ray-emitting AGN candidates are mostly based on the population of AGN detected by EGRET (Mukherjee et al., 1997), that contained a large number of flat-spectrum radio quasars (FSRQ, 71%) and fewer BL Lac-type objects (27%). Similar FSRQ/BL Lac ratios are found in counterpart catalogs such as CGRaBS (84% FSRQ / 10% BL Lac, Healey et al., 2008) or BZCAT (54%/39%, Massaro et al., 2009). However, BL Lacs are more numerous than FSRQ in the 2FGL catalog (34%/40%, see Table 1). LAT-detected BL Lacs have a median radio flux density of 86 mJy (Ackermann et al., 2011), with a low-flux tail extending well below the completeness limit of the CRATES/CGRaBS catalog (65 mJy, Healey et al., 2007). The potential deficit of BL Lacs in counterpart catalogs suggests that a fraction of unassociated 2FGL sources might indeed be BL Lac-type blazars that have not yet been cataloged. This could become relevant in searches for TeV-emitting AGN with present ground-based observatories (e.g., Massaro et al., 2013c), and prospects for future installations like CTA (Sol et al., 2013), as the harder gamma-ray spectra of BL Lacs favor their detection at TeV energies over FSRQ.
Follow-up studies on the AGN candidates presented here will reduce the number of unassociated gamma-ray sources and yield a more complete picture of the characteristics of gamma-ray-loud AGN. Additionally, future observations could prove whether the population of gamma-ray-emitting BL Lacs extends to sources with low radio flux density. If confirmed, gamma-ray emission from BL Lacs with luminosities will give additional information on the low end of BL Lac luminosity function in the gamma-ray band (Ajello et al., 2013), which is a key ingredient to estimate their contribution to the isotropic diffuse gamma-ray background (Abdo et al., 2010a).
References
- Abdo et al. (2010a) Abdo, A. A., Ackermann, M., Ajello, M., et al. 2010, Phys. Rev. Lett., 104, 101101
- Abdo et al. (2010b) Abdo, A. A., Ackermann, M., Ajello, M., et al. 2010, ApJS, 188, 405
- Abdo et al. (2013) Abdo, A. A., Ajello, M., Allafort, A., et al. 2013, ApJS, 208, 17
- Abramowski et al. (2011) Abramowski, A., Acero, F., Aharonian, F., et al. 2011, A&A, 529, A49
- Acero et al. (2013) Acero, F., Donato, D., Ojha, R., et al. 2013, ApJ, 779, 133
- Ackermann et al. (2011) Ackermann, M., Ajello, M., Allafort, A., et al. 2011, ApJ, 743, 171
- Ackermann et al. (2012) Ackermann, M., Ajello, M., Allafort, A., et al. 2012, ApJ, 753, 83
- Ajello et al. (2013) Ajello, M., Romani, R. W., Gasparrini, D., et al. 2013, ApJ, 780, 73
- Archambault et al. (2013) Archambault, S., Arlen, T., Aune, T., et al. 2013, ApJ, 776, 69
- Berger (1980) Berger, J. O. 1980, “Statistical decision theory and bayesian analysis” (Springer, New York)
- Bertsekas & Tsitsiklis (1995) Bertsekas, D. P. & Tsitsiklis, J. N. 1995, Neuro-dynamic programming: an overview Vol. 1, 560
- Breiman (2001) Breiman, L. 2001, Machine Learning, Vol. 45
- Chang & Lin (2011) Chang, C.-C. & Lin, C.-J. 2011, ACM Transactions on Intelligent Systems and Technology, 2, 27
- Cortes & Vapnik (1995) Cortes, C. & Vapnik, V. 1995, Machine Learning, 20, 273
- Cover & Hart (1967) Cover, T. & Hart, P. 1967, IEEE Transactions on Information Theory, 13, 21
- Crawford et al. (2006) Crawford, F., Roberts, M. S. E., Hessels, J. W. T., et al. 2006, ApJ, 652, 1499
- Cybenko (1989) Cybenko, G. 1989, Math. Control Signals Systems, 2, 303
- Doert & Errando (2013) Doert, M., & Errando, M. 2013, to appear in Proc. 33rd Int. Cosmic Ray Conf. (Rio de Janeiro), arXiv:1306.6529
- Ferrara et al. (2012) Ferrara, E. C., Ojha, R., Monzani, M. E., & Omodei, N. 2012, in Proc. 2012 Fermi & Jansky - eConf C1111101 (arXiv:1206.2571)
- Gehrels et al. (2000) Gehrels, N., Macomb, D. J., Bertsch, D. L., Thompson, D. J., & Hartman, R. C. 2000, Nature, 404, 363
- Ghirlanda et al. (2010) Ghirlanda, G., Ghisellini, G., Tavecchio, F., & Foschini, L. 2010, MNRAS, 407, 791
- Halpern et al. (2001) Halpern, J. P., Eracleous, M., Mukherjee, R., & Gotthelf, E. V. 2001, ApJ, 551, 1016
- Hartman et al. (1999) Hartman, R. C., Bertsch, D. L., Bloom, S. D., et al. 1999, ApJS, 123, 79
- Hartman et al. (1979) Hartman, R. C., Kniffen, D. A., Thompson, D. J., et al. 1979, ApJ, 230, 597
- Healey et al. (2008) Healey, S. E., Romani, R. W., Cotter, G., et al. 2008, ApJS, 175, 97
- Healey et al. (2007) Healey, S. E., Romani, R. W., Taylor, G. B., et al. 2007, ApJS, 171, 61
- Hosmer & Lemeshow (2000) Hosmer, D., & Lemeshow, S. 2000, “Applied Logistic Regression, 2nd edn.” (John Wiley & Sons, Inc., New York)
- Kaaret & Cottam (1996) Kaaret, P., & Cottam, J. 1996, ApJ, 462, L35
- Kara et al. (2012) Kara, E., Errando, M., Max-Moerbeck, W., et al. 2012, ApJ, 746, 159
- Keith et al. (2011) Keith, M. J., Johnston, S., Ray, P. S., et al. 2011, MNRAS, 414, 1292
- Kerr et al. (2012) Kerr, M., Camilo, F., Johnson, T. J., et al. 2012, ApJ, 748, L2
- Lamb & Macomb (1997) Lamb, R. C., & Macomb, D. J. 1997, ApJ, 488, 872
- Lee et al. (2012) Lee, K. J., Guillemot, L., Yue, Y. L., Kramer, M., & Champion, D. J. 2012, MNRAS, 424, 2832
- Massaro et al. (2009) Massaro, E., Giommi, P., Leto, C., et al. 2009, A&A, 495, 691
- Massaro et al. (2013a) Massaro, F., D’Abrusco, R., Giroletti, M., et al. 2013a, ApJS, 207, 4
- Massaro et al. (2013b) Massaro, F., D’Abrusco, R., Paggi, A., et al. 2013b, ApJS, 206, 13
- Massaro et al. (2013c) Massaro, F., Paggi, A., Errando, M., et al. 2013c, ApJS, 207, 16
- Merck et al. (1996) Merck, M., Bertsch, D. L., Dingus, B. L., et al. 1996, A&AS, 120, 465
- Mierswa (2006) Mierswa, I. et al. 2006, in Proc. 12th ACM SIGKDD Int. Conf. on Knowledge discovery and data mining, 935
- Mirabal & Halpern (2009) Mirabal, N., & Halpern, J. P. 2009, ApJ, 701, L129
- Mirabal et al. (2012) Mirabal, N., Frías-Martinez, V., Hassan, T., and Frías-Martinez, E. 2012, MNRAS, 424, L64
- Moskalenko et al. (2006) Moskalenko, I. V., Porter, T. A., & Strong, A. W. 2006, ApJ, 640, L155
- Mukherjee et al. (1997) Mukherjee, R., Bertsch, D. L., Bloom, S. D., et al. 1997, ApJ, 490, 116
- Mukherjee et al. (1995) Mukherjee, R., Bertsch, D. L., Dingus, B. L., et al. 1995, ApJ, 441, L61
- Mukherjee et al. (2000) Mukherjee, R., Gotthelf, E. V., Halpern, J., & Tavani, M. 2000, ApJ, 542, 740
- Nieto et al. (2011) Nieto, D., Aleksić, J., Barrio, J. A., et al. 2011, in Proc. 33rd Int. Cosmic Ray Conf. (Beijing) arXiv:1109.5935
- Nolan et al. (2012) Nolan, P. L., Abdo, A. A., Ackermann, M., et al. 2012, ApJS, 199, 31
- Ozel et al. (1988) Ozel, M. E., Schlickeiser, R., Sieber, W., & Younis, S. 1988, A&A, 200, 195
- Paggi et al. (2013) Paggi, A., Massaro, F., D’Abrusco, R., et al. 2013, ApJS, 209, 9
- Romero et al. (1999) Romero, G. E., Benaglia, P., & Torres, D. F. 1999, A&A, 348, 868
- Rosenblatt (1961) Rosenblatt, F. 1961, “Principles of Neurodynamics: Perceptrons and the Theory of Brain Mechanisms” (Spartan Press, Washington)
- Sol et al. (2013) Sol, H., Zech, A., Boisson, C., et al. 2013, Astroparticle Physics, 43, 215
- Sowards-Emmerd et al. (2003) Sowards-Emmerd, D., Romani, R. W., & Michelson, P. F. 2003, ApJ, 590, 109
- Stroh & Falcone (2013) Stroh, M. C., & Falcone, A. D. 2013, ApJS, 207, 28
- Swanenburg et al. (1981) Swanenburg, B. N., Bennett, K., Bignami, G. F., et al. 1981, ApJ, 243, L69
- Takeuchi et al. (2013) Takeuchi, Y., Kataoka, J., Maeda, K., et al. 2013, ApJS, 208, 25
- Zechlin & Horns (2012) Zechlin, H.-S., & Horns, D. 2012, J. Cosmol. Astropart. Phys., 11, 50