1–4
AGN torus properties with WISE
Abstract
The Wide-field Infrared Survey Explorer (WISE) has scanned the entire sky with unprecedented sensitivity in four infrared bands, at 3.4, 4.6, 12, and 22. The WISE Point Source Catalog contains more than 560 million objects, among them hundreds of thousands of galaxies with Active Nuclei (AGN). While type 1 AGN, owing to their bright and unobscured nature, are easy to detect and constitute a rather complete and unbiased sample, their type 2 counterparts, postulated by AGN unification, are not as straightforward to identify. Matching the WISE catalog with known QSOs in the Sloan Digital Sky Survey we confirm previous identification of the type 1 locus in the WISE color space. Using a very large database of the popular Clumpy torus models, we find the colors of the putative type 2 counterparts, and also, for the first time, predict their number vs. flux relation that can be expected to be observed in any given WISE color range. This will allow us to put statistically very significant constraints on the torus parameters. Our results are a successful test of the AGN unification scheme.
keywords:
radiative transfer, galaxies : active, galaxies: Seyfert, infrared: galaxies, catalogs, methods : data analysis, methods : statistical1 Introduction
AGN unification postulates that the average make-up of type 1 and type 2 AGN populations is intrinsically identical. The central engine of AGN is a hot accretion disk, with gas spiraling down towards a supermassive black hole. Some distance away it is surrounded by a dusty structure, geometrically and optically thick, and concentrated toward the equatorial plane of the system. This axisymmetric “torus” provides open lines of sight towards the nucleus along polar directions, but simultaneously blocks the view in edge-on directions. It gives rise to the type 1/type 2 dichotomy found in observations: there are AGN with both broad and narrow emission lines (type 1) in their spectra, and those with only narrow lines (type 2). In the latter, the view of the gas clouds in the Broad Line Region is simply blocked by the torus. Of course, broad line photons emitted in axial directions and then scattered off-axis led to their discovery in the polarized light from type-2 AGN (Antonucci & Miller, 1985), ultimately inspiring the unification paradigm (Urry & Padovani, 1995).
2 CLUMPY torus models
Krolik & Begelman (1988) discussed very early severe dynamical problems in sustaining the torus scale height, derived from type 1/type 2 number statistics, if the dust were smoothly distributed. The problem could be remedied if the dust were contained in optically thick clouds instead, shielding itself from the energetic AGN radiation. Most early models of AGN torus emission employed smooth-density tori (e.g., Granato & Danese, 1994; Efstathiou & Rowan-Robinson, 1995; Gratadour et al., 2003). With few exceptions (e.g., Fritz et al., 2006) they predicted spectral features incompatible with later observations, among them the lack of deep silicate absorption features (e.g., Hao et al., 2007; Wu et al., 2009), and the discovery of silicate emission in type 2s (Mason et al., 2009; Nikutta et al., 2009).
Today, VLTI observations in the mid-IR and X-ray variability studies strongly support the clumpy regime (e.g., Jaffe et al., 2004; Poncelet et al., 2006; Tristram et al., 2007; Raban et al., 2009; Risaliti et al., 2002; Rivers et al., 2011; Markowitz et al., 2013; Nikutta et al., 2014a). The development of dust radiative transfer in clumpy media (Nenkova et al., 2002, 2008a, 2008b; Hönig et al., 2006; Schartmann et al., 2008; Stalevski et al., 2012) reconciled theory and observations, although some problems remain (Elitzur & Shlosman, 2006). Our Clumpy formalism (Nenkova et al., 2002, 2008a, 2008b) was the first self-consistent clumpy torus model. Exploiting IR scaling relations (Ivezić & Elitzur, 1997), we are able to provide a large set of comprehensive model SEDs for the community111http://www.pa.uky.edu/clumpy/; they are being used extensively in SED fitting (e.g., Asensio Ramos & Ramos Almeida, 2009; Alonso-Herrero et al., 2011; Deo et al., 2011; Malmrose et al., 2011; Mason et al., 2013).
3 AGN in the WISE catalog
Clumpy SEDs have been computed for a very large parameter volume. Each possible combination of parameter values yields a different SED. In the observational domain, however, samples of AGN detected in the IR were rather small. It is only with the arrival of WISE (Wright et al., 2010), and the release of its vast point source catalog222http://wise2.ipac.caltech.edu/docs/release/allsky/, that the IR colors of many more AGN are available. Despite WISE’s rather low angular resolution it can be expected that the NIR/MIR fluxes of AGN are dominated by the nuclear dust emission, especially in type-1 QSOs. WISE scanned the entire sky with great sensitivity in four bands. A photometric color between two bands, say 1 and 2, is simply the magnitude difference recorded between these two bands, i.e. . Since the actual measurements are fluxes, the color is also , where for the WISE catalog the are the fluxes calibrated in the Vega photometric system.
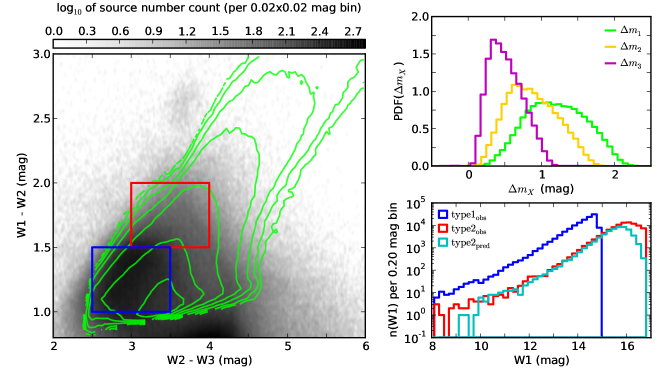
The left panel of Figure 1, from the forthcoming Nikutta et al. (2014c), shows the distribution of all WISE sources with significant IR excess in the vs. color-color (CC) diagram. The logarithmic gray scale corresponds to the number of sources per mag color bin. All sources satisfy detection limits. Except for the smallest colors at the bottom of the panel (local IR-luminous sources reside there, such as Young Stellar Objects), this CC diagram is dominated by extragalactic sources. Yan et al. (2013) have previously identified the locus of type 1 QSOs in this color-color space. Cross-checking with QSOs in the Sloan Digital Sky Survey (SDSS), we confirm this locus, and outline it roughly with the blue rectangle in Fig. 1. This box is dominated by unobscured type 1 QSOs, and contains sources. The distribution of their W1 magnitudes is shown as a blue histogram in the lower right panel. The cut-off at faint magnitudes is caused by the WISE detection sensitivity.
4 Testing AGN unification
A given type 1 AGN, if it could be rotated to a type 2 perspective, would not only change its optical type, but also its IR appearance. Observed with WISE, it would register dimmer in all bands, and redder in all colors. This putative type 2 counterpart would be more difficult to detect, as it might become too faint in one of WISE’s bands and simply drop out from the sample. We can expect that the sub-sample of type 2 counterparts, drawn from the same overall AGN population as type 1s, will distribute in regions of the CC diagram that are redder than the QSO locus. Where exactly though, we can not know purely from observations, because each individual type 2 counterpart will have different internal properties, leading to varying amounts of dimming in each band, and thus to different color shifts. Although we can expect a typical color shift when switching from type 1 to type 2 viewing, we have no observational handle on the dimming per band that caused such color shifts.
One possible location of type 2 counterparts is marked with a red box in Fig. 1. The red histogram n(W1) shows their magnitude distribution in the lower right panel. For all putative counterparts that fall within the red box, we know the average color shift, but not the magnitude dimming that is required per WISE band. This missing knowledge can be provided by the Clumpy models. The green contour lines in the left panel show the number density of all Clumpy models that offer some viewings with colors in the blue box, i.e. type 1-compatible colors. Note that all viewings to such models contribute to the density contours (i.e. type 1s and their type 2 counterpart viewings!). This is the “model sample”.
To estimate the amount of dimming per WISE band required for an overall color shift from the blue to a red box, we pick from the model sample those models that also have some viewings with colors in the red box. For each selected model we then average their type 1-viewing magnitudes and their type 2-viewing magnitudes separately, and the difference between these averages is the dimming (determined separately per WISE band). We repeat this procedure for every qualifying model. The distributions of dimmings obtained in this fashion are shown in the upper right panel of Fig. 1, for WISE bands 1, 2, 3 (in green, orange, and magenta, respectively).
This final step in testing unification is to apply the model-based dimming in each band to every observed QSO source. To this end we randomly draw correlated dimmings from the distributions of dimming magnitudes, for every source from the blue box. After dimming the source by the obtained dimming magnitudes we determine if it survives the WISE faint limits (per band), and discard it otherwise. The distribution of surviving dimmed type 1 sources is shown as a cyan histogram in the lower right panel. The agreement with the red histogram (observed putative type 2 sources) is striking. Note that the cyan histogram is the predicted absolute number of type 2 AGN to be observed with a survey of given sensitivity.
Repeating this algorithm on all other potential type 2 regions in the color space (red boxes) will identify the area in the color space that harbors the population of type 2 counterparts. Then, knowing this area’s extent in color space we will be able to constrain the permitted values of AGN torus parameters – based on a sample of objects! We will report all results in greater detail in Nikutta et al. (2014b, c).
References
- Alonso-Herrero et al. (2011) Alonso-Herrero, A., et al. 2011, ApJ, 736, 82
- Antonucci & Miller (1985) Antonucci, R. R. J., & Miller, J. S. 1985, ApJ, 297, 621
- Asensio Ramos & Ramos Almeida (2009) Asensio Ramos, A., & Ramos Almeida, C. 2009, ApJ, 696, 2075
- Deo et al. (2011) Deo, R. P., et al. 2011, ApJ, 729, 108
- Efstathiou & Rowan-Robinson (1995) Efstathiou, A., & Rowan-Robinson, M. 1995, MNRAS, 273, 649
- Elitzur & Shlosman (2006) Elitzur, M., & Shlosman, I. 2006, ApJ, 648, L101
- Fritz et al. (2006) Fritz, J., Franceschini, A., & Hatziminaoglou, E. 2006, MNRAS, 366, 767
- Granato & Danese (1994) Granato, G. L., & Danese, L. 1994, MNRAS, 268, 235
- Gratadour et al. (2003) Gratadour, D., et al. 2003, A&A, 411, 335
- Hao et al. (2007) Hao, L., et al. 2007, ApJ, 655, L77
- Hönig et al. (2006) Hönig, S. F., et al. 2006, A&A, 452, 459
- Ivezić & Elitzur (1997) Ivezić, Ž., & Elitzur, M. 1997, MNRAS, 287, 799
- Jaffe et al. (2004) Jaffe, W., et al. 2004, Nature, 429, 47
- Krolik & Begelman (1988) Krolik, J. H., & Begelman, M. C. 1988, ApJ, 329, 702
- Malmrose et al. (2011) Malmrose, M. P., et al. 2011, ApJ, 732, 116
- Markowitz et al. (2013) Markowitz, A., Krumpe, M., & Nikutta, R. 2013, MNRAS, subm.
- Mason et al. (2009) Mason, R. E., et al. 2009, ApJ, 693, L136
- Mason et al. (2013) —. 2013, ApJ, 777, 164
- Nenkova et al. (2002) Nenkova, M., Ivezić, Ž., & Elitzur, M. 2002, ApJ, 570, L9
- Nenkova et al. (2008a) Nenkova, M., et al. 2008a, ApJ, 685, 147
- Nenkova et al. (2008b) —. 2008b, ApJ, 685, 160
- Nikutta et al. (2009) Nikutta, R., Elitzur, M., & Lacy, M. 2009, ApJ, 707, 1550
- Nikutta et al. (2014a) Nikutta, R., Krumpe, M., & Markowitz, A. 2014a, MNRAS, in prep.
- Nikutta et al. (2014b) Nikutta, R., et al. 2014b, MNRAS, submitted
- Nikutta et al. (2014c) —. 2014c, MNRAS, to be submitted
- Poncelet et al. (2006) Poncelet, A., Perrin, G., & Sol, H. 2006, A&A, 450, 483
- Raban et al. (2009) Raban, D., et al. 2009, MNRAS, 394, 1325
- Risaliti et al. (2002) Risaliti, G., Elvis, M., & Nicastro, F. 2002, ApJ, 571, 234
- Rivers et al. (2011) Rivers, E., Markowitz, A., & Rothschild, R. 2011, ApJ, 742, L29
- Schartmann et al. (2008) Schartmann, M., et al. 2008, A&A, 482, 67
- Stalevski et al. (2012) Stalevski, M., et al. 2012, MNRAS, 420, 2756
- Tristram et al. (2007) Tristram, K. R. W., et al. 2007, A&A, 474, 837
- Urry & Padovani (1995) Urry, C. M., & Padovani, P. 1995, PASP, 107, 803
- Wright et al. (2010) Wright, E. L., et al. 2010, AJ, 140, 1868
- Wu et al. (2009) Wu, Y., et al. 2009, ApJ, 701, 658
- Yan et al. (2013) Yan, L., et al. 2013, AJ, 145, 55