X-ray observations of VY Scl type nova-like binaries in the high and low state
Abstract
Four VY Scl-type nova-like systems were observed in X-rays both during the low and the high optical states. They are BZ Cam, MV Lyr, TT Ari, and V794 Aql. Using archival ROSAT, Swift and SUZAKU observations we found that the X-ray flux for BZ Cam is higher during the low state, but there is no supersoft X-ray source (SSS) that would indicate the thermonuclear burning predicted in a previous article. The X-ray flux is lower by a factor 2-10 in the low than the high state in other systems, and does not reflect the drop in inferred from optical and UV data. The best fit model for the X-ray spectra is a collisionally ionized plasma model. The X-ray flux may originate in a shocked wind or in accretion onto polar caps in intermediate polar systems that continues even during the low state.
Keywords: Cataclysmic variables - Dwarf novae - X-rays.
1 Introduction
Nova-like (NLs) stars are non-eruptive CVs (Warner, 1995), classified into several subtypes according to their properties. Here we will focus on the VY Scl-type NLs or “anti-dwarf novae” characterized by the presence of occasional dips on the light curve, so-called low states.
The large optical and UV luminosity has suggested that in the high state these objects are undergoing mass transfer onto the WD at a high rate , M⊙ year-1, sustaining an accretion disk in a stable hot state and preventing dwarf novae (DNe) outbursts. The low states have been attributed to a sudden drop of the from the secondary, or even to a total cessation of a mass transfer (Hessman, 2000).
Greiner et al. (1999) proposed a link between the VY Scl-type stars and super soft X-ray sources based on a ROSAT observations of V751 Cyg. These authors found an anti-correlation in the optical and X-ray intensity, and despite the very poor spectral resolution of the ROSAT HRI, the spectrum appeared to be very soft in the low state. These authors suggested that quasi-stable thermonuclear burning occurs on the surface of the WD in the low state. In this framework, VY Scl-type stars are key objects in the evolution of interacting WD binaries, in which hydrogen burning occurs periodically without outbursts. Thus they may reach the Chandrasekhar mass and the conditions for type Ia supernovae explosion.
Using archival X-ray observations, in this paper we compare the high and low state X-ray data of 4 VY Scl-type stars attempting to reveal evidence of nuclear burning during the low state, or seeking alternative explanations for the changes that take place during the transition from the high to low state.
2 Observation and Data analysis
We examined the archival X-ray data of VY Scl-type stars obtained with Swift, ROSAT and SUZAKU and chose the objects that were observed both in the high and low states: BZ Cam, MV Lyr, TT Ari and V794 Aql. To determine when the low and high optical states occurred, we relied on the data of the Variable Star Network (VSNET) Collaboration (Kato et al., 2004), AAVSO 111 http://www.aavso.org and ASAS databases. We used HEASOFT Version 6-13 to analyze the data and XSPEC version 12.8.0 for spectral modeling. We also estimated the UV magnitudes of the objects using both Swift/UVOT and additional GALEX archival observations.
3 Results
In Figure 1 we show the high and low state X-ray spectra of BZ Cam, MV Lyr, TT Ari and V794 Aql and the fits to these spectra. The fit parameters are summarized in Table 1 and 2.
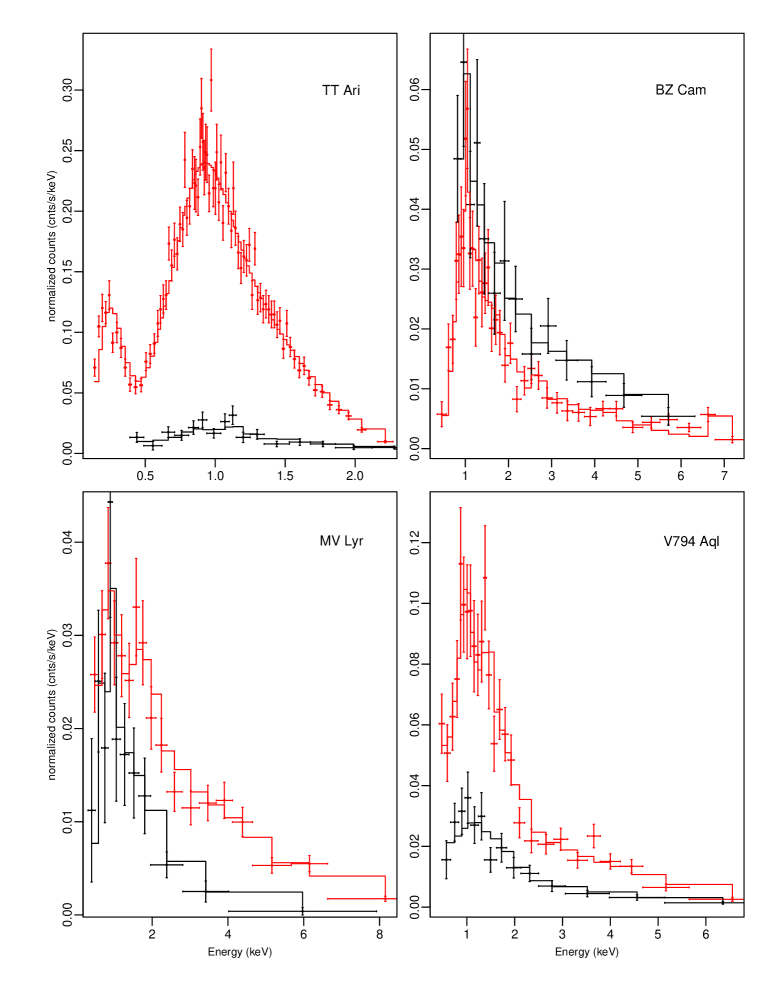
TT Arietis (top left panel) is one of the most optically luminous CVs, usually at mag 10-11. Sometimes it abruptly falls into an “intermediate state” around 14 mag. or even into a “low state” at about 16.5 mag. According to Belyakov et al. (2010), this binary system consists of a 0.57-1.2 M⊙ white dwarf and a 0.18-0.38 M⊙ secondary component. The orbital period is d. (Thorstensen, Smak & Hessman, 1985). The high state X-ray flux appeared to be about twice larger than in the low state. We fitted the high state spectrum with a two components thermal plasma model (APEC model – emission spectrum from collisionally ionized diffuse gas calculated using the ATOMDB code v2.0.1), and also with one component black body model. The low state spectrum is also well fitted with a 2 components thermal plasma model.
BZ Cam is a NL star at a distance (Ringwald&Naylor, 1998) with an orbital period of 0.153693(7) d. (Patterson et al., 1998). Most of the time it shows brightness variations around V = 12 - 13 mag., with rare occasional transitions to the 14 - 14.5 mag. low states. BZ Cam is surrounded by a bright emission nebula with a bow-shock structure. Hollis (1992) proposed that the bow shock structure must be due to the interactions of wind from BZ Cam with the interstellar medium. Greiner et al. (2001) suggested that this nebula is photoionized by a bright central object that must be a super soft X-ray source, while the bow shock structure is due to the high proper motion of BZ Cam.
From the second plot of Fig. 1 it can be seen that the luminosity is higher in the low state, however, in the very soft spectral region, at energy 0.5 keV, the X-ray flux is almost twice higher in the high state, which is exactly the opposite of the idea proposed by Greiner et al (1999). Interestingly, the spectral fits in both states indicate that we may be observing a strong Ne X Lyman line at 1.02 keV.
We fit the low state spectrum of BZ Cam, with a two-component APEC model. The high state of BZ Cam is best fitted with a one component Raymond-Smith model of hot, diffuse gas or with a two components APEC model. In this fit we found an underabundance (with respect to solar values) of C and N and and an overabundance of O, Ne, and intermediate mass elements like S and Ca.
![[Uncaptioned image]](/html/1312.5122/assets/x2.png)
The UV magnitudes of BZ Cam in the high and low states indicate a smaller variation than observed in the other objects (albeit in different UV filters). This is explained by Figure 2 in which we show the UV image of the nebula obtained with Swift/UVOT observations. Obviously the ionized nebula also emits copious UV flux. Comparing the image of BZ Cam in Figure 2 and the one, presented in the Figure 4 in (Greiner et al., 2001), one can see an additional prominent feature of the nebula in the former image. In UV there is a bright ring in the bottom-left side of the BZ Cam nebula that was absent in O III and Hα in September 2000.
MV Lyr is at about 12th-13th mag in the high state and 16th-18th mag in the low state. Hoard et al. (2004) have shown that the distance to the object is pc. With their FUSE (Far Ultraviolet Spectroscopic Explorer) observations these authors estimated an upper limit to during the low state . The orbital period of this system is 3.19 h (Skillman, Patterson & Thorstensen, 1995).
Our data show that the high state X-ray flux of MV Lyr is higher by an order of magnitude than in the low state. The spectrum is also harder with additional component prominent above 1.7 keV. We fitted the high state spectrum of MV Lyr with a two components thermal plasma model, A good fit is also obtained with a thermal plasma and a power law model. The low state spectrum was also fitted with a two components plasma model (see Table 1).
| BZ Cam | MV Lyr | |||||
| high state | low state | high state | low state | |||
| Satellite | Swift | Swift | Swift | Swift | ||
| Models | Raymond-Smith | apec+apec | apec+apec | apec+plow | apec+apec | apec+apec |
| N(H)() | - | |||||
| Photon Index | - | - | ||||
| T1 (keV) | ||||||
| T2 (keV) | - | - | ||||
| Fluxabs () | ||||||
| Fluxunabs () | ||||||
| 1.444 | 1.115 | 1.004 | 1.05 | 0.924 | - | |
V794 Aql varies between 14th and 15th magnitude in the high optical state, and in the low states it can plunge to 18th-20th mag. The orbital period is (Honeycutt&Schlegel, 1985). Godon et al (2007) derived the following binary system parameters: , high state , inclination , and distance to the system d = 690 pc. We fitted the high state spectrum of V794 Aql with two APEC components (see Table 2). In both components we need high abundance of Mg and Ni and underabundant He, S and Fe.
| TT Ari | V794 Aql | |||||
| high state | low state | high state | low state | |||
| Satellite | ROSAT | Swift | Swift | Swift | ||
| Models | Black body | Raymond+apec | Raymond+apec | apec | vapec+vapec | apec |
| N(H)() | ||||||
| T1 (keV) | ||||||
| T2 (keV) | - | - | - | |||
| Fluxabs () | ||||||
| Fluxunabs() | ||||||
| 1.64 | 0.924 | 1.069 | 1.219 | 1.011 | 0.6 | |
4 Discussion and Conclusions
The first conclusion that can be derived from the presented spectra is that in all the objects both in high and low states there is no evidence of the thermonuclear burning on the surface of WD. An important motivation for this research has been the claim by Greiner (1998) and Greiner et al. (2001) that some of the WD in VY Scl-type stars must be burning hydrogen quietly in the low state, without ever triggering thermonuclear flashes because of the short duration of the burning. We find that the predicted supersoft X-ray source (manifestation of the thermonuclear burning) does not appear in the low states. We also find another unexpected result, namely that the X-ray luminosity does not follow the optical/UV drop. Assuming that half of the gravitational energy of the matter accreted from the secondary is released in the boundary layer through the X-ray emission and using the following formula from Patterson & Raymond (1985):
| (1) |
In one case, BZ Cam, the X-ray luminosity increases in the low state, and in the others, the decrease in X-ray flux in the low state is smaller than that in the optical and UV. The X-ray flux varies much less than the optical flux, by a factor of 2 to 10 during the transition from high to low state.
The best-fit model for the 0.3-10.0 keV broad band spectra is two-component absorbed thermal plasma model. We do not find evidence of a boundary layer of the accretion disk emitting in the X-ray range. Probably the emission is mainly in the far UV (e.g Godon et al., 2007). It appears likely that some, or all the X-ray flux is produced in a wind from the system: an ongoing fast wind may be the cause of the extended BZ Cam nebula, initially classified as a planetary nebula. However, TT Ari which has a 17 minutes semi-period semi-regular variability, which can be understood in the context of accretion, but is not explained by a wind.
The X-ray flux may also be due to a different, and coexistent mode of accretion other than the disk, i.e. a magnetically driven stream to the polar caps of an intermediate polar. The X-rays and optical flux variations anticorrelate only in BZ Cam, which may be due to a wind causing additional absorption and obscuring the luminous disk. A second explanation for the lack of correlation of UV/optical versus X-ray flux variations, involving magnetic accretion, appears more plausible at least for three of the systems. The scenario we suggest is that the stream to the polar caps still continues, at decreased rate, when the accretion disks ceases to exist.
References
- [1] Belyakov K. V., Suleimanov V. F., Nikolaeva E. A., Borisov N. V., 2010, in Werner K., Rauch T., eds, American Institute of Physics Conference Series Vol. 1273 of American Institute of Physics Conference Series, p. 342–345.
- [2] Greiner J., 1998, A&A, 336, 626
- [3] Greiner J., Tovmassian G., Orio M., Lehmann H., Chavushyan V., Rau A., Schwarz R., Casalegno R., Scholz R., 2001, A&A, 376, 1031
- [4] Greiner J., Tovmassian G. H., di Stefano R., Prestwich A., González-Riestra R., Szentasko L., Chavarría C., 1999, A&A, 343, 183
- [5] Godon P., Sion E. M., Barrett P., Szkody P., 2007, ApJ, 656, 1092
- [6] Hessman F. V., 2000, New Astronomy Reviews, 44, 155
- [7] Hoard D. W., Linnell A. P., Szkody P., Fried R. E., Sion E. M., Hubeny I., Wolfe M. A., 2004, ApJ, 604, 346
- [8] Hollis J. M., Oliversen R. J., Wagner R. M., Feibelman W. A., 1992, ApJ, 393, 217
- [9] Honeycutt R. K., Robertson J. W., 1998, Astronomical Journal, 116, 1961
- [10] Honeycutt R. K., Schlegel E. M., 1985, PASP, 97, 1189
- [11] Kato T., Uemura M., Ishioka R., Nogami D., Kunjaya C., Baba H., Yamaoka H., 2004, PASJ, 56, S1
- [12] Patterson J., Raymond J. C., 1985, ApJ, 292, 535
- [13] Patterson J., Patino R., Thorstensen J. R., Harvey D., Skillman D. R., Ringwald F. A., 1996, Astronomical Journal, 111, 2422
- [14] Ringwald F. A., Naylor T., 1998, Astronomical Journal, 115, 286
- [15] Skillman D. R., Patterson J., Thorstensen J. R., 1995, PASP, 107, 545
- [16] Thorstensen J. R., Smak J., Hessman F. V., 1985, PASP, 97, 437
- [17] Warner B., 1995, Cataclysmic Variable Stars (Cambridge: Cambridge University Press).
DISCUSSION
DMITRY BISIKALO: Could you estimate the impact of bow shock to observed X-ray flux?
POLINA ZEMKO: The BZ Cam image in H (Figure 4 of Greiner et al., 2001) shows two distinct bright features in the bow shock front, one at 12 arcsec, the other at 40-45 arcsec from the central source. Nevertheless, the PSF of the source in X-ray image obtained with Swift is quite symmetric and typical of a point source. So even with the modest spatial resolution of Swift we can rule out that the bow shock contributes significantly to the X-ray flux.