Non-linear effects in electron cyclotron current drive applied for the stabilization of neoclassical tearing modes
Abstract
Due to the smallness of the volumes associated with the flux surfaces around the O-point of a magnetic island, the electron cyclotron power density applied inside the island for the stabilization of neoclassical tearing modes (NTMs) can exceed the threshold for non-linear effects as derived previously by Harvey et al, Phys. Rev. Lett. 62 (1989) 426. We study the non-linear electron cyclotron current drive (ECCD) efficiency through bounce-averaged, quasi-linear Fokker-Planck calculations in the magnetic geometry as created by the islands. The calculations are performed for the parameters of a typical NTM stabilization experiment on ASDEX Upgrade. A particular feature of these experiments is that the rays of the EC wave beam propagate tangential to the flux surfaces in the power deposition region. The calculations show significant non-linear effects on the ECCD efficiency, when the ECCD power is increased from its experimental value of 1 MW to a larger value of 4 MW. The nonlinear effects are largest in case of locked islands or when the magnetic island rotation period is longer than the collisional time scale. The non-linear effects result in an overall reduction of the current drive efficiency for this case with absorption of the EC power on the low field side of the electron cyclotron resonance layer. As a consequence of the non-linear effects, also the stabilizing effect of the ECCD on the island is reduced from linear expectations.
I Introduction
Electron cyclotron current drive (ECCD) is used for suppression of neoclassical tearing modes (NTMs) because they limit the performance of tokamak fusion reactors and may lead to plasma disruptions lahaye_2006 , Kislov , westerhof_NF , Classen , zohm , Gantenbein , Isayama , lahaye_2002 , petty , lahaye_2006NF , maraschek , isayama_2009 . A theoretical model for the interpretation of current experiments and extrapolation of their results to future fusion reactors is provided by the generalized Rutherford equation rutherford1 , rutherford2 . This equation describes the time evolution of the full width of the magnetic island associated with an NTM. It consists of several terms expressing different stabilizing and destabilizing mechanisms. The term accounting for the contribution of the ECCD to the NTM evolution is denoted as . It is proportional to the two dimensional integral over the cross section of the island of that fourier component of the EC driven current density that corresponds to the helicity of the island. In the calculation of , the EC power deposition profile and driven current density profile are often averaged over one island rotation period . The driven current density is related to the power deposition through the ECCD efficiency , which is generally obtained in the linear regime where the ECCD efficiency is power independent. This neglects any temporal variation as a consequence of rotation of the island through the EC power deposition region as well as possible nonlinearities in the ECCD efficiency at high power densities due to modifications of the electron distribution function as a consequence of EC driven quasi-linear velocity space diffusion harvey , prater .
In a previous study we analyzed the consequences of removing the averaging over the island rotation period ayten . It was shown that for rotation periods of the order of, or longer than the electron collision time, the EC driven current density profile moves through the island with the rotation period. Consequently, also exhibits a significant oscillation with the rotation period. This study still relied on the assumption of a linear ECCD efficiency, which implies that for a constant island width the resultant averaged over one rotation period exactly equals the value that is obtained in case of the rotation averaged current density profile. In that case, the oscillations in lead to significant changes of the stabilizing effect of ECCD only when the island width changes significantly during a rotation period.
In the present study we analyze the assumption of a linear ECCD efficiency: under which conditions does the ECCD efficiency become nonlinear and what are the consequences of a non-linear ECCD efficiency. It has been shown by Harvey et al. harvey that non-linear effects appear when the ratio of the absorbed power density over the square of the electron density exceeds a certain threshold:
| (1) |
where we have introduced the non-linearity parameter . In the non-linear regime the ECCD efficiency is shown to become power dependent: at a given plasma radius the ECCD efficiency increases above linear values for absorption of the EC power on the low field side of the electron cyclotron resonance layer whereas it decreases and even passes through zero for absorption on the high field side of the resonance. In a tokamak the absorbed power density is obtained as a function of the magnetic surfaces. A magnetic island changes the topology of these magnetic surfaces dramatically. Introducing as the helical flux function which determines the magnetic surfaces in the presence of a magnetic island, defines the total power absorbed inside the flux surface labeled with . The local power density defined as is then seen to become large when either becomes small which is the case for flux surfaces near the O-point of the island isliker , or when itself becomes large. The latter occurs as a consequence of flux expansion in the case of deposition near the X-point of the island. As a result, the non-linear threshold can be exceeded at lower levels of injected power in the presence of a magnetic island than in the unperturbed magnetic equilibrium isliker .
We calculate the non-linear ECCD efficiency through bounce-averaged, quasi-linear Fokker-Planck code calculations in a realistic magnetic geometry with a locked or rotating magnetic island. In this study we restrict ourselves to the case of CW application of the ECCD. The unperturbed plasma equilibrium is taken in accordance with ASDEX Upgrade discharge nr. which features a 3/2 NTM reich . While locked 3/2 modes are rare in present day experiments, ECCD control of 2/1 locked modes has been reported in Refs. volpe2009 , esposito . This paper is organized as follows: Section gives the theoretical framework briefly describing the EC ray-tracing and Fokker-Planck codes used. It also includes a description of the flux surfaces in presence of a magnetic island. Power deposition and current drive in the unperturbed equilibrium are analyzed in Section . This serves as a cross code benchmark in the linear regime and provides a basic understanding of the behavior in the nonlinear regime. The results of non-linear effects in the presence of a magnetic island are presented in Section for the case of a locked island, and in Section for the case of a rotating island. This is followed in Section by a study of their consequences on the magnetic island evolution. Finally, a summary and conclusions are provided in Section .
II Theoretical framework
II.1 Numerical codes
In this study we use the TORAY ray tracing code Kritz , westerhof_toray in combination with the RELAX bounce-averaged, quasi-linear Fokker-Planck code westerhof_relax . TORAY applies the cold plasma, Appleton-Hartree dispersion relation to calculate the trajectories of a number of rays. The power absorption along each ray is calculated by the (weakly) relativistic warm plasma dispersion relation. The driven current density is obtained through a linear, adjoint calculation of the current drive efficiency. This employs the subroutines developed by Lin-Liu lin-liu extended with the current response function as derived by Marushchenko marushchenko , marushchenko_comment for a momentum conserving electron-electron collision operator. The information on the ray trajectories is passed to the Fokker-Planck code RELAX. A detailed description of the information transferred from TORAY to RELAX is provided in the Appendix.
The RELAX code solves the bounce-averaged quasi-linear Fokker-Planck equation in toroidal geometry on a finite number of flux surfaces providing an appropriate coverage of the power deposition region. Including only the terms used in the present research this equation is written as Killeen :
| (2) |
where represents the gyro- and bounce-phase independent electron distribution function. RELAX solves Eq. 2 in terms of the low-field-side (lfs) momentum and pitch angle , where represents the component parallel to the magnetic field. The bounce averaging is defined as
| (3) |
where is the element of the arc length along the magnetic field line associated with the gyro-center motion and the particle velocity. The bounce period is given by
| (4) |
The first term on the right-hand side of Eq. (2), , is the collision term representing the rate of change in the electron momentum distribution as a result of collisions with species . In the present research the electron collision operator is approximated by a truncated linearized collision operator Karney . It is composed of three parts, one representing the effect of the collisions off a background Maxwellian population on the electron distribution function and the other one ensuring the conservation of momentum in electron-electron collisions, that is essential for an accurate calculation of the driven current density. The electron-ion collisions are taken to contribute only to the the pitch angle scattering term in the high velocity limit. They are characterized by an effective charge of the ions, .
The second term on the right-hand side of Eq. 2 accounts for the quasi-linear diffusion driven by the EC waves. As the diffusion driven by the EC waves generally occurs in the direction of the perpendicular momentum prater , its corresponding diffusion operator is conveniently written in terms of the diffusion of the invariant magnetic moment where is the electron mass. The diffusion coefficient of the magnetic moment, is given by westerhof_relax , Peeters
| (5) |
where is the EC wave frequency, the electron cyclotron frequency, the harmonic number, the relativistic factor, the parallel refractive index, the normalized parallel momentum, the parallel velocity of the particle, the major radius, and the poloidal component of the magnetic field. The factor , where
| (6) |
accounts for the effect of wave polarization. The wave polarization vector is normalized such that its amplitude and in a frame where the magnetic field is along the -coordinate and the perpendicular wave vector along the -coordinate. is the Bessel function of the first kind of (integer) order and its argument where represents the magnitude of the perpendicular wave vector and the Larmor radius of the electrons. The next term defines the broadened resonance condition with the total resonance broadening given by
| (7) |
where refers to the toroidal velocity. The first two terms denote the broadening as a consequence of the variation in magnetic field and parallel refractive index over the beam in poloidal and toroidal directions, respectively. The beam power profile is assumed to be Gaussian in both the poloidal and toroidal directions with widths of and , respectively. The first two terms of Eq. 7 can be obtained from a bounce-averaging of the local delta function resonance giruzzi . The last term describes the resonance broadening owing to the finite wave-particle interaction time during a beam crossing. The term accounts for the total wave power crossing the flux surface weighted by the factor , where is the power flux for a normalized electric field vector and the angle between the direction of wave propagation and the normal of the flux surface. The factor where is the optical depth ( represents the imaginary part of wave vector), refers to the power fraction absorbed so far along the beam trajectory . The term is a division by the effective flux surface area.
II.2 Plasma equilibrium and magnetic topology
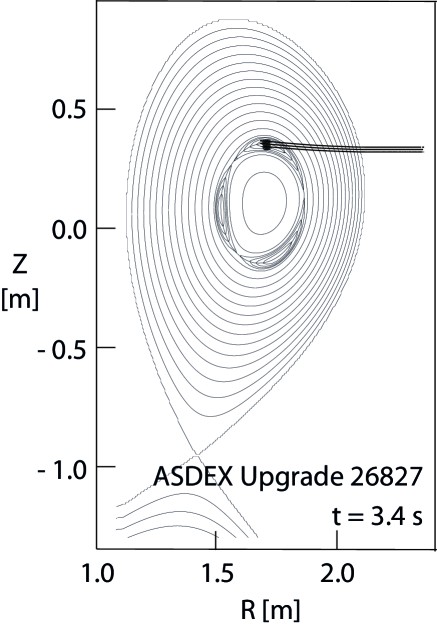
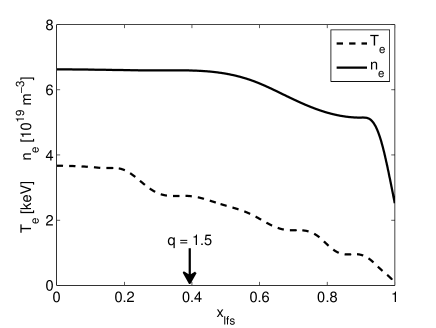
As the basis of our study we use a typical discharge from ASDEX Upgrade in which ECCD has been used to suppress an NTM with poloidal and toroidal mode numbers , and , respectively reich . Figure 1 shows the experimental equilibrium for ASDEX Upgrade discharge nr. 26827 ( T, MA, keV, m-3) at s around the time that the ECCD is applied. Figure 2 shows the density and temperature profiles at this time as obtained from the IDA Integrated Data Analysis diagnostic of ASDEX Upgrade. These profiles are shown as a function of the normalized minor radius in the low field side mid plane, . For the calculations of the current drive efficiency in both TORAY and RELAX, the effective charge of the ions has been taken to be .
NTMs perturb the equilibrium magnetic field topology: in the case of a single helicity perturbation with poloidal mode number and toroidal mode number , the unperturbed equilibrium topology of closed nested surfaces of constant poloidal flux is replaced by a topology including a single chain of magnetic islands around the surface with the resonant safety factor . This perturbed flux surface topology is represented by the surfaces of constant helical flux. The unperturbed helical flux function is obtained from the experimental equilibrium. The topology in the presence of a magnetic island is then obtained by superimposing a helical flux perturbation as Yang
| (8) |
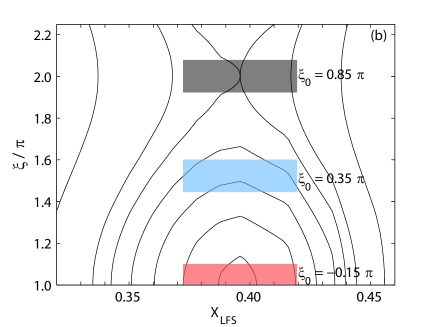
which provides a realistic approximation to the radial dependence of the tearing perturbation. In particular, this equation describes a magnetic island which has a significantly asymmetric width on opposite sides of the resonant surface , consistent with experimental observations. We have introduced here the coordinate as a flux surface label of the unperturbed equilibrium: , where refers to the surface area enclosed by the surface with helical flux and indicates the position relative to the resonant surface with for and for . In Eq. 8, is the value of at the edge of the plasma, the straight field line poloidal angle, the toroidal angle, and the phase of the island with meaning that the X-point is on the lfs mid-plane at . The perturbation amplitude at the resonant surface is adjusted to obtain a specific island size. Throughout the paper island sizes will be given in terms of their full width (i.e. the maximum distance between their separatrices) as measured on the low field side mid plane. Note that the origin of the toroidal angle is chosen to coincide with the position of the ECCD launching mirrors. As a result deposition on the O-point of the island is obtained in case of an island phase (see Fig. (1)).
The perturbation in the equilibrium temperature and density profiles as a result of the presence of an island are taken into account in TORAY. It is noted, however, that over the parameter range studied their effect on the wave propagation was very small. We assume that temperature and density are constant on the magnetic flux surfaces defined by the perturbed helical flux and . The radial transport outside the island is assumed to be unaffected, therefore we relate the temperature at outside the island to the unperturbed equilibrium temperature ashugovdbrand :
at position where and
| (9) |
where is the helical flux at the separatrices and the area in the poloidal cross section that is enclosed by the flux surface defined by and . The temperature inside the island is assumed constant owing to fast parallel transport and taken to be equal to that of the outer separatrix:
at position where
| (10) |
The temperature at outside the island decreases by an amount with regard to the unperturbed equilibrium temperature profile where is the difference of the temperatures in the unperturbed equilibrium temperature profile on those surfaces enclosing the same surface area as the inner and outer separatrices, respectively:
at position where and
| (11) |
| (12) |
The perturbation in the density profile is obtained analogously. We find that over an extended region around the island, the density and temperature are almost constant and equal to m-3and keV, respectively. These values are used for their corresponding parameters in the RELAX calculations. The magnetic field perturbation arising from the presence of an island is very small compared to , and is not taken into account in TORAY or RELAX. In particular, for RELAX this means that the bounce integrals representing the effects of trapped particles are evaluated as for the unperturbed equilibrium. The full perturbed flux surface topology, however, is taken into account in the evaluation of the EC quasi-linear diffusion operator. Power deposition and driven current density profiles in both TORAY and RELAX are evaluated in the helical flux surface coordinates of the perturbed equilibrium. These profiles will be reported below in terms of their projection along the low field side mid plane in the toroidal cross section where the island O-point is in the lfs mid plane.
III ECCD in the unperturbed equilibrium
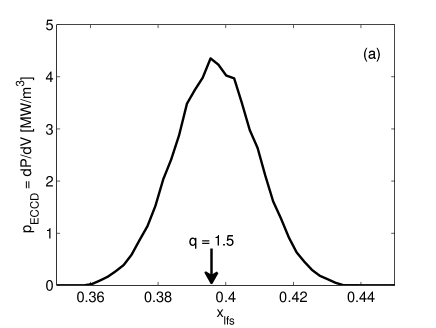
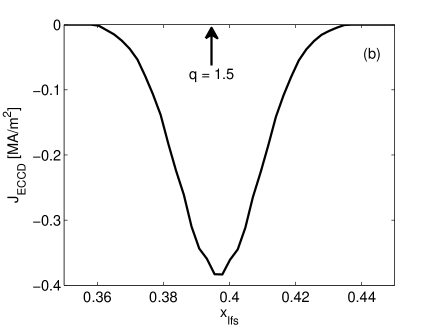
We first study ECCD in the unperturbed magnetic equilibrium. In the example studied we assume that ECCD at GHz is injected from a top mirror of ASDEX Upgrade with a toroidal injection angle of . The ECRH beam, which is focused near the region of power deposition, is modeled in the TORAY code by an appropriate set of rays with a FWHM of 1.7 cm in the vertical direction and FWHM of in the toroidal injection angle. The beam is represented by a square grid of rays with equidistant points in the poloidal direction and points in the toroidal direction covering a range of twice the Gaussian width of the beam power density. Each ray is assigned a power fraction in accordance with the Gaussian profile of the beam power density. Note that the rays propagate tangential to the flux surfaces in the power deposition region. As a result, the whole power from a single ray is absorbed over a very narrow range of flux surfaces. The power deposition and current density profiles as obtained from TORAY for the injection of a MW ECCD beam are shown in Fig. 3a and b, respectively. Both the power deposition and driven current density profiles are centered on the surface and are highly localized. The maximum absorbed power density corresponds to a nonlinearity parameter with a value of , indicating that nonlinear effects are not expected for these parameters in ASDEX Upgrade in the absence of magnetic islands.
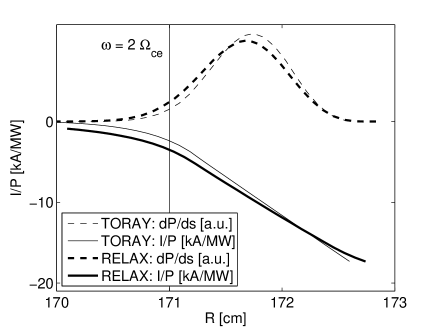
To obtain a better understanding of the absorption and current drive efficiency, we look into detail at the power absorption along a single ray in both TORAY and RELAX. The chosen ray corresponds to the central ray of the full beam. Because of the tangent propagation of the ray in the region of power deposition this also involves just a single discrete volume shell in RELAX. Figure 4 presents the power absorption ( [a.u.]) and ECCD efficiency ( [kA/MW]) along the central ray calculated with either TORAY (from a linear, adjoint calculation of the current drive efficiency accounting for momentum conservation in electron-electron collisions lin-liu , marushchenko , marushchenko_comment ) or RELAX in the case of low EC power. The results show good agrement and thus, provide a cross code benchmark between TORAY and RELAX in the low power, linear regime.
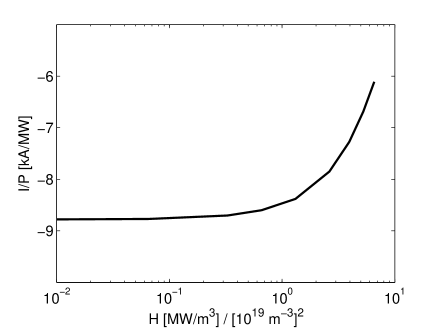
In order to study the nonlinear effects of ECCD in this case, where the ray propagates tangentially to the flux surface in the power deposition region, the RELAX calculation is repeated for increasingly higher powers injected along the ray resulting in increasing values of the nonlinearity parameter . In this non-linear regime it is no longer possible to single out the contribution from each individual segment, , of the ray to the driven current (). The results show a nonlinear reduction in the absolute value of the integrated ECCD efficiency. Here, the integrated ECCD efficiency is defined as the ratio of total driven current in the volume shell to the total absorbed power in that shell. This is demonstrated in Fig. 5, which shows the results of the single ray, single volume shell RELAX calculations as a function of the nonlinearity parameter . Note that the range in covered would include unrealistically high values of the injected power for the case of the unperturbed equilibrium. In the presence of an island, however, a value of might well be reached with the injection of about 4 MW of ECCD. Significantly higher values of would also apply in case of experiments at a lower density. The threshold for the non-linear effects where the ECCD efficiency diverts from being a constant and starts decreasing as increases, is observed to be around in accordance with the conclusions of Harvey et al. harvey . However, the decrease of the global current drive efficiency is in apparent contradiction with the results of Harvey et al. harvey which for the present conditions (absorption on the low field side of the resonance) would predict an increase in the local current drive efficiency. Note however that Harvey et al. calculated a local current drive efficiency that applies to a given point along a ray, whereas the present calculation is global and thus averages over the full absorption profile. The study of Harvey et al. also extended too much higher power density levels than the current work.
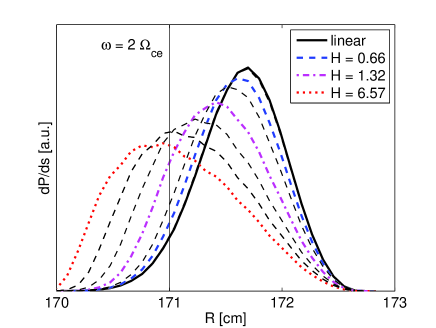
In order to explain the global decrease in the absolute value of the current drive efficiency, Figure 6 shows the power absorption normalized to the injected power (with ) along the ray for several values of the nonlinearity parameter . At higher power densities, and consequently, at higher values of the EC driven quasi-linear velocity space diffusion alters the electron distribution function. The quasi-linear flattening of the distribution function at the resonance reduces the absorption coefficient and shifts the peak in the profile to a smaller major radius R peeters1996 coming closer to the cold second harmonic EC resonance at cm. That broadens the power deposition profile along the ray with more power reaching the regions where the ECCD efficiency is lower. As a consequence, the integrated ECCD efficiency decreases. We note here that this result of a globally decreasing current drive efficiency is not specific to the present case with tangent ray propagation, but is also obtained when the beam is injected in the mid plane and the rays are propagating close to transverse to the flux surfaces. In that case, the shift in the power deposition along the ray also results in a shift in power deposition in terms of the flux surfaces. Locally on a flux surface the nonlinear current drive efficiency then shows the expected increase consistent with the results of Harvey et al. harvey . Globally, however this local increase in the efficiency is more than compensated by the lower efficiency of the wave power reaching further into the plasma and coming much closer to the cold EC resonance.
IV ECCD in the presence of a locked magnetic island
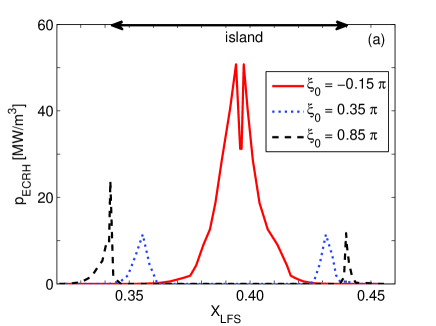
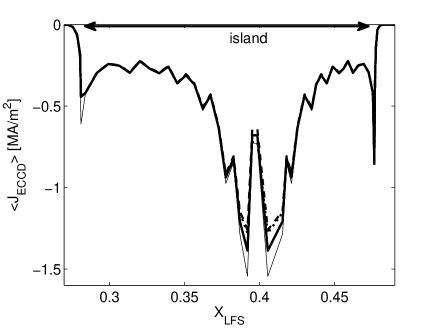
We now study ECCD in the presence of locked islands of different sizes. Figure 7 illustrates the power deposition profiles for a MW ECCD beam in the case of a cm wide island. The power deposition profile is obtained as a function of helical flux. It is plotted in terms of the normalized low field side minor radius crossed by the helical flux surface in the poloidal cross section of the plasma in which the O-point of the island is in the low field side mid-plane. The power densities inside the magnetic island are thus plotted twice: for and for . The spatial asymmetry with respect to in this part of the profile reflects the asymmetric width of the magnetic island. Also note that the deposition profile in general has a discontinuity at the separatrix. The three different profiles correspond to different phases of the island: a phase of corresponding to heating near the O-point, an intermediary case with a phase of , and a phase of corresponding to heating near the X-point. Here, the phase refers to the angle as defined in Section II.B. The peak power density and, consequently, the likelihood of non-linear effects is strongly dependent on the phase of the island. The dip at the center of the deposition profile for heating near the O-point is ascribed to an artifact of the beam discretization: the central volume of the island is very small and is crossed by a limited number of the rays that model the ECCD beam.
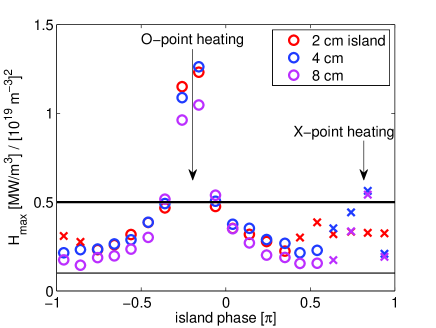
In Fig. 8 we present the results of RELAX calculations for the injection of a MW ECCD beam in a geometry including a locked island of , and cm width for different island phases. The results are given in terms of the peak value of the non-linearity parameter (1). The thin solid black line represents the value of in the unperturbed equilibrium, while the thick black line indicates the threshold for non-linear effects. Circles represent cases in which the peak value is attained inside the island and crosses cases in which the peak value is attained on the separatrix. In case of deposition around the O-point the threshold is clearly exceeded.
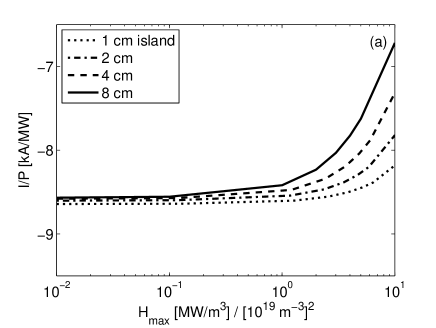
The non-linear effects introduced by exceeding the threshold have been studied in a series of RELAX calculations for injected powers in the range of kW to 10 MW. These calculations are performed for O-point heating and the results are summarized in Fig. 9a, which depicts the global current drive efficiency as a function of the peak non-linearity parameter for island sizes of 1, 2, 4, and 8 cm. As in the unperturbed equilibrium case, the non-linear effects are seen to result in a reduction of the absolute value of the current drive efficiency. However, the effect now appears to depend on the island size. This is because the relative volume of the region in which exceeds the threshold is a function of the island size. An averaged non-linearity parameter over the deposition profile can be defined as
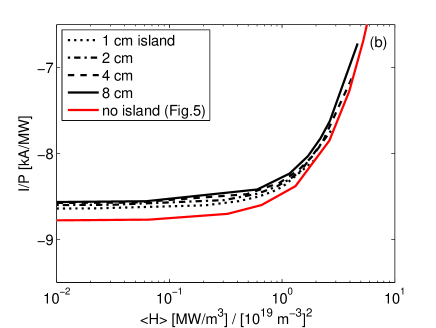
| (13) |
When the results are plotted as a function of this averaged non-linearity parameter (as in Fig. 9b), the data for all different island sizes overlap and coincide with those of calculations in case of the unperturbed equilibrium (see Fig. 5).
V ECCD in the presence of a rotating magnetic island
We proceed with investigating ECCD when the island rotates. All ECCD simulations reported below, have been obtained for the fixed island size of cm. The injected power levels are 1 MW and 4 MW. The studied island rotation frequencies are kHz which is the actual value in the related experiment and kHz. The relevant collision frequency of the resonant electrons is about Hz, i.e. between these two values. Note that these simulations were performed by successive calculations over short time intervals ( times the rotation period) for discrete phases of the island. In all cases a total time interval of about ms was simulated which was sufficient to reach a quasi-steady state.
We remind that the MW power injection case corresponds to a power that is significantly higher than what was injected in the experiments. However, this case serves to illustrate the magnitude of the non-linear effects that can be expected in experiments at higher power or at lower density and consequently higher values of the nonlinearity parameter.
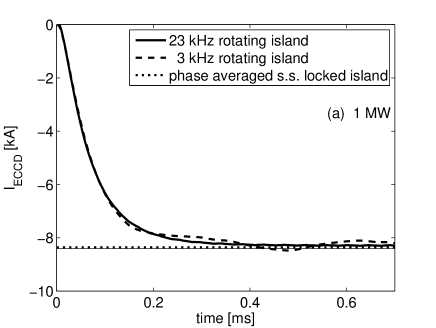
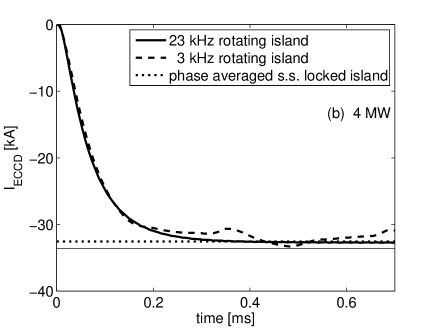
Figures 10a and 10b show the results in terms of the total driven current as a function of time for injected power levels of MW and of MW, respectively. For reference, each plot also contains a dotted line indicating the phase averaged steady state current in case of a locked island for the same injected power, as well as a thin solid line with the phase averaged steady state driven current extrapolating the low power linear results. In the MW power injection case the phase averaged locked island result is almost identical to the linear result, while the MW case shows a reduction in the absolute value of the current drive efficiency. The kHz oscillation is clearly visible in both figures, whereas the oscillation in the kHz cases is barely noticeable.
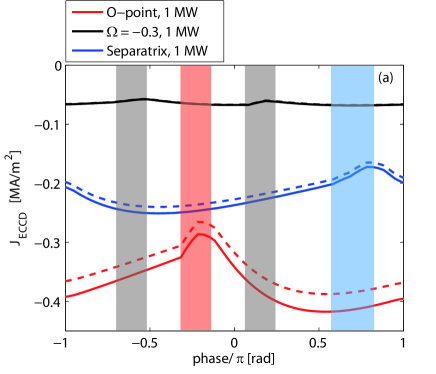
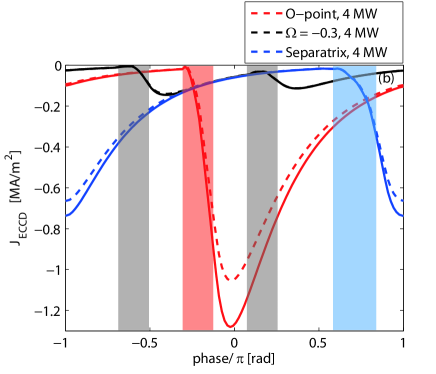
Figures 11a and 11b show the time evolution of the current density in a single rotation period during the quasi-steady state for an island rotating with kHz and kHz, respectively. The time is represented here in terms of the island phase as defined in Section II.B. The current densities shown are from the maximum near the O-point (red colored curves), a surface about midway the island (, black colored curves), and the first surface outside the outer separatrix (blue colored curves). The shaded areas in the same colors indicate the times during which these surfaces are heated. Full curves refer to the results for 1 MW power injection while the dashed refer to those for 4 MW power injection. Note that the results for 4 MW are divided by in order to ease the comparison with the 1 MW results. We draw attention to a number of features that can be observed in these results. In particular, in the 23 kHz case (Fig. 11a) a direct reduction in the driven current density (absolute value) is seen as soon as a surface is heated. This is a consequence of the Ohkawa effect resulting from the trapping of current carrying electrons ohkawa . This is an immediate result of the EC quasi-linear diffusion. The main current drive coming from the Fisch-Boozer effect is delayed by a collision time. As explained in fisch , westerhof_eps2013 , the immediate effect of EC quasi-linear diffusion is mainly an increase of the perpendicular velocity of the resonant electrons. The reduced collisionality of these electrons subsequently results in the establishment of a current on a collisional time scale. As a result, the driven current density (absolute value) peaks well after the heating of the surface. Also note that the current drive efficiency both near the O-point and at the separatrix is significantly reduced in the 4 MW power injection case as compared to 1 MW power injection. In particular, for the lower rotation frequency of 3 kHz the maximum value of the efficiency reached near the O-point is reduced by in the 4 MW case. We remind that the driven current density at the O-point contributes most strongly to NTM stabilization.
Figure 12 shows averaged driven current density profiles for 4 MW power injection. The average is over a single rotation period during the quasi-steady regime in cases of a rotating island and over all phases for the locked island case. The results are plotted as a function of the normalized low field side minor radius. The labeling is the same as that of Fig. 10b. This figure shows that significant quasi-linear effects are limited to narrow regions around the O-point and immediately outside the separatrices. For the 1 MW injection case, the averaged current density profiles in all cases are practically identical to scaled low power locked island results.
VI The consequences of non-linear effects in ECCD on the magnetic island evolution
Having investigated the non-linear effects in ECCD extensively we now study their consequences on the magnetic island evolution. We conduct this study based on the generalized Rutherford equation (GRE) rutherford1 , rutherford2 written as:
| (14) |
where is the current diffusion time for the plasma resistivity at the resonant surface of the island. The first term on the right-hand side is the classical stability index. The second term describes the modifications to the classical tearing mode equation as a consequence of all possible non-inductive contributions to the current perturbation. The term accounting for the stabilizing contribution of the EC driven current density Hegna1997 , sauter_2004 , DeLazzari2009 is
| (15) |
where is the radial coordinate relative to the resonant surface, the helical angle in the cross-section of the island, the shear length, and the poloidal magnetic field at the resonant surface. In the previous sections we have seen that the non-linear effects alter both the driven current density profile and the amplitude of the CD efficiency. We define a non-linear shape function that accounts for all these effect in a single coefficient
| (16) |
where represents the low power, linear CD efficiency calculated in a geometry in the absence of islands and denotes the total injected power in case of continuous wave (CW) application. Accordingly, the contribution of the current drive (Eq. 15) can be rewritten as,
| (17) |
We present the consequences of the non-linear effects in ECCD on the magnetic island evolution in terms of this non-linear shape function .
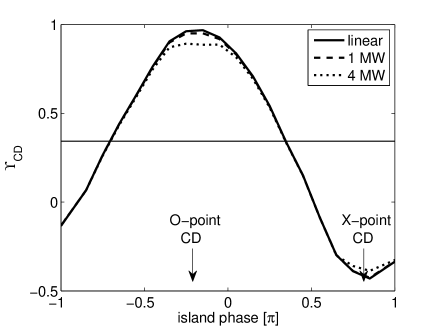
Figure 13 shows the non-linear shape function as a function of the island phase in the case of a locked island of cm wide for increasing deposited power levels. The thin, straight line represents the average of the low power, linear results over all phases of the island. Although non-linear effects reduce the stabilization efficiency of O-point current drive as well as the destabilization efficiency for X-point current drive as the deposited power is increased, the difference is very small.
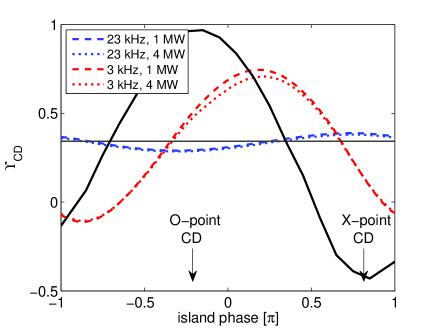
Figure 14 shows the profiles in the case of a rotating island of cm wide. The blue curves represent the cases with an island rotation frequency of kHz. The dashed curves designate the results for a deposited power of 1 MW and the dotted ones those for a deposited power of 4 MW. The red curves represent the cases with an island rotation of kHz. The black curve representing again the low power, linear results in case of a locked mode, is included for comparison. The thin, straight line again represents the average of the linear regime results over all phases of the island. As in the case of locked islands, the consequences of the non-linear effects on the island evolution when the island rotation is taken into account is relatively small. In the 23 KHz case representing the actual experimental mode frequency, the effect is completely negligible even in the case where the power is increased to 4 MW. The figure does show another salient feature however: The phase shift of the oscillation relative to the island rotation is clearly larger than what was observed in ayten on the basis of a simplified model for the dynamics of the EC driven current inside a magnetic island. This stems from the establishment of the Fisch-Boozer current on a collisional time scale as discussed in the previous section. Apart from this increase in the phase phase shift of the oscillation in , the effects of the island rotation obtained in the present work with the full Fokker-Planck modeling are consistent with the effects of island rotation as obtained in ayten .
VII Summary and discussion
In this paper we question to what extent the assumption of a linear ECCD efficiency is valid for the case of ECCD applied for the stabilization of NTMs inside a magnetic island. It has been shown by Harvey et al. harvey that non-linear effects appear when the ratio of the absorbed power density over the square of the electron density exceeds a certain threshold as represented by Eq. 1. Motivated by that, we calculate the non-linear ECCD efficiency through bounce-averaged, quasi-linear Fokker-Planck calculations in a realistic magnetic geometry including a locked or rotating magnetic island. For this purpose, we use the TORAY ray tracing code Kritz , westerhof_toray in combination with the RELAX bounce-averaged, quasi-linear Fokker-Planck code westerhof_relax . The unperturbed plasma equilibrium is taken in accordance with ASDEX Upgrade discharge nr. which features a 3/2 magnetic island reich . We obtained the topology in the presence of a magnetic island by superimposing a helical flux perturbation which provides a realistic approximation to the radial dependence of the tearing perturbation as given in Yang , hugovdbrand . In this example the rays propagate tangential to the flux surfaces in the power deposition region. As a result, the whole power from a single ray is absorbed over a very narrow range of flux surfaces. These calculations show the possibility of significant non-linear effects on the ECCD efficiency, especially, in the case of locked islands or when the magnetic island rotation period is longer than the collisional time scale: because the volume enclosed by the flux surfaces inside the magnetic island in particular around the O-point is small, the local ECCD power density becomes very high and exceeds the threshold for nonlinear effects. The non-linear effects result in an overall reduction of the current drive efficiency for absorption of the EC power on the low field side of the electron cyclotron resonance layer in contrast with earlier claims dasilvarosa . This observation is explained by the quasi-linear flattening of the distribution function around the resonant velocities reducing the local absorption, which results in a further penetration of the power to regions in the plasma where the current drive efficiency is lower. As a consequence of the non-linear effects, also the stabilizing effect of the ECCD on the tearing mode will be reduced from the linear expectations. Nonlinear effects result in a global decrease of the ECCD efficiency. We present more detailed conclusions by dividing the results into three different categories. First we start with finding regarding ECCD in the presence of no island, that is in the unperturbed equilibrium.
ECCD in the unperturbed magnetic equilibrium
-
•
The maximum absorbed power density for the injection of a 1 MW ECW beam corresponds to a nonlinearity parameter . Thus, nonlinear effects are not expected for these conditions in ASDEX Upgrade in the absence of magnetic islands.
-
•
Low power absorption and driven current density obtained along the central ray of the full beam ray with both TORAY and RELAX show good agreement and therefore, provide a cross code benchmark between TORAY and RELAX in the low power, linear regime.
-
•
The threshold for non-linear effects is seen to be in agreement with Ref. harvey .
-
•
Nonlinear effects result in reduction of the absolute value of the global ECCD efficiency (i.e. the ratio of total driven current over total absorbed power). This reduction is explained by the fact that quasi-linear flattening of the distribution function reduces the absorption coefficient and shifts the peak in the profile to a smaller major radius, closer to the cold EC resonance, where the ECCD efficiency is lower.
ECCD in the presence of a locked magnetic island
-
•
The topology of the closed flux surfaces in the presence of islands leads to higher local absorbed power densities of the ECCD applied for magnetic island control.
-
•
The peak power density and, consequently, the likelihood of non-linear effects is strongly dependent on the phase of the island.
-
•
In case of deposition around the O-point of the island, the threshold for nonlinear effects is exceeded significantly for an injected power of 1 MW and for the parameters of the ASDEX Upgrade discharge being studied.
-
•
The significance of the non-linear effects is best parameterized by a profile averaged non-linearity parameter given by Eq. 13. As a function of this averaged non-linearity parameter, the non-linear ECCD efficiency is independent of island size and coincides with the results obtained in the unperturbed equilibrium.
-
•
Even at 4 MW the expected non-linear effects in the current drive efficiency do not exceed 10% for the ASDEX Upgrade parameters used in this study.
ECCD in the presence of a rotating magnetic island
-
•
Rotation of the island generates an oscillation of the total driven current with the rotation frequency, which however becomes insignificant when the rotation frequency is larger than the collision frequency as is the case with a rotation frequency of 23 kHz.
-
•
For both 1 and 4 MW, the average of the total driven current over a rotation period converges to the same value as obtained by taking the phase average of the steady state driven current in the locked island cases. While for 1MW the time/phase averaged current is almost identical to the extrapolated linear result, the 4 MW case shows a reduction of the total driven current of about .
-
•
The time evolution of the current density shows a direct reduction in the driven current density (absolute value) at the beginning of each period that a surface is heated. This is a consequence of the Ohkawa effect which stems from the trapping of current carrying electrons ohkawa . The main current drive arising from the Fisch-Boozer effect is delayed by a collision time fisch , westerhof_eps2013 .
-
•
The current drive efficiency near the O-point and just outside the separatrices is considerably lowered when the power is increased from 1 to 4 MW. Especially, for the lower rotation frequency of 3 kHz the maximum value of the efficiency attained near the O-point is reduced by in the 4 MW case.
-
•
Time averaged driven current density profiles for 4 MW power injection shows that significant quasi-linear effects are constrained to narrow regions around the O-point and immediately outside the separatrices. For the 1 MW injection case, the averaged current density profiles in all cases are approximately identical to scaled low power locked island results.
We add that the non-linear effects may already be relevant at present power levels in case of locked islands whereas there is very little or no effect for present power levels when the island rotates. The consequences of the non-linear effects on the island evolution are found to be minor both in the case of locked and rotating islands. At the mode rotation frequencies as observed in the actual experiments (about 23 kHz), the nonlinear effects are completely negligible even in the case where the power is increased to 4 MW.
VIII Appendix
In the case of the ASDEX Upgrade discharge 26827 studied in this paper, the EC waves propagate almost tangentially to the flux surfaces of the unperturbed equilibrium in the region of EC power deposition. The original algorithm for the quasi-linear diffusion calculation in the RELAX bounce averaged Fokker-Planck code was based on the wave parameters in the point where the ray crosses the magnetic surface on which the distribution function is to be evaluated. In the case of a tangent ray this algorithm breaks down, because all power may in fact be absorbed in between the crossing of two of the discrete surfaces being considered. For this reason a new algorithm for the calculation of the quasi-linear diffusion operator has been implemented.
The surfaces () in the RELAX code represent finite volume shells in the toroidally symmetric unperturbed equilibrium or in the perturbed magnetic topology with magnetic island and each ray is discretized in small segments. Where denotes the unperturbed poloidal flux perturbed helical flux. In the TORAY-FOM ray-tracing code, the EC wave beam is discretized in a number of rays (). A post processor divides the trajectory of each ray in small, subsequent segments that lie entirely within one of the finite volume shells. For each of these segments the following information is extracted from the ray tracing results and transferred to the RELAX Fokker-Planck code:
| variable | description |
|---|---|
| ENPAR | the parallel refractive index |
| DNPARP | the spread in in the poloidal direction |
| DNPART | the spread in in the toridal direction |
| OMCOM | the value of at the center of the segment |
| DOMCOM | the spread in over the segment |
| OPTISC | the length of the ray segment in cm |
| BBO | the ratio of the magnetic field at the center of the segment |
| over the minimum field along the flux surface | |
| NSCROS | the number of the volume shell in which the segment lies |
The diffusion operator for volume shell is now obtained by summing the contributions from all segments of all rays within this volume shell:
| (18) |
where each is evaluated according to Eq. (5).
IX Acknowledgment
The work in this paper has been performed in the framework of the NWO-RFBR Centre of Excellence (grant 047.018.002) on Fusion Physics and Technology. This work, supported by the European Communities under the contract of Association between EURATOM/FOM, was carried out within the framework of the European Fusion Programme. The views and opinions expressed herein do not necessarily reflect those of the European Commission.
References
- [1] R.J. La Haye. Neoclassical tearing modes and their control. Physics of Plasmas, 13(5):055501, 2006.
- [2] D.A. Kislov, V.V. Alikaev, Yu.V. Esipchuk, A.M. Kakurtn, A.Ya. Kislov, D.A. Martynov, G.E. Notkin, K.A. Razumova, A.V. Sushkov, and V.V. Volkov. The m=2, n=1 mode suppression by ECRH on the T-10 tokamak. Nuclear Fusion, 37(3):339, 1997.
- [3] E. Westerhof, A. Lazaros, E. Farshi, M.R. de Baar, M.F.M. de Bock, I.G.J. Classen, R.J.E. Jaspers, G.M.D. Hogeweij, H.R. Koslowski, A. Krämer-Flecken, Y. Liang, N.J. Lopes Cardozo, and O. Zimmermann. Tearing mode stabilization by electron cyclotron resonance heating demonstrated in the TEXTOR tokamak and the implication for ITER. Nuclear Fusion, 47(2):85–90, 2007.
- [4] I.G.J. Classen, E. Westerhof, C.W. Domier, A.J.H. Donné, R.J.E. Jaspers, N.C. Luhmann, H.K. Park, M.J. van de Pol, G.W. Spakman, M.W. Jakubowski, and the TEXTOR team. Effect of heating on the suppression of tearing modes in tokamaks. Physical Review Letters, 98(3):035001, 2007.
- [5] H. Zohm, G. Gantenbein, G. Giruzzi, S. Günter, F. Leuterer, M. Maraschek, J. Meskat, A.G. Peeters, W. Suttrop, D. Wagner, M. Zabiégo, ASDEX Upgrade Team, and ECRH Group. Experiments on neoclassical tearing mode stabilization by ECCD in ASDEX Upgrade. Nuclear Fusion, 39(5):577, 1999.
- [6] G. Gantenbein, H. Zohm, G. Giruzzi, S. Günter, F. Leuterer, M. Maraschek, J. Meskat, and Q. Yu. Complete suppression of neoclassical tearing modes with current drive at the Electron-Cyclotron-Resonance frequency in ASDEX upgrade tokamak. Physical Review Letters, 85(6):1242–1245, 2000.
- [7] A. Isayama, Y. Kamada, S. Ide, K. Hamamatsu, T. Oikawa, T. Suzuki, Y. Neyatani, T. Ozeki, Y. Ikeda, K. Kajiwara, and the JT-60 team. Complete stabilization of a tearing mode in steady state high- H-mode discharges by the first harmonic electron cyclotron heating/current drive on JT-60U. Plasma Physics and Controlled Fusion, 42(12):L37, 2000.
- [8] R. J. La Haye, S. Günter, D. A. Humphreys, J. Lohr, T. C. Luce, M. E. Maraschek, C. C. Petty, R. Prater, J. T. Scoville, and E. J. Strait. Control of neoclassical tearing modes in DIII-D. Physics of Plasmas, 9(5):2051, 2002.
- [9] C.C. Petty, R.J. La Haye, T.C. Luce, D.A. Humphreys, A.W. Hyatt, J. Lohr, R. Prater, E.J. Strait, and M.R. Wade. Complete suppression of the m = 2/n = 1 neoclassical tearing mode using electron cyclotron current drive in DIII-D. Nuclear Fusion, 44(2):243–251, 2004.
- [10] R.J. La Haye, R. Prater, R.J. Buttery, N. Hayashi, A. Isayama, M.E. Maraschek, L. Urso, and H. Zohm. Cross machine benchmarking for ITER of neoclassical tearing mode stabilization by electron cyclotron current drive. Nuclear Fusion, 46(4):451–461, 2006.
- [11] M. Maraschek, G. Gantenbein, Q. Yu, H. Zohm, S. Günter, F. Leuterer, and A. Manini. Enhancement of the stabilization efficiency of a neoclassical magnetic island by modulated electron cyclotron current drive in the ASDEX Upgrade tokamak. Phys. Rev. Lett., 98:025005, Jan 2007.
- [12] A. Isayama, G. Matsunaga, T. Kobayashi, S. Moriyama, N. Oyama, Y. Sakamoto, T. Suzuki, H. Urano, N. Hayashi, Y. Kamada, T. Ozeki, Y. Hirano, L. Urso, H. Zohm, M. Maraschek, J. Hobirk, K. Nagasaki, and the JT-60 Team. Neoclassical tearing mode control using electron cyclotron current drive and magnetic island evolution in JT-60U. Nuclear Fusion, 49(5):055006, 2009.
- [13] P.H. Rutherford. Nonlinear growth of the tearing mode. Physics of Fluids, 16(11):1903, 1973.
- [14] P.H. Rutherford. Basic physical processes of toroidal fusion plasmas. Proceedings of Course and Workshop, 2:531, Varenna, 1985 (Commission of the European Communities, Brussels, 1986).
- [15] R. Prater. Heating and current drive by electron cyclotron waves. Physics of Plasmas, 11(5):2349–2376, 2004.
- [16] R.W. Harvey, M.G. McCoy, and G.D. Kerbel. Power dependence of electron-cyclotron current drive for low- and high-field absorption in tokamaks. Phys. Rev. Lett., 62:426–429, Jan 1989.
- [17] B. Ayten et al., Phys. Plasmas 19 092506 (2012)
- [18] Heinz Isliker, Ioanna Chatziantonaki, Christos Tsironis, and Loukas Vlahos. Electron-cyclotron wave propagation, absorption and current drive in the presence of neoclassical tearing modes. Plasma Physics and Controlled Fusion, 54(9):095005, 2012.
- [19] M. Reich, A. Bock, M. Maraschek, and ASDEX Upgrade Team NTM Localization by Correlation of and dB/dt. Fusion Science and Technology, 61:309, 2012.
- [20] F.A.G. Volpe, M.E. Austin, R.J. La Haye, J. Lohr, R. Prater, E.J. Strait, and A. S. Welander Advanced techniques for neoclassical tearing mode control in DIII-D. Physics of Plasmas, 16(10):10502, 2009.
- [21] B. Esposito, G. Granucci, M. Maraschek, S. Nowak, E. Lazzaro, L. Giannone, A. Gude, V. Igochine, R. McDermott, E. Poli, M. Reich, F. Sommer, J. Stober, W. Suttrop, W. Treutterer, H. Zohm, the ASDEX Upgrade and FTU Teams Disruption avoidance by means of electron cyclotron waves Plasma Physics and Controlled Fusion, 53(12):124035, 2011.
- [22] A. H. Kritz et al., Proc. 3rd Intern. Symp. Heating in Toroidal Plasmas, Vol.II p.707 (1982)
- [23] E. Westerhof. Implementation of TORAY at JET. National Technical Information Service Document no. PB91-114819INZ Rijnhuizen Report 89-183, 1989.
- [24] E. Westerhof et al. Relax: a computer code for the study of collisional and wave driven relaxation of the electron distribution function in toroidal geometry Rijnhuizen Report rr 92-211. 1992.
- [25] Y.R. Lin-Liu, V.S. Chan, and R. Prater. Electron cyclotron current drive efficiency in general tokamak geometry. Physics of Plasmas, 10(10):4064–4071, 2003.
- [26] N.B. Marushchenko, H. Maassberg, and Yu. Turkin. Electron cyclotron current drive calculated for ITER conditions using different models. Nuclear Fusion, 48(5):054002, 2008.
- [27] N.B. Marushchenko, H. Maassberg, and Yu. Turkin. Corrections to the paper ’electron cyclotron current drive calculated for iter conditions using different models’ (2008 nucl. fusion 48 054002). Nuclear Fusion, 49(12):129801, 2009.
- [28] J. Killeen et al., Computational Methods for Kinetic Models of Magnetically Confined Plasmas, Springer Verlag, New York, USA (1986)
- [29] C.F.F. Karney, Fokker-Planck and Quasilinear Codes, proceedings of the 3rd European Workshop on the Problems in the numerical Modeling of Plasmas, Varenna, Italy, September 10-13, 1985, Computer Physics Reports 4 (1986)
- [30] Arthur Peeters, High power RF heating and nonthermal distributions in tokamak plasmas, PhD thesis (1994)
- [31] G. Giruzzi. Quasilinear and toroidal effects on current drive by electron cyclotron waves. Physics of Fluids, 31:3305, 1988.
- [32] J. Yang, Q. Yu, S. Zhu, and G. Zhuang. Electron temperature difference between the -point and -point of a magnetic island. Physics of Plasmas, 16:092308, 2009.
- [33] H. van den Brand, M.R. de Baar, N.J. Lopes Cardozo, and E. Westerhof. Evaluating neoclassical tearing mode detection with ECE for control on ITER. Nuclear Fusion, 53(1):013005, 2013.
- [34] A.G. Peeters and E. Westerhof. Impact of radial transport on the quasilinear plateau formation due to electron cyclotron wave absorption. Physics of Plasmas, 3(5):1628, 1996.
- [35] T. Ohkawa. General atomic company report no ga-a13847. 1976.
- [36] E. Westerhof et al., Expression of electron cyclotron current drive in plasma fluid models, 40th European Physical Society Conference on Plasma Physics, 1 - 5 July, Espoo, Finland, Paper P2.150, http://ocs.ciemat.es/EPS2013PAP/pdf/P2.150.pdf
- [37] N.J. Fisch and A.H. Boozer. Creating an asymmetric plasma resistivity with waves. Phys. Rev. Lett., 45:720–722, Sep 1980.
- [38] P R da Silva Rosa and G Giruzzi. Rf current drive by electron cyclotron waves in the presence of magnetic islands. Plasma Physics and Controlled Fusion, 42(7):755, 2000.
- [39] C.C. Hegna and J.D. Callen. On the stabilization of neoclassical magnetohydrodynamic tearing modes using localized current drive or heating. Physics of Plasmas, 4(8):2940–2946, August 1997.
- [40] O. Sauter. On the contribution of local current density to neoclassical tearing mode stabilization. Physics of Plasmas, 11(10):4808–4813, 2004.
- [41] D. De Lazzari and E. Westerhof. On the merits of heating and current drive for tearing mode stabilization. Nuclear Fusion, 49(7):075002, 2009.