Physical properties of CeGe2-x () single crystals
Abstract
We present data on the anisotropic magnetic properties, heat capacity and transport properties of CeGe2-x () single crystals. The electronic coefficient of the heat capacity, mJ/mol K2, is enhanced; three magnetic transitions, with critical temperatures of K, K, and K are observed in thermodynamic and transport measurements. The ground state has a small ferromagnetic component along the - axis. Small applied field, below 10 kOe, is enough to bring the material to an apparent saturated paramagnetic state (with no further metamagnetic transitions up to 55 kOe) with a reduced, below , saturated moment.
pacs:
75.30.Kz, 75.30.Mb, 75.30.Gw, 75.50.Ee, 75.50.Cc1 Introduction
CeGe2 appears to be one of the simple binary compounds that has a benefit of being of a interest for a number of years. Over 50 years ago it was reported to be a ferromagnet with the Curie temperature K that crystallizes in the orthorhombically distorted ThSi2 structure. [1] The crystal structure of CeGe2 was studied further. [2, 3, 4, 5] It was identified either as a tetragonal -ThSi2 type [2, 4], or as an orthorhombic -GdSi2 type. [3, 5] Magnetization and heat capacity measurements [6] suggested ferromagnetic order with K. Similar K value and the Kondo temperature K were reported in [7]. Detailed magnetization study of CeGe2 [8] proposed two magnetic transitions in this material, antiferromagnetic, at K and ferromagnetic, at lower temperature, K.
The inconsistencies in determination of the crystal structure in early publications appeared to have a simple explanation. With further studies of the Ce - Ge binary phase diagram it was realized that CeGe2 is not a stoichiometric, line, compound, but has a depleted structure with a width of formation, CeGe2-x with , or larger (see below) [9, 10, 11, 12, 13, 14] A transition from high temperature, tetragonal, -ThSi2 type structure to low temperature, orthorhombic, -GdSi2 type was reported at temperatures between 560 ∘C () and 490 ∘C (). [9, 10, 11]
Within the range of Ge concentrations between 1.71 and 2.0 the orthorhombic crystal structure, and two magnetic transitions, with K and K, virtually independent on Ge concentration, were reported. [15] For lower Ge concentrations, between CeGe1.66 and CeGe1.71, a tetragonal crystal structure and a single, antiferromagnetic, transition with K (and no other magnetic transition down to 0.5 K) were observed. [15] The latter magnetic results were challenged by conclusions in [16], where two magnetic transitions, one at 6.7 K and another, ferromagnetic, at 5.3 K were described for the tetragonal CeGe1.66.
Given that majority of the studies, in particular for orthorhombic CeGe2-x with higher Ge concentration, were performed on polycrystalline samples (as a result the anisotropies of physical properties were not accessed) and that the literature data contains apparent inconsistencies, we report a detailed study of the thermodynamic and transport properties of CeGe2-x () single crystals.
2 Sample characterization and experimental details
Single crystals of CeGe2-x were grown using the high-temperature solution technique. [17, 18] The constituent elements, with an initial stoichiometry of Ce0.23Ge0.77, were placed in an alumina crucible and sealed in a fused silica tube under a partial Ar pressure. The ampule was heated up to 1190∘C and then was cooled down to 890 ∘C over hours. After that the flux was decanted, meaning that the resulting single crystals were effectively quenched to room temperature from to 890 ∘C over several minutes. The crystals grow as large plates, with the dimensions in excess of mm3, with the -axis perpendicular to the plate (see below).
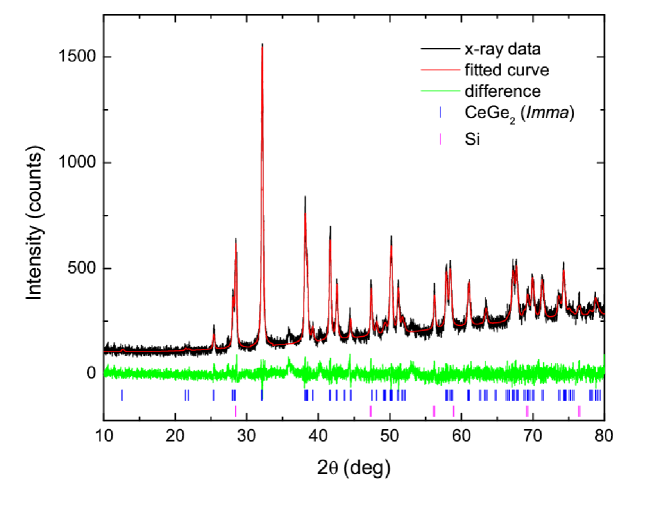
From earlier work [9, 10] and the binary Ce - Ge phase diagram [11] the crystals are expected to have some Ge - deficiency, CeGe2-x. Elemental analysis was performed on these crystals using wavelength-dispersive x-ray spectroscopy (WDS) in the electron probe microanalyzer of a JEOL JXA-8200 electron microprobe. Ce2Fe17 and elemental Ge were used as the standards. The stoichiometry of the samples was determined to be CeGe1.76 with the error bar in the value of of about or less than 0.01. At first glance, it appears that this result contradicts the established width of formation shown in the binary phase diagram.[11] We argue that the spacing between the experimental points in the original papers [9, 10] and the error bars present in this work as well as in the original publications allow to remove this apparent contradiction. Given our growth method this result implies that the Ge - rich side of the width of formation should be shifted from Ce38Ge62 to this composition (Ce36.2Ge63.8). We will use the notation CeGe1.76 for the samples studied in this work. Room temperature powder x-ray diffraction measurements were taken using Cu- radiation in a Rigaku Miniflex diffractometer. The spectrum was refined using a Rietica software. [19] The x-ray data (Fig. 1) are consistent with the sample being orthorhombic with the lattice parameters Å, Å, and Å, the values similar to those reported in Refs [3, 5, 7, 14]. It has to be mentioned that a complex superstructure originating from a partial ordering of the Ge vacancies was reported for a sample with a very close Ge-concentration, CeGe1.75 [5]. The resolution of our x-ray diffraction data was not sufficient to detect such a superstructure, if present.
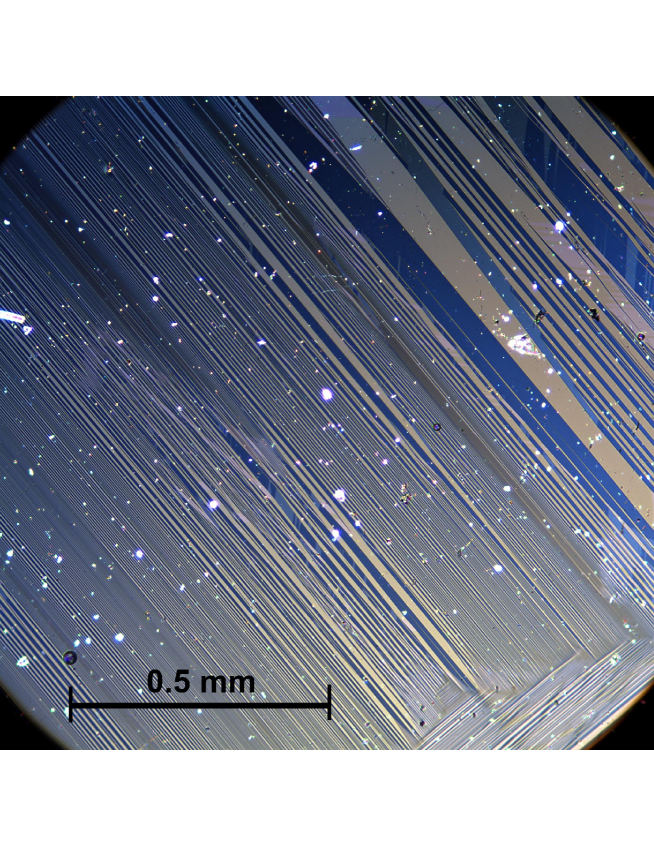
Figure 2 shows the optical image of the surface of the crystal taken with optical, polarized light, microscope at room temperature. The very clear domain structure is an evidence of a solid - solid phase transition above room temperature and is fully consistent with the reported tetragonal to orthorhombic structural phase transition near to 500 ∘C. [9, ere72agok89a] The long orthorhombic domains with the very wide range of width, from m to m, are clearly seen. The existence of such domains implies that without de-twinning of the crystals measured in-plane properties will represent some average between and directions. Additional scattering on the domain boundaries might worsen the in-plane resistivity values.
Anisotropic, temperature dependent, and field dependent dc magnetization was measured using commercial Quantum Design MPMS-5 and MPMS-7 units. In-plane ac resistivity ( mA, Hz) was measured using an ACT option of a Quantum Design PPMS-14 instrument. The heat capacity data were taken using a hybrid adiabatic relaxation technique of the heat capacity option in a Quantum Design PPMS-14 instrument. Thermoelectric power (TEP) measurements were carried out by dc, alternating heating (two-heaters-two-thermometers), technique [20] over the temperature range from 2 to 300 K. Thermal expansion and magnetostriction were measured using a capacitive dilatometer constructed of OFHC copper. [21] The dilatometer was mounted in a Quantum Design PPMS-14 instrument and was operated over a temperature range of 1.8 - 300 K in magnetic field up to 140 kOe. Due to aforementioned presence of the orthorhombic domains, the dilation was measured along an arbitrary in-plane direction.
3 Results and discussion
3.1 Basic physical properties.
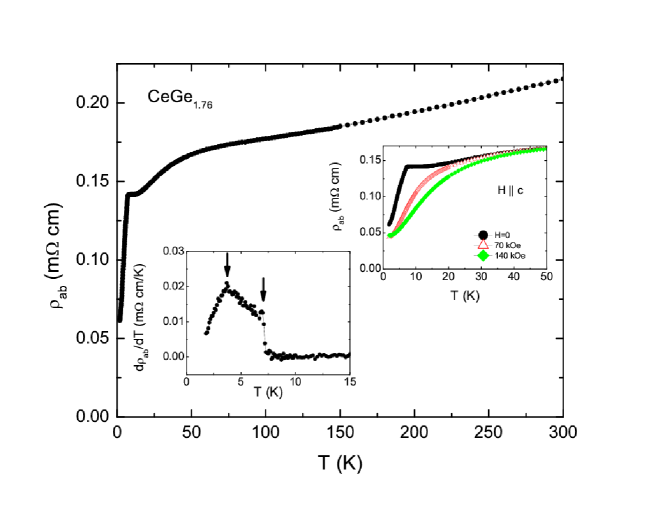
In-plane, temperature dependent resistivity of the CeGe1.76 crystal is shown in Fig. 3. It features a very broad hump at about 50 K and a shallow minimum just above the sharp drop in resistivity below K. The residual resistivity ratio, is approximately 3.5. Such relatively high value of the (compare e.g. with the values of Ni-defficient RNiGe3, it R = rare earth, single crystals [22]) hints at possibility of the ordering of the Ge vacansies suggested earlier, [5] for a sample with a stoichiometry that is essentially CeGe1.75. This temperature behavior is similar to that observed in other heavy fermion or intermediate valence compounds with a low temperature magnetic order. The temperature derivative of the resistivity data, , [23] clearly shows two distinct features, at 7.1 K and 3.8 K, suggesting two magnetic transitions in this material. Large magnetic fields suppress the features, and low temperature magnetoresistance is negative. The overall resistivity behavior is similar to what was reported for CeGe1.54 [13], tetragonal CeGe1.66 [16] and CeGe2 [7], despite the differences is stoichometry that do affect the number and exact temperature of transitions detected in low temperature resistivity.
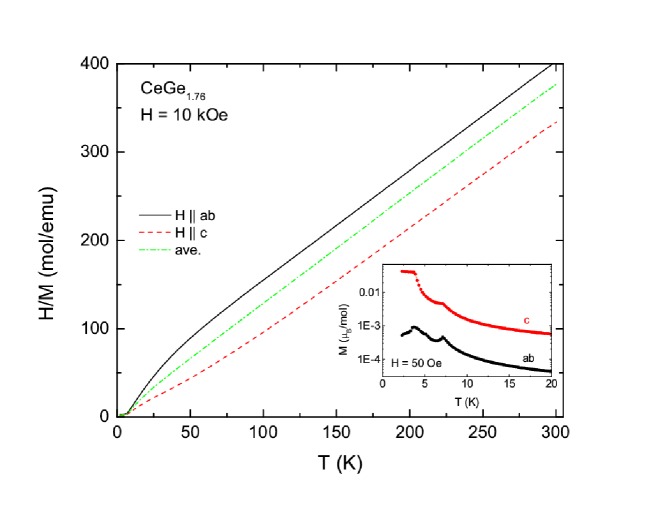
Anisotropic, inverse, temperature-dependent dc susceptibility, , measured at 10 kOe is shown in Fig. 4. The polycrystalline average was calculated as . The susceptibility is anisotropic with in the paramagnetic state. The Curie - Weiss fits of the high temperature (150 K 300 K) susceptibility data, (where and are Curie constant and Curie - Weiss temperature, respectively) yield the effective moment (from ) , consistent with the theoretical value for Ce3+, and the Curie - Weiss temperatures, K, K, and K. The signs of the Curie - Weiss temperatures suggest that antiferromagnetic interactions dominate in the -plane whereas ferromagnetic ones are predominant along the -axis. The low temperature, low field magnetization data are shown in the inset to Fig. 4. These data further confirm magnetic transitions at K and K. In addition, the data for suggests one more transition, at K (see Fig. 10 and discussion below).
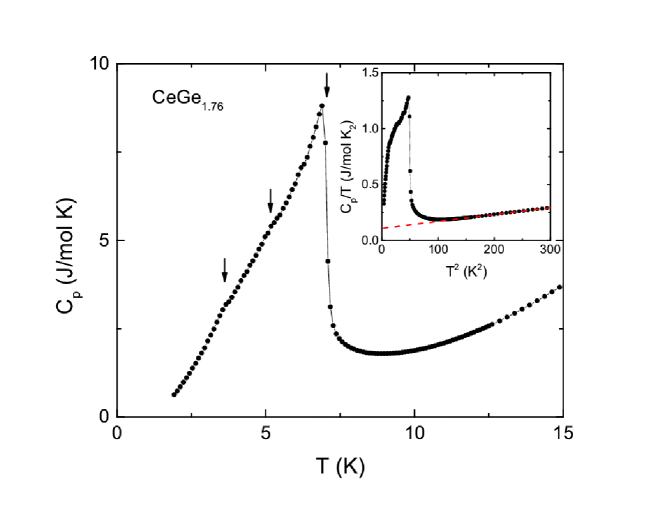
The temperature dependent heat capacity (Fig. 5) has a clear, distinct feature at K and somewhat less pronounces anomaly K (seen as a knee when the data are plotted as vs , Fig. 5, inset). There appear to be other small deviations in behavior in the 3.7 K 7 K temperature range. They do not have corresponding anomalies in resistivity, however the one at K is consistent with the anomaly in the in-plane low field magnetization, mentioned above. The Sommerfeld coefficient, estimated from the linear fit of vs above the transitions, between the 150 K2 and 300 K2 values of (12 - 17 K in the units of ) is enhanced, mJ/mol K2. This value of the Sommerfeld coefficient is similar to that reported for CeGe2 and CeGe1.83 [8, 15] and is noticeably higher than the values reported for CeGe1.68 and CeGe1.66. [15, 16] A rough estimate of the magnetic entropy associated with the magnetic transitions (integration up to K) gives the value of .
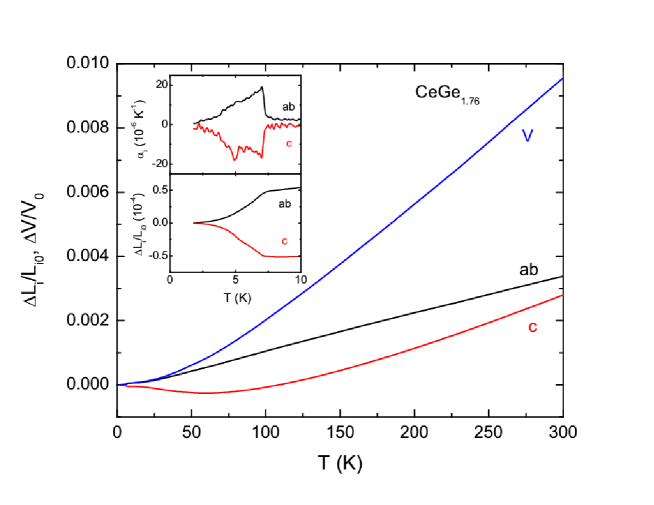
Anisotropic temperature-dependent dilation of CeGe1.76 is shown in Fig. 6. The overall change of volume from the base temperature, 1.8 K to 300 K is close to 1%, that is similar to the change of volume in Cu [24] and is approximately factor of two larger than that of YNi2B2C [25]. In - plane thermal dilation is positive over the whole temperature range and is close to linear in temperature above K with the thermal expansion coefficient K-1. Negative thermal expansion along the -axis is observed in CeGe1.76 below K with the volume thermal expansion being positive in the whole temperature range. The upper transition is clearly seen at K in both anisotropic dilation and thermal expansion coefficients (Fig. 6, inset). The lower transition is seen as a small step-like feature at K in . In a well-defined minimum at temperature K is seen, in agreement with the positions of anomalies in the and the heat capacity.
Since the magnetic transition at K appears to be the second order, we can use our heat capacity and thermal expansion results to evaluate the initial uniaxial and total pressure derivatives of this transition using the Ehrenfest relation, [26]: , where is the molar volume ( m3 using the lattice parameters from the X-ray diffraction), is the jump in the thermal expansion coefficient at the phase transition, and is the corresponding jump in the heat capacity. Using the experimental data above, for CeGe1.76 we found out that in - plane uniaxial pressure derivative is positive, K/kbar, whereas the -axis uniaxial pressure derivative is very similar in its absolute value but negative K/kbar. The hydrostatic pressure derivative can be approximated as K/kbar. So it appears that CeGe1.76 is equally sensitive to uniaxial pressure applied in the - plane and along the -axis, however the upper magnetic transition temperature increases when the pressure is applied in the - plane and decreases when it is applied along the -axis. The absolute values of the pressure derivatives are fairly small. The absolute value of the uniaxial pressure derivatives are close to those inferred for orthorhombic CeVSb3 [27], however for CeVSb3 all uniaxial pressure derivatives have the same, positive, sign. CeGe1.76, like CeVSb3, may be close to a local maximum in ordering temperature and pressures up to 7 GPa may well be able to suppress the magnetic transition to a quantum phase transition.
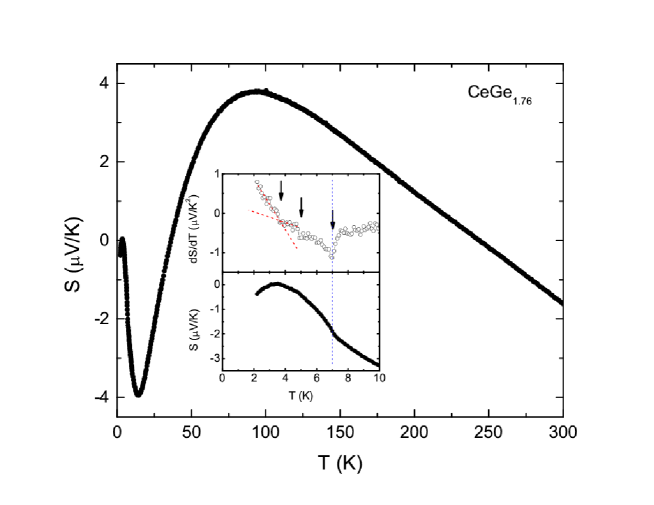
Temperature-dependent, in-plane, TEP data for CeGe1.76 is shown in Fig. 7. On a gross level these data are similar to those reported for CeGe2. [28] The data show two maxima, a broad one at K (corresponding to the lowest crystal electric field splitting of the energy levels [29]) and a sharper one, at K and a minimum at K. Since it is expected that , another minimum, below 2 K is anticipated. Above K the TEP is linear in temperature, indicating that in this temperature region the diffusion TEP is dominant. The TEP changes sign several times, being negative above K, positive between K and K, then negative below K with a very short positive excursion between 3.0 K and 3.8 K. Two low temperature transitions, at and K, are clearly seen in the (Fig. 7, inset), the upper one as a sharp minimum and the lower one as a change in slope. There appears to be an additional, step-like feature in the at K, close to the temperature of small anomalies in the thermodynamic measurements discussed above.
3.2 Anisotropic phase diagrams
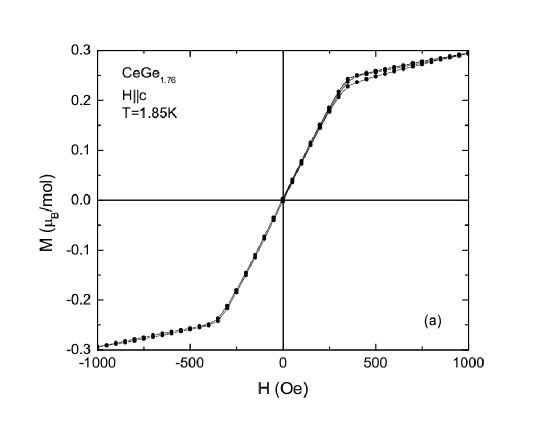
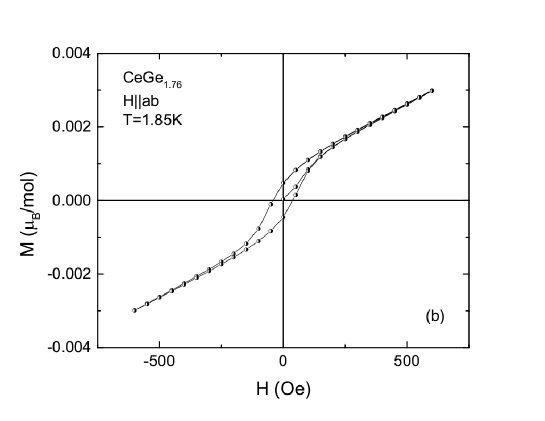
Low-field, five-quadrant, anisotropic magnetization loops for CeGe1.76 are shown in Fig. 8. These data suggest that there is a ferromagnetic component in the magnetization along the - axis at 1.85 K, with a rather small, per cerium, saturated moment and very narrow hysteresis loop. The width of the loop and the saturated moment along the - axis are smaller than those of stoichiometric and magnetically soft CeAgSb2 [30]. This virtual absence of hysteresis again hints at possible order of vacancies (perhaphs in a CeGe1.75, or Ce4Ge7, structure) or at least lack of pinning, even on domain walls. The apparent low field ferromagnetic loop measured for the magnetic field in the plane might be intrinsic, but very possibly is a result of a slight (less than 0.5 ∘) misallignment of the sample.
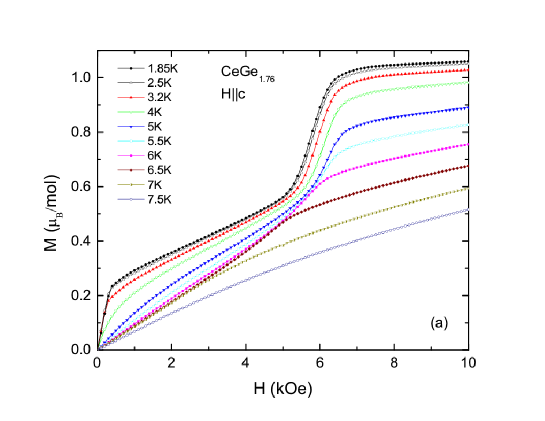
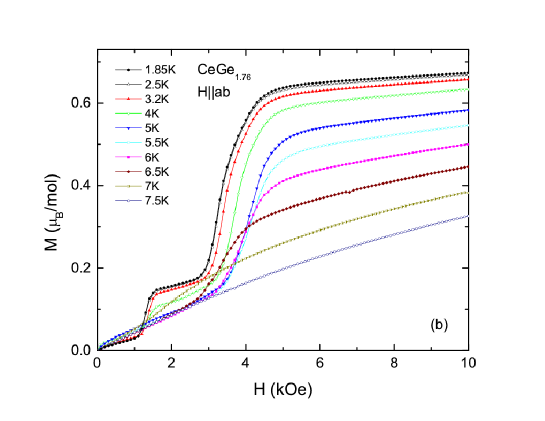
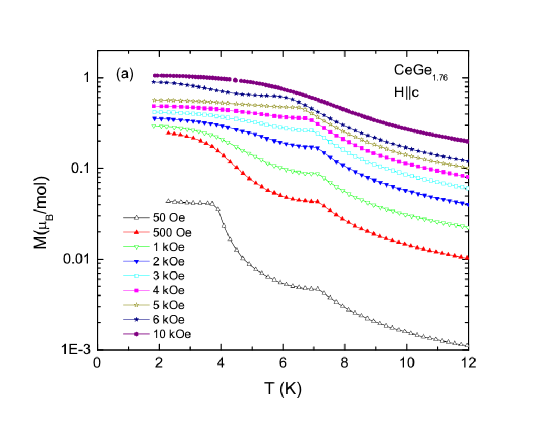
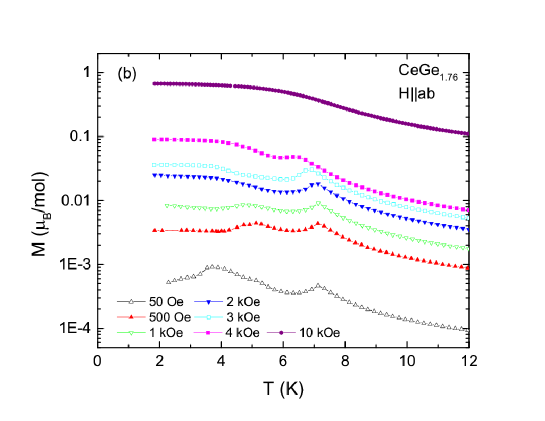
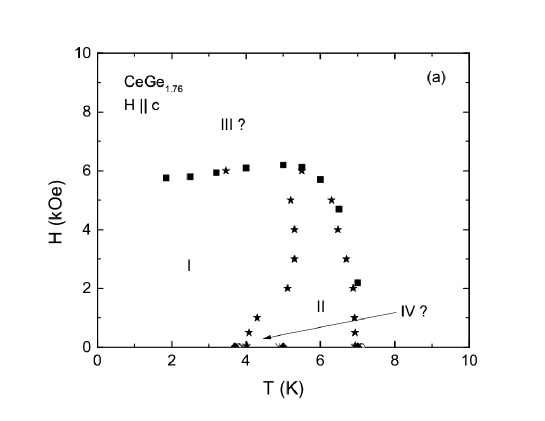
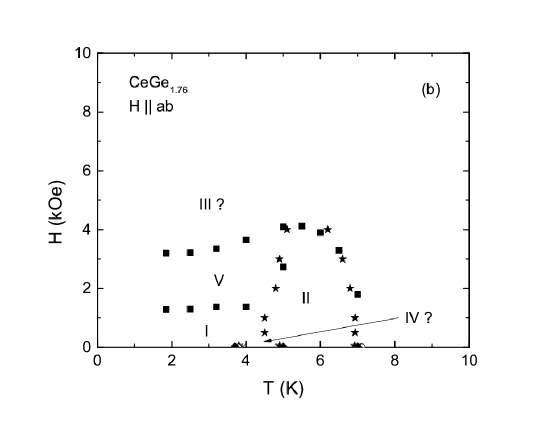
Additional features, corresponding to metamagnetic transitions, are observed in the anisotropic data, taken up to higher, 10 kOe, field at different temperatures (Fig. 9). Magnetization data between 10 kOe and 55 kOe for both orientations (not shown) are monotonic, with no additional features. The saturated magnetization in both directions is below . The magnetization isotherms measured at different temperatures and low temperature, temperature-dependent magnetization measured at different fields (Fig. 10) allow for construction an anisotropic, , phase diagrams for CeGe1.76 (Fig. 11). The points obtained from and data are consistent with each other. For the points obtained from resistivity, thermoelectric power, thermal expansion and heat capacity (as described in the text above) are added. Whereas the direction is unique, the phase diagram for is shown for some guidance only, since twinning and exact orientation might affect the number and the exact position of the phase lines. Phase I is the phase with a ferromagnetic component along the - axis, phase II is a higher temperature antiferromagnetic phase. Phase IV, if indeed exists, is located K and K in zero field, and probably disappears by 0.5 - 1 kOe. Phase V for is a metamagnetic phase.The phase marked as III appears to be the phase corresponding to saturated paramagnetic state. The magnetic field scales for CeGe1.76 are rather small, not exceding 10 kOe, suggesting certain fragility of the magnetic order in this material.
4 Summary
We presented results of a comprehensive study of thermodynamic and transport measurements on CeGe1.76 single crystals. Although formally it is an extreme member of the CeGe2-x family, the WDS data are consistent with CeGe1.75 or Ce4Ge7 and both resistivity data and magnetization loop data are consistent with a well ordered compound. This material has an enhanced electronic specific heat coefficient and two magnetic ordering transitions, at K and at K, and possibly a third one, at K that is observed as a small anomaly in a number of measurements. The ground state characterized by a possibly compex magnetic structure with a ferromagnetic component along the - axis corresponding to a magnetic moment of per Ce. The response of the CeGe1.76 to the applied magnetic field is anisotropic, with metamagnetism (spin reorientation) observed in both directions. This simple binary material is a good candidate for neutron scattering studies as well as for studies of the evolution of its magnetism under pressure. To some extent, CeGe1.76 has similarities to other Ce-based, reduced moment ferromagnets, like CeAgSb2 [30] and CeRu2Ge2 [31], the studies of which yield interesting results related to quantum phase transitions and strongly correlated behavior.
References
References
- [1] Matthias B T, Corenzwit E, Zachariasen W H, 1958 Phys. Rev. 112, 89.
- [2] Gladishevskii E I, 1959 Dopovidi Akad. Nauk Ukr. RSR 3, 294.
- [3] Gladyshevskii E I, 1964 Zh. Strukt. Khim. 5, 568.
- [4] Iandelli A, Palenzona A, 1979, in: Handbook on the Physics and Chemistry of Rare Earths, Vol 2, edited by Gschneidner Jr, K A, Eyring L (Amserdam: North Holland), p.1.
- [5] Schobinger - Papamantellos P, Buschow K H J, Janssen T, 1991 Phase Trans. 33, 133.
- [6] Yashima H, Satoh T, Mori H, Watanabe D, Ohtsuka T, 1982 Solid State Comm. 41, 1.
- [7] Mori H, Yashima H, Sato Nobuya, 1985 J. Low Temp. Phys. 58, 513.
- [8] Lin C L, Yuen Tan, Riseborough P, Huang X-Y, Li Jing, 2002 J. Appl. Phys. 91, 8117.
- [9] Eremenko V N, Shi Z K, Buyanov Yu I, Khar’kova A M, 1971 Porosk. Metall. 9, 46 [English Translation: 1971 Sov. Powder Metall. Met. Ceram. 10, 717 ].
- [10] Eremenko V N, Shi Z K, Buyanov Yu I, Khar’kova A M, 1972 Dop. Acad. Nauk Ukr. RSR B bf 34, 1080.
- [11] Gokhale A B, Abbaschian G J, 1989 Bull. Alloy Phase Diag. 10, 142.
- [12] Lambert-Andron B, Houssay E, Madar R, Hippert F, Pierre J, Auffret S, 1990 J. Less-Common Met. 167, 53.
- [13] Lambert-Andron B, Boutarek N, Pierre J, Madar R, 1994 J. Alloys Compd. 203, 1.
- [14] Venturini G, Ijjaali I, Malaman B, 1999 J. Alloys Compd. 289, 168.
- [15] Zan J A, Yuen Tan, Lin C L, Huang X-Y, Li Jing, 2003 J. Appl. Phys. 93, 8340.
- [16] Nakano Tomohito, Hedo Masato, Uwatoko Yoshiya, 2005 Physica B 359-361, 284.
- [17] Canfield P C, Fisk Z 1992 Philos. Mag. B 65, 1117.
- [18] Canfield Paul, in 2010 Properties and Applications of Complex Intermetallics, Book Series on Complex Metallic Alloys - Vol 2, edited by Berlin-Ferreé E (New Jersey: World Scientific), p.93.
- [19] Hunter B, in: (1998) IUCr CPD Newsletter 20, 21. (Howard C J, Hunter B A and Swinkels D A J 1997 Rietica IUCr Powder Diffr. 22 21) (Howard C J and Hunter B A 1998 A Computer Program for Rietveld Analysis of X-Ray and Neutron Powder Diffraction Patterns (NSW, Australia: Lucas Heights Research Laboratories) pp 1–27)
- [20] Mun E, Bud’ko S L, Torikachvili M S, Canfield P C, 2010 Meas. Sci. Technol. 21, 055104.
- [21] Schmiedeshoff G M, Lounsbury A W, Luna D J, Tracy S J, Schramm A J, Tozer S W, Correa V F, Hannahs S T, Murphy T P, Palm E C, Lacerda A H, Bud’ko S L, Canfield P C, Smith J L, Lashley J C and Cooley J C, 2006 Rev. Sci. Instrum. 77, 123907.
- [22] Mun E D, Bud’ko S L, Ko H, Miller G. J, Canfield P C, 2010 J. Magn. Magn. Mat. 322, 3527.
- [23] Fisher M E, Langer J S, 1968 Phys. Rev. Lett. 20, 665.
- [24] Kroeger F R, Swenson C A, 1977 J. Appl. Phys. 48, 853.
- [25] Bud’ko S L, Schmiedeshoff G M, Lapertot G, Canfield P C, 2006 J. Phys.: Cond. Mat. 18, 8353.
- [26] Barron T H K and White G K, 1999 Heat Capacity and Thermal Expansion at Low Temperatures (Kluwer Academic/Plenum, New York).
- [27] Colombier E, Knebel G, Salce B, Mun E D, Lin X, Bud’ko S L, Canfield P C, 2011 Phys. Rev. B 84, 064442.
- [28] Jaccard D, Basset A, Sierro J, and Pierre J, 1990 J. Low Temp. Phys. 80, 285.
- [29] Lahiouel R, Galera R M, Pierre J, Siaud E and Murani A P, 1987 J. Magn. Magn. Mat. 63-64, 98.
- [30] Myers K D, Bud’ko S L, Fisher I R, Islam Z, Kleinke Z H, Lacerda A H, Canfield P C, 1999 J. Magn. Magn. Mat. Materials 205, 27.
- [31] Raymond S, Haen P, Calemczuk R, Kambe S, Fåk B, Lejay P, Fukuhara T, Flouquet J, 1999 J. Phys.: Cond. Mat. 11, 5547.