Extended OVI haloes of starforming galaxies
Abstract
We consider evolution of metal-enriched gas exposed to a superposition of time-dependent radiation field of a nearby starburst galaxy and nearly invariant (on timescales 100 Myr) extragalactic ionization background. Within nonequilibrium (time-dependent) photoionization models we determine ionization fraction of the OVI ion commonly observed in galactic circumference. We derive then conditions for OVI to appear in absorptions in extended galactic haloes depending on the galactic mass and star formation rate. We have found that the maximum OVI fraction can reach under combined action of the galactic and the extragalactic ionizing radiation fields. We conclude that soft X-ray emission with eV from the stellar population of central starforming galaxies is the main source of such a high fraction of OVI. This circumstance can explain high column densities cm-2 observed in the haloes of starforming galaxies at low redshifts (Tumlinson et al., 2011) even for a relatively low ( ) metallicity. As a result, the requirements to the sources of oxygen in the extended haloes relax to a reasonably conservative level. We show that at ionization kinetics of oxygen in a relatively dense plasma cm-3 of outer halo exposed to a low extragalactic ionizing flux is dominated by nonequilibrium effects.
keywords:
galaxies: evolution – haloes – starburst – theory – diffuse radiation – intergalactic medium – quasars: general – absorption lines – physical data and processes: atomic processes1 Introduction
Strong OVI absorptions observed around starforming galaxies at with impact parameter as high as 150 kpc reveal huge gaseous galactic haloes (Tumlinson et al., 2011). Even conservative estimates lead to amount of gas in them far exceeding the gas reservoir in galaxies themselves. Such a conclusion is based on the assumption that gas in the haloes has solar metallicity. The arguments underlying this assumption stem from the standard estimate of oxygen mass from the observed column density (Tumlinson et al., 2011)
| (1) |
where a typical column density cm-2, the halo radius kpc, the hit rate correction factor (covering factor) are assumed following by Tumlinson et al. (2011), is atomic mass of oxygen. The fractional abundance of OVI under thermal collisional ionization equilibrium never exceeds (e.g. Ferland et al., 1998; Gnat & Sternberg, 2007), such that within this assumption Eq. (1) provides a lower estimate of oxygen mass in the halo (Tumlinson et al., 2011). It is readily seen from here that the mass , i.e. around 10 to 70% of oxygen mass in the ISM, is indeed a conservative estimate.
In principle, this conclusion for galactic haloes to bear such a large gas mass would might solve the problem of missing baryons and metals (Bregman et al., 2009; Pettini, 1999), though requiring enormously high oxygen production and mass ejection rates. Moreover, the fraction under collisional ionization equilibrium is kept only in a very narrow temperature range: K (e.g. Ferland et al., 1998; Gnat & Sternberg, 2007). It is therefore totally unrealistic to assume that all observed haloes keep their temperatures within such a narrow range independent on distance from the host galaxy.
In their estimates Tumlinson et al. (2011) used the ionic fractions calculated under collisional and/or photoionization equilibrium conditions, i.e. independent of time (Ferland et al., 1998). However, ionization state of gas situated in time-dependent (nonequilibrium) environment can differ qualitatively from the one settled on to equilibrium, particularly, for solar metallicity (Vasiliev, 2011). This difference can be smaller for low-density gas exposed to a strong ionizing field. However, in the process of galactic evolution both the magnitude and the shape of the radiation spectrum can change. In addition the extragalactic spectrum, which can be important on the periphery of galactic haloes, does also evolve (Haardt & Madau, 2001; Faucher-Giguére et al., 2009). Under such conditions it is natural to expect the ionic composition to experience time variations.
In this paper we therefore concentrate on the question of whether evolution of the ionizing radiation field can result in considerable changes of fractional ionization of oxygen such to make estimates of gas mass in galactic haloes more reliable. In next sections we will demonstrate that indeed under time-dependent conditions the observed column densities of OVI correspond to at least half order of magnitude less massive haloes, which can stay in a much wider range of physical parameters.
The paper is organized as follows. In Section 2 we describe the details of the model. In Section 3 we present our results. Section 4 summarizes the results.
2 Model description
Thermal and ionization state in our model is fully time-dependent: the model involves ionization and thermal evolution of gas located at radii kpc in the galactic halo, exposed to extragalactic and galactic time-dependent ionizing radiation field.
2.1 Time-dependent ionization
In this paper we only briefly touch main features of calculation of the ionization and thermal evolution of gas immersed into external time-dependent ionizing radiation. The details can be found in (Vasiliev, 2011). We study ionization and thermal evolution of a lagrangian gas element: a gas parcel is assumed to be optically thin to external ionizing radiation. In the calculations we include all ionization states of the elements H, He, C, N, O, Ne, Mg, Si and Fe. We take into account the following major processes: photoionization, multi-electron Auger ionization process, collisional ionization, radiative and dielectronic recombination, collisional excitation as well as charge transfer in collisions with hydrogen and helium atoms and ions.
The total cooling and heating rates are calculated using as a subroutine the photoionization code CLOUDY (ver. 10.00, Ferland et al., 1998). More specifically, we input into CLOUDY code a given set of all ionic fractions calculated at temperature , gas density and external ionization flux and obtain the corresponding cooling and heating rates. The latter also includes Compton heating from X-rays. For the solar metallicity we adopt the abundances reported by Asplund et al. (2005), except Ne for which the enhanced abundance is adopted (Drake & Testa, 2005). In all calculations we assume the helium mass fraction , which corresponds to [He/H]=0.081, and is close to the observed one (Izotov & Thuan, 1998).
We solve a set of 96 coupled equations (95 for ionization states and one for temperature) using a Variable-coefficient Ordinary Differential Equation solver (Brown et al., 1989). We considered the two regimes of gas evolution: isochoric and isobaric. The isochoric regime suggests that gas density in a cloud is kept constant, while in isobaric model gas pressure is assumed constant. The two regimes correspond to two opposite limits of the ratio between the cooling and the sound crossing times: and , correspondingly. In the external heating radiation field isobaric models show essentially similar thermal and ionization evolution, though on longer time scales due to decreasing density coupled to increasing temperature. It results in an increase of the cross-section of gas clouds such that their covering factor increases as well.
2.2 Galaxy evolution
In the process of galaxy evolution the stellar content changes: massive stars produce enormous number of UV photons and form ultimately compact objects which emit hard ionizing photons. Spectrum of the ionizing radiation escaping galactic interstellar medium (ISM) and exposing further the halo depends on amount of metals in the ISM disk absorbing ionizing photons, and thus on chemical evolution of the galaxy. In order to follow evolution of stellar mass, metallicity and galaxy spectrum, we use the spectro-photometric code PEGASE (Fioc & Rocca-Volmerange, 1997). We assume a Schmidt-like power-law starformation rate (SFR): , typical SFR for massive starforming galaxies, where is the normalized mass of gas in . In some regions of the galaxy SFR can be inhibited by gas outflows from the disk, however, when averaged over the whole disk the SFR remains sufficiently high over the whole period of active star formation. In our models we assumed a closed-box regime. In general, though this cannot be applied to galaxies with active star formation. However, many parameters related to mass and energy exchange between galaxies and the intergalactic medium, such as the rates of mass ejection from and mass accretion from the ambient medium, gas metallicity and corresponding cooling rate, clustering of SNe explosions, etc are highly uncertain and hard to be coherently described phenomenologically.
2.3 Time-dependent UV/X-ray backgrounds
Gas in galactic haloes is exposed by a cumulative ionizing background consisting of the extragalactic and the galactic components. The extragalactic component is uniform on galactic halo scales, and is nearly constant on timescales Myr, while changes significantly on longer times. For the extragalactic background we accept the spectrum described by Haardt & Madau (2001). Its evolution covers redshifts to divided by 49 equally spaced log bins. Contribution from possible flux sources varies over cosmological time, and irregular changes in different bands of the spectrum with redshift can be met. For this reason simple linear approximation between neighbour redshift bins was used.
The galactic component instead, may change on much shorter timescales. In general, the corresponding time scale is close to the lifetime of massive stars, i.e. Myr. This galactic radiation component originates in the central star forming region, and is seen from outer parts of the halo at distances kpc as a nearly spherical domain of size of kpc.
The ionizing radiation from stellar population is partly modified by absorption in the interstellar medium of underlying bulge and disk. In order to account this absorption we assume that ionizing photons pass through a layer of neutral gas in galactic disc with the optical depth , throughout the paper cm-2, cm-2 are considered as fiducial. The corresponding optical depths at the HI and HeI Lyman limits are as high as and , respectively. As a result only photons with eV escape the galaxy and penetrate into halo; the ionizing flux with photons of eV decreases as . In what follows we will discuss the dependence of our results on the HI column density.
In our model the galactic UV spectrum is calculated with making use the PEGASE code (Fioc & Rocca-Volmerange, 1997), which gives spectral luminosity in the range from 91Å to 160 m. In order to extend the spectrum to higher energies (up to eV, responsible for ionization of highly charged ionic species) we use the empirical relation between the X-ray luminosity and the star formation rate ‘’ (Gilfanov et al., 2004). This relation is well established for massive starforming galaxies considered here.
Overall the cumulative spectrum varies on time scales from several to hundreds of millions years.
2.4 Initial set up
We consider gas in outer haloes of massive (Milky Way type) starforming galaxies with stellar mass of several . Recent simulations of the Milky Way halo show that it extends up to the virial radius of the Milky Way (i.e., kpc) with densities ranging within cm-3 (Feldmann et al., 2013). Observational estimates of the circumgalactic gas density around the Milky Way and other Local Group galaxies give similar numbers cm-3 at kpc (Weiner & Williams, 1996; Grcevich & Putman, 2009; Quilis & Moore, 2001; Stanimirović et al., 2002; Anderson & Bregman, 2010). in our calculations we follow these numbers and set cm-3 in the circumgalactic volume. We consider both isochoric and isobaric regimes.
We start the calculations at (the lookback time is around 10 Gyrs). This timescale is nearly the cooling time for hot gas with K and cm-3 (Feldmann et al., 2013). The last major merging for Milky Way-type galaxies is thought to occur earlier than (e.g., Hammer et al., 2007).
The initial ionic composition and the temperature are set equal to the ones corresponding to photoequilibrium in gas exposed to the extragalactic Haardt & Madau spectrum at . Such radiation field is sufficient to force low density gas with in the accepted range to settle quickly onto photoequilibrium (Vasiliev, 2011). Calculations cover physical time scales much longer than the relaxation time scale of ionization and thermal processes in gas exposed to the time-dependent spectrum adopted here.
3 Results
3.1 SFR and spectral evolution
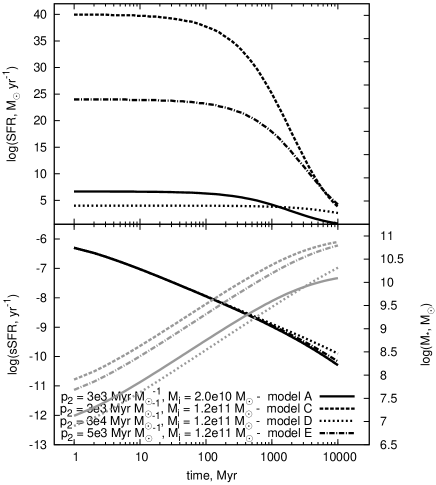
From the chemical evolution models calculated with the PEGASE code we obtain the time-dependent starformation rate, stellar mass, gas metallicity and spectral luminosity. We simulated several models corresponding to massive galaxies and chose two of them, whose parameters, namely the SFR and the stellar mass, are close to those of the starforming galaxies described by Tumlinson et al. (2011). With the accepted SFR law , where is the normalized mass of gas in and through the paper is assumed, the notations are as in (Fioc & Rocca-Volmerange, 1997). In total we consider four models. The first two suggest a fixed normalization factor Myr , and two different values of the initial gaseous mass: – model A, and – model C. The other two models assume a fixed initial gaseous mass , and two different normalization constants : one with Myr – model D, and the other with Myr – model E.
Figure 1 presents the star formation rate, , the specific starformation rate, , and the stellar mass, : model A (solid line), model C (dashed line), model D (dotted line) and model E (dash-dotted line). Two features are to note: first, the sSFR reveals differences between the models only after several hundreds of Myrs, and second, models A and C show practically equal sSFR, and as a result gas in these models is equally converted into stars by Gyr. Instead, model D ( Myr ) leaves the galaxies gas-rich – only % of gaseous mass exhausts by this time. The characteristic time for the gas to exhaust is , which gives Myr for all considered models, resulting in a §nearly constant SFR (upper panel in Figure 1) over first 200 Myr with the SFR, and decreasing on later times as SFR.
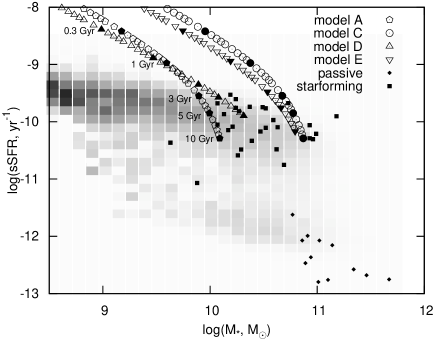
Figure 2 shows the dependence of specific starformation rate on the stellar mass for the models A (pentagons), C (circles), D (up-triangles) and E (down-triangles). Filled large symbols mark time moments shown nearby. Data for the starforming and passive galaxies studied by Tumlinson et al. (2011) are depicted by small squares and rhombs, correspondingly. The grey-scale map shows SDSS+GALEX galaxies (Schiminovich et al., 2007). It is readily seen that almost all points for the starforming galaxies are locked between tracks of the models considered here. One can expect therefore that spectral properties of starforming galaxies from Tumlinson et al. (2011) are similar to those in the models A and C during the latest 3-4 Gyrs of their evolution. Passive galaxies have an order of magnitude lower sSFR.
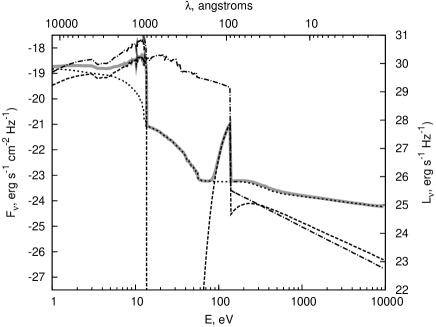
Dash-doted line in Figure 3 shows the galactic spectral luminosity at Gyr, which is equal time elapsed from to 0.2. A significant break is clearly seen at the wavelength 91 Å, which corresponds to the minimum wavelength in the spectrum reached in the PEGASE code111 The cut at 91 Å in the galactic spectral energy distribution (SED) generated by the stellar population codes (e.g. PEGASE, Starburst99, Galaxev) is apparently due to a choice of the developers and might be partly connected with the availability of spectral data in stellar libraries. The stellar library calculated by Rauch (2003) contains spectra up to 1 Å is not included yet into stellar population codes. It is worth also noting in this connection considerable deviations of the spectral distribution above 228 Å predicted by different stellar population codes (Kewley et al., 2001). In this sense our conclusions may depend on our choice of the stellar population code and, particularly, on the cut at 91 Å. In Section 3.3 we discuss stability of our results against possible variations of the galactic SED, and influence of the cut at 91 Å on the ionization and thermal evolution of the circumgalactic gas. . The break is due to an exponential decrease of the number of such hard photons emitted by stellar population (see e.g. Rauch, 2003), as they are only produced by very massive stars, whose number is very small. As soon as we consider galactic evolution on timescales longer than 1-3 Gyr X-ray binaries are expected to have already formed, and we extend the spectrum to higher energies assuming the empirical relation between X-ray luminosity and star-formation rate “” (Gilfanov et al., 2004).
By the thick grey line Figure 3 shows also an example of the total spectral radiation flux exposing a given gas parcel located at distance kpc from the galaxy evolved till . The total spectrum consists of the galactic (dash line) and extragalactic (dotted line) ionizing photons. At low energies, eV, the extragalactic contribution dominates at large distances, kpc, while the stellar population turns into play in UV range at smaller distances. Strong absorption of the galactic ionizing photons ( eV) in the galactic disk with the fiducial and values results in the total dependence of the ionic composition of halo gas on the extragalactic background. The significance of absorption by the galactic disk can be understood from comparison of the galactic spectral luminosity shown by dash-dotted line and the cumulative flux (thick grey line).
A narrow bump at eV is due to the galactic photons survived against absorption in thick disk. Its magnitude is obviously determined by our choice of the neutral column densities and in the disk. For the fiducial values of and the optical depth is about 3 for photons with eV. Higher column densities can erase the bump and the extragalactic flux becomes dominating in the whole galactic halo. Decrease of the galactic contribution is also seen at larger distances from the galaxy due to dilution . Note that the ionization potential of OV, eV falls exactly in this the range eV. This means that the fraction of OVI ions can increase in galaxies with lower column densities ( and ) in their disks.

In general, the excess of galactic photons with energies higher than 113.9 eV contributes crucially into ionization kinetics of OVI ion. Figure 4 presents the ratio of monochromatic galactic and extragalactic fluxes at 113.9 eV (solid lines) in model A for our fiducial column densities and . It is clearly seen that the galactic flux dominates within kpc at redshifts . At lower redshifts the region of predominance of galactic flux widens mostly due to a steep decrease of the extragalactic flux in these epochs. The monochromatic radiation at the HI Lyman limit is fully absorbed in the disk for the fiducial and column densities.
In order to estimate both the escape of HI ionizing photons and the efficiency of OV ionization we calculate radial dependences of the ratios of ionizing fluxes and , where the superscipts ’g’ and ’e’ refer to the galactic and extragalactic contributions. Figure 4 shows these ratios at and 0.2 for model A. In the energy range eV the galactic contribution dominates up to distance kpc at , and extends even to kpc at due to strong decrease of the extragalactic background at low redshifts. It is obvious, that increase of ionizing flux enlarges radius of the zone of predominance of galactic ionizing photons: for instance, this zone increases from kpc in model A to kpc in model C at . Decrease of absorption in the disk does also promote the zone of the galactic predominance to grow: it reaches kpc for cm-2 even in model A.
3.2 Thermal and ionization evolution
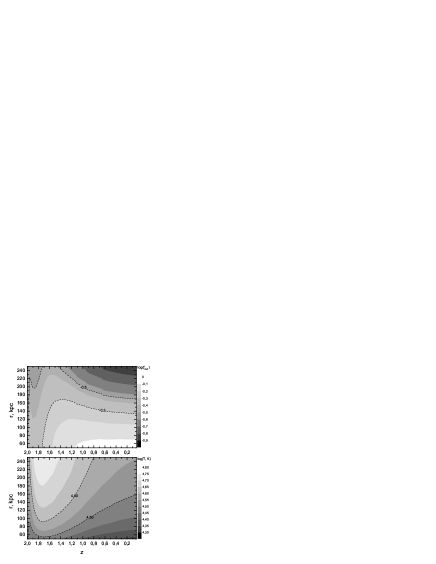
Figure 5 shows evolution of temperature (lower panel) and OVI fraction (upper panel) in gas located at different distances from the galactic center; here we assume the SFR as in model A and our fiducial column densities and .
In the beginning, , oxygen is mainly locked in the OVII state due to high ionizing flux. Its fraction establishes around under the influence of the extragalactic ionizing background. After several hundreds million years the extragalactic background starts decreasing following the cosmic star formation rate. It should result in a quick transition from OVII to OVI. In a cooling plasma OVI recombines rapidly into lower ionization states and practically disappears shortly – a well-known OVI “fragility”. However, in our case the excess of photons with eV emitted by starforming galaxies does not allow OVI to recombine. Consequently, its fraction remains almost frozen at the level in the region kpc over the range till 0. In our models reaches in a low-metallicity () gas within kpc from to . This value is several times higher than the maximum OVI fraction, , reached in gas exposed only to the extragalactic background (e.g. Ferland et al., 1998; Gnat & Sternberg, 2007), and in nonequilibrium collisional gas evolved from K (see e.g. Gnat & Sternberg, 2007). Note that even at large distances kpc remains higher than . The temperature of gas with such high OVI fraction is within K (see lower panel in Figure 5). The dependence of on metallicity is weak: for instance, OVI fraction in gas with is within distances kpc in model A.
Cooling of gas with exposed only to the extragalactic background is mainly due to hydrogen and helium, whereas metals (oxygen and carbon) play a minor role in radiation losses (e.g. Wiersma et al., 2009; Vasiliev, 2011). A considerable increase of OVI fraction in the zones where galactic ionization dominates enhances the contribution of oxygen into cooling. As a result, gas temperature is lower in these regions as seen on the lower panel in Figure 5.
Deviation of column densities from the fiducial values accepted above may result in a considerable change of the overall picture due to changes of the interrelation between the fractions of galactic and extragalactic ionizing photons. In order to understand how sensitive is the oxygen ionization state to surface density of the underlying galactic gaseous discs we calculate several models with different and . For simplicity we assume that .
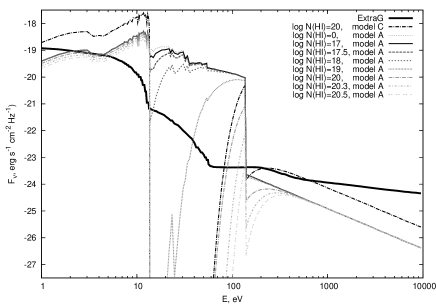
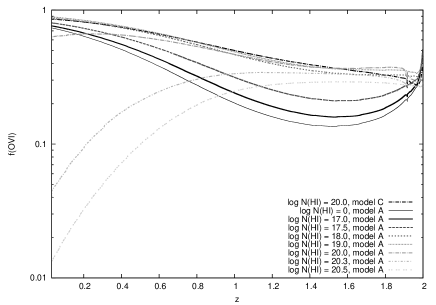
Figure 6 presents the galactic part of the spectrum at distance kpc and redshift for several values (upper panel), and the evolution of OVI fraction in gas exposed to this radiation field (lower panel). For column density cm-2 the galactic spectrum in model A is fully absorbed in the range 13.6-80 eV. Only for a hundredth of this column density the attenuation becomes less depressing. A lower column density cm-2 allows a higher fraction of ionizing photons with the energy above the ionization potential of OV (113 eV) to penetrate into the halo and support a higher fraction of OVI (lower panel): the OVI fraction reaches and slightly increases for lower column densities. This value is considerably higher than in collisionally ionized gas and in gas photoionized only by the extragalactic background. The reason for such a high fraction of OVI is in the break at the energy slightly lower than the OVI ionization potential (136 eV). It is worth noting that the uncertainty of the spectral energy distribution in this energy range within stellar population codes is rather high. This partly stems from the stellar atmosphere models and the rarity of extremely massive stars (Rauch, 2003). On one hand this is a shortcoming of our model, though on the other, the rarity of massive stars and their short lifetime allows us to think that stellar contribution into circumgalactic ionizing field falls steeply down at energies eV (see the spectra of the hottest stars in Rauch, 2003), which is lower than the OVI ionization potential (136 eV). However it is important to note that that the predominance of galactic flux over the extragalactic background in the range around 110-130 eV results in OVI fraction as high as 0.6-0.8. Higher HI column density in underlying galactic discs, cm-2, heavily erases galactic flux in the range eV, which, for instance in Model A becomes lower than the extragalactic background and the effect of an enhanced OVI fraction vanishes.
3.3 Stability against spectral variations at 91 Å
It is obviously clear from discussion in Section 3.2 that the enhanced OVI fraction is mainly due to the excess of galactic photons with eV in the bump at eV. This bump maintains the OVI fraction at high level and keeps them against recombination to lower ionic states. The left border of this spectral feature, formed by to strong absorption of the galactic ionizing radiation in the disc, is irrelevant from the point of view of the maintainance of OVI – even in the absence of any absorption it remains enhanced (see Figure 6). The right edge of the bump is, however, artificial in origin: as a matter of fact, the cut at 136 eV (91 Å) is a choice of the developers of stellar population codes (e.g. PEGASE, Starburst99, Galaxev). Therefore, in the following we discuss convergence of our results against possible galactic spectral variations at energy higher than 136 eV.
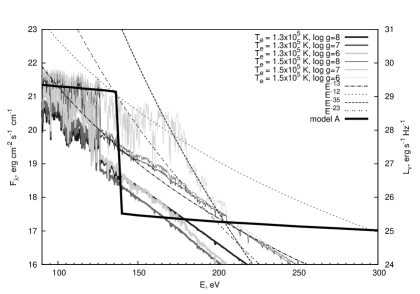
Extreme ultraviolet and soft X-ray photons ( eV) can be produced by post-AGB stars before entering the white dwarf cooling phase (e.g. Werner et al., 1997). During this very bright evolution phase lasting yrs the effective temperature may reach more than K, while the surface gravity varies as to cm s-2. Figure 7 (upper panel) presents the two spectra for K and K for solar metallicity taken from the stellar library (Rauch, 2003)222 This is up to now the most complete library which contains spectra up to 1 Å for hot compact stars.. It is seen that the amount of photons with eV increases when the surface gravity decreases from to cm s-2 for K. On the other hand even a small decrease of effective temperature results in a shortage of photons with eV independent on . The majority of observed post-AGB stars is known to have masses below and temperatures to K (e.g. Werner et al., 1997), thus falling into the range shown here. For several spectra a break around eV is clearly seen. One can think that in order to conservatively account this break in stellar population codes the value 136 eV (91 Å) was choosen as an upper limit of energy in their stellar library. It is clearly seen though that even the spectra with a break at eV continue up to eV and do not show such a strong decrease of flux at eV as used in our calculations. One can think that this gradually decreasing flux above eV produces qualitatively similar effects as does the flux with the break at eV.
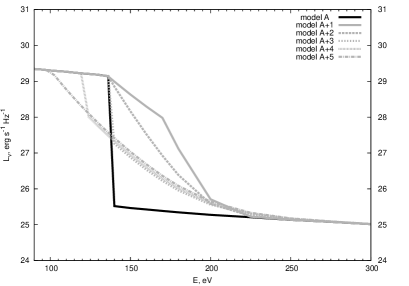
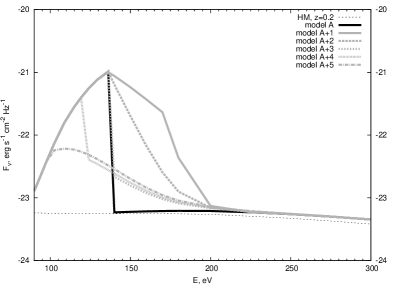
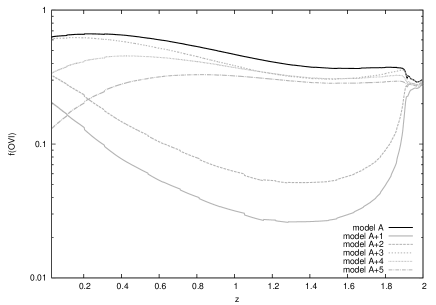
In order to check this tentative conclusion we performed calculations of ionic composition for several models of the ionizing flux above 136 eV we construct several spectra and test the appearence of enhanced OVI fraction. We smooth the spectra calculated in PEGASE code at energies eV and match them at eV to the spectrum obtained from the “” relation as described in Section 2.3 (see Gilfanov et al., 2004). We proceed in the manner that the resulting spectrum would be qualitatively close to the spectra depicted in the upper panel. Figure 7 (middle panel) shows these spectra normalized on the spectral luminosity in model A. We calculate the ionization and thermal evolution of gas exposed to a cumulative spectrum which includes the extragalactic and the galactic radiation field. Figure 7 (bottom panel) presents an example of the cumulative ionizing background flux at a distance kpc from the galaxy in models A, A+1..A+5 located at a redshift (thick lines). Figure 8 shows evolution of OVI fraction in gas exposed to the ionizing flux as in models A, A+1..A+5. It is readily seen that in all A+ models the OVI fraction is greater than 0.1 at redshifts . The OVI fraction is several times lower than in model A, but this is still obviously higher than , which establishes in gas exposed only to the extragalactic radiation (compare to the dot-dot line for log N(HI)=20.5 in lower panel of Figure 6). In models A+1 and A+2 oxygen at is mainly locked in OVII ions. Starting from the ionization production rate of OVII ions decreases such that recombinations become efficient to replenish lower ionization states, and as a result the fraction of OVI increases at substantially: from at to in A+1 and in A+2 at . This balance between OVII and OVI is kept then quasi-steady down to . At large distances the contribution from galactic photons decreases resulting in a higher fraction of OVI in models A+1 and A+2. Note that contrary to models A+1 and A+2 the flux in model A+5 is low and oxygen accumulates mostly in OIV-OV states.
Higher galactic luminosities presented in a set of models C and C+3..C+5, result in a higher OVI fraction: in gas located at kpc at . However, in models C+1 and C+2 the ionization flux at eV is excessive and the fraction of OVI decreases to 0.03 and 0.07 at , and reaches only 0.05 and 0.1, at . At larger distances from a galaxy where the flux drops models C+1 and C+2 show an increase of OVI fraction: e.g., in model C+1 it increases to (0.11) at 150 kpc and (0.17) at 200 kpc at ().
It is readily seen thus that in the majority of these models OVI fraction remains high and reaches at distance kpc from a galaxy located at . This is more than an order of magnitude higher than can be reached in gas exposed only to the extragalactic radiation at . In model C+1 the OVI fraction reaches 0.1 only for kpc (), while at closer distances most of oxygen is confined into OVII. It is worth stressing though that the model C+1 can be considered as a model with an extreme possible contribution from post-AGB stars, in the sense that models with harder spectrum are unlikely (e.g. Werner et al., 1997), thus one can expect that within conservative models of galactic X-ray spectrum the effect of enhanced OVI remains stable.
3.4 OVI in galactic haloes
In the previous section we have found that OVI fraction can reach high values of under the action of ionizing radiation from the underlying galactic stellar population along with the extragalactic radiation field. Such OVI fraction is at least an order higher than the maximum reached in commonly used models with gas ionized collisionally and/or by the extragalactic radiation. Assuming the spherical symmetry and using the time-dependent OVI radial distribution around a host galaxy one can find the OVI column densities along the line of sight crossing the galactic halo at impact parameter . We integrate from kpc to 300 kpc.


Figure 9 (upper panel) presents the dependence of on impact parameter in a isochoric gas within the models A and C. The OVI column density ranges from to cm-2 at the impact parameter kpc – a factor of 3-10 higher than observed by Tumlinson et al. (2011). Therefore circumgalactic gas of an order of magnitude lower metallicity would provide good agreement with observations as shown in Figure 10 (upper panel). It is worth noting though that spatial distribution of metals in circumgalactic environment is highly nonhomogeneous (e.g. Simcoe et al., 2006; Dedikov & Shchekinov, 2004), and it is most likely for metals to be locked in clumps of smaller covering factor resulting in a proportional decrease of the column density.
Figure 9 (middle and lower panels) show the column density of OVI in isobaric gas with the initial density and cm-3, respectively. Isobaric regime is supported by radiation losses and heating from ionizing radiation. Photo-heating grows at large distances from the galaxy, kpc where contribution from OVI ions to cooling decreases. At lower distances OVI fraction increases and it becomes a dominant coolant resulting in a rather efficient cooling. Consequently, column densities grow under isobaric compression: can reach cm-2 for the initial density cm-3, and cm-2 for cm-3. Similarly to the isochoric case gas with lower metallicity (0.01 ) fits observational data better.
Such high column densities are reached for galactic spectra with a cut at 91 Å (see footnote in Section 3.1). In reality though galactic spectra do not show such sharp breaks. In Section 3.3 we considered galactic spectra approximated smoothly around eV to account possible variations of contribution from post-AGB stars. We have found that in the low redshift range, , OVI fraction in gas exposed to such approximated spectra remains sufficiently high in the majority of models considered here. In all cases we have a considerable (an order of magnitude) excess of the column densities caluculated in models A, C and with respect to the observed ones as seen in Figure 9).
Tumlinson et al. (2011) have argued that the circumgalactic medium can be a significant reservoir of the ejected material from galaxies. In order to explain large column densities of OVI observed in the haloes they have had to assume that the circumgalactic gas has nearly solar metallicity. This assumption meets though difficulties because the minimum oxygen mass in the halo obtained within such an assumption reaches around 10-70% of the total oxygen mass in the ISM (Tumlinson et al., 2011), which requires in turn unprecedentedly high mass exchange between the galactic ISM disk and a huge circumgalactic reservoir extending up to 150 kpc. Higher OVI fraction obtained in our model reduces the estimates to a more reasonable level, and as a consequence weakens constrains on the sources of oxygen in underlying galaxies.
Contrary, an order of magnitude lower metallicity results in a more consistent scenario of metal production and mass exchange between galactic and circumgalactic gas. Indeed, the total mass of the circumgalactic gas in OVI haloes within kpc is about independent on redshift as estimated from HI data (Prochaska et al., 2011; Steidel, et al., 2010). If such gas would be enriched to the metallicity as high as , then the oxygen mass in it equals . This amount can be produced during a 0.2 Gyr period in a galaxy with SFR (as in our model A), with 0.015 of oxygen returned to the ISM per each 1 star formed (e.g., Thomas et al., 1998). This timescale is significantly shorter than the whole period of the evolution – several Gyrs, and comparable to the initial period of evolution in our models with the SFR kept nearly constant (upper panel on Figure 1). Because of the high SFR during initial several hundreds Myrs, gas can be ejected from the disk with velocities km/s sufficient to reach 100 kpc in approximately 1 Gyr. We assumed throughout that metals are honogeneously distributed in a spherical layer between 50 and 300 kpc. This can be an overestimate, because in general the volume occupied by ejected metals depends on the galaxy mass and for dwarf galaxies can be smaller (e.g. Ferrara et al., 2000). Moreover, metals are locked most likely into small-size dense fragments (e.g. Simcoe et al., 2006), where radiative cooling is efficient. It can result in a rapid cooling and compression and make such fragments to escape detection. Dwarf satellites may add metals in the halo, though their contribution is apparently small because of low metallicity in their ISM: (e.g., Salvadori & Ferrara, 2009; Ryabova & Shchekinov, 2011) and massive dwarfs are rare (e.g., Koposov et al., 2008).
3.5 OVI in galactic haloes: photoequilibrium
In extended galactic haloes gas with a low density, cm-3, is exposed to rather a high ionizing background consisting of galactic and extragalactic components. Under such conditions the ionic state may reach photoequilibrium333 The analysis, when collisions become significant compared to photoionization, is out of scope of this paper, details can be found in (Vasiliev, 2011). Ionic composition under photoequilibrium is calculated with making use the CLOUDY. We assume the time-dependent ionizing background described in Section 2.3. The difference between our calculations and the ones performed by Tumlinson et al. (2011), is that besides the Haardt-Madau extragalactic radiation field used in (Tumlinson et al., 2011) we add the galactic contribution, which as we showed above may have crucial consequences: the excess of photons with eV from the underlying stellar population competes the extragalactic radiation, while X-ray photons in the excess with eV substantially enhance OVI fraction (Section 3.2).
For the fiducial column densities cm-2 and cm-2 OVI fraction in photoequilibrium is several magnitudes smaller than in our time-dependent models. In photoequilibrium oxygen is mainly locked in less ionized states, OIV-OV, and OVI column density drops to cm-2. When and decrease the fraction of OVI instead increases. Even for cm-2 (here is assumed) the OVI column density reaches cm-2 at the impact distances kpc and . Further decrease of results in OVI fraction to grow up to , and consequently in higher OVI column densities.
Figure 11 presents the dependence of the OVI column density on the impact parameter for photoequilibrium model with cm-2 and time-dependent model with cm-2. The clearly seen considerable difference between photoequilibrium and time-dependent models originates from a well-known fact that gas under nonequilibrium conditions is overionized with respect to what occurs under equilibrium (e.g. Gnat & Sternberg, 2007; Suchkov & Shchekinov, 1984; Vasiliev, 2011). When decreases, the absorption of galactic ionizing radiation falls down and the peak in the spectrum around eV grows. At such conditions photoionization time shortens, , and the ionic composition approaches photoequilibrium. At low the extragalactic flux decreases: for example, for erg s-1 cm-2 Hz-1 at eV (Figure 6). As a result the phoionization timescale of OVI ions increases up to several hundreds Myr, here cm-2 and are assumed; eV is the OVI ionization potential and is the width of the peak between 113-136 eV. This is about several times shorter than the recombination time for gas with cm-3 making nonequilibrium effects important.
Smaller absorption in the galactic disc provides higher galactic ionizing flux and shorter photoionization timescale such that ionic composition shifts to photoequilibrium. Thus, nonequilibrium effects are important for OVI ionization kinetics in the circumgalactic gas with cm-3 at . t is therefore can be concluded that the main factor which provides high OVI column densities in massive starforming galaxies at low and moderate metallicities is the excess of photons with energies 113-130 eV from the stellar population of a host galaxy.

4 Conclusions
In this paper we have presented the photoequilibrium and nonequilibrium (time-dependent) ionization and thermal state of circumgalactic gas located at distances up to kpc around starforming galaxies, and exposed to both extragalactic and galactic time-dependent ionizing background. For the extragalactic background we considered the spectra obtained by Haardt & Madau (2001). Using the PEGASE code (Fioc & Rocca-Volmerange, 1997) we have calculated chemical and spectro-photometric evolution of galaxies, and have chosen the two models, whose specific star formation rate () and stellar masses are close to the starforming galaxies with large OVI column densities observed in Tumlinson et al. (2011).
We have found that
-
•
the maximum OVI fraction can reach under physical conditions (gas density and metallicity, and the spectrum shape), which are typical in haloes of starforming galaxies; such a high OVI fraction is due to galactic photons with eV; the effect of enhanced OVI remains stable within conservative models of galactic X-ray spectrum fluctuations at eV;
-
•
due to such high fraction of OVI its column density ranges in cm-2 even for a low metallicity , and cm-2 for at impact parameters up to kpc; this results in several times more conservative estimate of the oxygen mass in haloes compared to (Tumlinson et al., 2011).
-
•
we have shown therefore that the large OVI column densities observed in haloes of starforming galaxies (Tumlinson et al., 2011) can be found in circumgalactic conditions with nearly 0.01-0.1 of solar metallicity, and correspondingly the requirements to the sources of oxygen in the extended haloes become reasonably conservative.
High OVI column densities in haloes of starforming galaxies can emerge under photoequilibrium as well as under nonequilibrium conditions. The main source is a high radiation flux of photons with eV from the stellar population of starforming galaxies. Nonequilibrium effects for OVI ionization kinetics are important in the circumgalactic environment with cm-3 at .
Very recently Lehner et al. (2014) have reported about high OVI column densities in the circumgalactic medium at with reaching cm-2; the observational sample includes absorbers of different type: from Lyman limit to damped Ly systems. From our point of view such a high OVI column density can be due to the excess of galactic ionizing photons with eV over the extragalactic background, while the metallicity might be rather low.
5 Acknowledgements
We thank Jason Tumlinson for providing data and discussion, and the anonymous referee for valuable comments and pointing to a mistake. This work is supported by the RFBR through the grants 12-02-00365, 12-02-00917, 12-02-92704, and by the Russian Federal Task Program ”Research and operations on priority directions of development of the science and technology complex of Russia for 2009-2013” (state contracts 14.A18.21.1304, 2.5641.2011 and 14.A18.21.1179). EV is grateful for support from the ”Dynasty” foundation.
References
- Anderson & Bregman (2010) Anderson M.E. & Bregman J.N., 2010, ApJ, 714, 320
- Asplund et al. (2005) Asplund, M., Grevesse, N., & Sauval, A. J. 2005, in ASP Conf. Ser. 336, Cosmic Abundances as Records of Stellar Evolution and Nucleosynthesis, ed. T. G. Barnes III & F. N. Bash (San Francisco: ASP), 25
- Bregman et al. (2009) Bregman J.N., Canizares C. R., Cen R., de Herder J-W., Bonamente M. et al. , 2009, Astro2010: The Astronomy and Astrophysics Decadal Survey, Science White Papers, no. 24, arXiv:0906.4984
- Brown et al. (1989) Brown P. N., Byrne G. D., & Hindmarsh A. C., 1989, SIAM J. Sci. Stat. Comput., 10, 1038
- Cowie et al. (1995) Cowie L. L., Songaila A., Kim T.-S., & Hu E. M. 1995, AJ, 109, 1522
- Dedikov & Shchekinov (2004) Dedikov S.Yu., Shchekinov Yu.A., 2004, Astr. Rep., 48, 9
- D’Odorico et al. (2010) D’Odorico V., Calura F., Cristiani S., & Viel M. 2010, MNRAS, 401, 2715
- Drake & Testa (2005) Drake J. J. & Testa P., 2005, Nature, 436, 525
- Faucher-Giguére et al. (2009) Faucher-Giguére C.-A., Lidz A., Zaldarriaga M., Hernquist L., 2009, ApJ 703, 1416
- Feldmann et al. (2013) Feldmann R., Hooper D., Gnedin N.Y., 2013, ApJ, 763, 21
- Ferrara et al. (2000) Ferrara A., Pettini M., Shchekinov Yu.A., 2000, MNRAS, 319, 539
- Ferland et al. (1998) Ferland G. J., Korista K. T., Verner D. A., Ferguson J. W., Kingdon J. B. & Verner E. M. 1998, PASP, 110, 761
- Fioc & Rocca-Volmerange (1997) Fioc M. & Rocca-Volmerange B., 1997, A&A, 326, 950
- Gilfanov et al. (2004) Gilfanov M., Grimm H.-J., Sunyaev R., 2004, MNRAS, 347, L57
- Gnat & Sternberg (2007) Gnat O. & Sternberg A., 2007, ApJS, 168, 213
- Grcevich & Putman (2009) Grcevich J. & Putman M.E., 2009, ApJ, 696, 385
- Haardt & Madau (2001) Haardt F. & Madau P., 2001, in Clusters of Galaxies and the High Redshift Universe Observed in X-rays, ed. D. M. Neumann & J. T. V. Tran, astro-ph/0106018
- Hammer et al. (2007) Hammer F., Puech M., Chemin L., Flores H., Lehnert M.D., 2007, ApJ, 662, 322
- Izotov & Thuan (1998) Izotov Yu.I. & Thuan T.X., 1998, ApJ, 500, 188
- Kewley et al. (2001) Kewley L.J., Dopita M.A., Sutherland R.S., Heisler C.A., Trevena J., 2001, ApJ, 556, 121
- Koposov et al. (2008) Koposov S., et al. 2008, ApJ, 686, 279
- Lehner et al. (2014) Lehner N., et al. 2014, ApJ, 788, 119, arXiv:1401.1811
- Pettini (1999) Pettini M, 1999, in the Proceedings of the ESO Workshop ‘Chemical Evolution from Zero to High Redshift’. Eds. J. R. Walsh, M. R. Rosa. Berlin: Springer-Verlag, p. 233
- Prochaska et al. (2011) Prochaska J.X., Weiner B., Chen H.-W., Mulchaey J.S., Cooksey K.L., 2011, ApJ, 740, 91
- Rauch (2003) Rauch T., 2003, A&A, 403, 709
- Ryabova & Shchekinov (2011) Ryabova M.V. & Shchekinov Yu.A., 2011, Ast. Rep., 55, 577
- Quilis & Moore (2001) Quilis V. & Moore B., 2001, ApJ, 555, L95
- Salvadori & Ferrara (2009) Salvadori S., Ferrara A., 2009, MNRAS Lett., 395, 6
- Savaglio (2009) Savaglio S., 2009, in: Chemical Abundances in the Universe, K. Cunha, M. Spite & B. Barbuy, eds., IAU Symp No 265
- Schiminovich et al. (2007) Schiminovich D. et al. 2007, ApJSS, 173, 315
- Simcoe et al. (2006) Simcoe R.A., Sargent W.L.W., Rauch M., Becker G., 2006, ApJ, 637, 648
- Stanimirović et al. (2002) Stanimirović S., Dickey J.M. Krćo M. & Brooks A.M., 2002, ApJ, 576, 773
- Steidel, et al. (2010) Steidel C.C., et al. 2010, ApJ, 717, 289
- Suchkov & Shchekinov (1984) Suchkov A. A., Shchekinov Yu. A., 1984, SvAL, 10, 13
- Thomas et al. (1998) Thomas D., Greggio L., Bender R., 1998, MNRAS, 296, 119
- Tumlinson et al. (2011) Tumlinson J. et al. 2011, Science, 334, 948
- Vasiliev (2011) Vasiliev E. O., 2011, MNRAS, 414, 3145
- Weiner & Williams (1996) Weiner B.J. & Williams T.B., 1996, AJ, 111, 1156
- Werner et al. (1997) Werner K. et al. 1997, Rev. Mod. Astron., 10, 219
- Wiersma et al. (2009) Wiersma R., Schaye J., Smith B.D., 2009, MNRAS, 393, 99