Quiescent state and outburst evolution of SGR 0501+4516
Abstract
We report on the quiescent state of the Soft Gamma Repeater SGR 0501+4516 observed by XMM–Newton on 2009 August 30. The source exhibits an absorbed flux 75 times lower than that measured at the peak of the 2008 outburst, and a rather soft spectrum, with the same value of the blackbody temperature observed with ROSAT back in 1992. This new observation is put into the context of all existing X-ray data since its discovery in August 2008, allowing us to complete the study of the timing and spectral evolution of the source from outburst until its quiescent state. The set of deep XMM–Newton observations performed during the few-years timescale of its outburst allows us to monitor the spectral characteristics of this magnetar as a function of its rotational period, and their evolution along these years. After the first days, the initially hot and bright surface spot progressively cooled down during the decay. We discuss the behaviour of this magnetar in the context of its simulated secular evolution, inferring a plausible dipolar field at birth of G, and a current (magneto-thermal) age of kyr.
keywords:
stars: pulsars: general — pulsar: individual: SGR 0501+4516| Parameters | 2008-08-23 | 2008-08-29 | 2008-08-31 | 2008-09-02 | 2008-09-30 | 2009-08-30 |
|---|---|---|---|---|---|---|
| Start (UT) | 01:07:36 | 07:10:28 | 12:09:45 | 10:00:38 | 02:18:44 | 14:45:41 |
| End (UT) | 14:35:33 | 13:58:20 | 14:59:58 | 15:41:49 | 11:22:15 | 05:47:52 |
| Exposure (ks) | 48.9 | 24.9 | 10.2 | 20.5 | 31.0 | 37.8 |
| Counts/s | ||||||
| P. Period (s) | 5.7620694(1) | 5.7620730(1) | 5.7620742(1) | 5.7620754(1) | 5.7620917(1) | 5.7622571(2) |
| P. Fraction (%) | 41(1) | 35(1) | 38(1) | 38(1) | 43(1) | 45(6) |
| N. bursts | 80 | 2 | 0 | 0 | 0 | 0 |
1 Introduction
Magnetars are isolated neutron stars with a persistent X-ray emission of erg s-1, rotating at spin periods of s and with large period derivatives (s s-1) in respect to radio pulsars. Occasionally these objects also emit bursts and outbursts. Anomalous X-ray Pulsars (AXPs) and Soft Gamma Repeaters (SGRs) are two observational manifestations of magnetars. The radiation observed from these objects is believed to be powered by the decay of their strong magnetic fields (see Mereghetti, 2008, and Rea & Esposito 2011 for recent reviews).
SGRs are characterized by periods of activity during which they emit short bursts in the hard X-ray/soft gamma-ray energy range ( s; erg/s). In addition, they have been observed to emit intermediate flares, with typical durations of s and luminosities of erg/s, and rarely Giant Flares ( s, and peak luminosities larger than erg/s) (Mereghetti, 2008, and references therein). The frequent short bursts are supposed to be associated either with small cracks in the neutron star crust due to magnetic diffusion or with tearing instabilities produced by the sudden loss of magnetic equilibrium, while the intermediate flares can arise from heating of the corona by magnetic reconnection in the stellar magnetosphere (Thompson Duncan 1995; Lyubarsky, 2002). The giant flares would be linked to global rearrangements of the magnetic field in the neutron stars magnetosphere and interior (Thompson Duncan 1995).
Magnetar persistent X-ray emission is usually characterized by a soft (– 10 keV) X-ray component interpreted as due to thermal photons emitted from the surface which undergo resonant cyclotron scattering onto mildly relativistic electrons flowing in the magnetosphere (Thompson et al. 2002). In some cases, a hard X-ray component extending up to keV has been observed, possibly due to the same up-scattering process but on a population of more energetic electrons (Baring et al. 2007, Beloborodov et al. 2007, Nobili et al. 2008, Beloborodov 2013). The soft X-ray component (on which this paper focuses) is generally fitted with either a blackbody with a temperature kT0.3–0.6 keV and a power-law with 2–4, or two blackbodies (kT0.3 keV and kT0.7 keV) (Mereghetti, 2008), while the hard X-ray component is modelled by a power-law spectrum of an index of 0.5–1.5.
SGR 0501+4516 was discovered on 2008 August 22 by Swift-BAT in correspondence to a series of short X-ray bursts and intermediate flares (Holland et al., 2008; Barthelmy et al., 2008). X-ray pulsations at a period of 5.7 s were observed by RXTE (Gogus et al., 2008) and an estimate of the surface dipolar magnetic field (at the pole) G was obtained from its period and spin-down rate (Woods et al., 2008; Rea et al., 2009; Göğüş et al., 2010). Detailed studies of SGR 0501+4516 in the X-rays have been published by Rea et al. (2009), Göğüş et al. (2010), and Kumar et al. (2010). Radio observations did not reveal any emission in the first days after the beginning of the outburst (Hessels et al., 2008; Kulkarni and Frail, 2008; Gelfand et al., 2008), remaining undetected afterwards. An optical/infrared counterpart has been identified (Tanvir and Varricatt, 2008; Rea et al., 2008a; Fatkhullin et al., 2008; Rol et al., 2008). In addition, optical pulsations have been detected for SGR 0501+4516 (Dhillon et al., 2011).
In this paper, we present spectral and timing analysis of a new XMM–Newton observation of SGR 0501+4516 carried out one year after the onset of the bursting activity which led to its discovery. In addition, we used all the existing data from XMM–Newton, Swift-XRT, RXTE, Chandra, and Suzaku to model the flux and the spin period evolution.
2 Observations and reduction
2.1 XMM-Newton
The XMM–Newton Observatory (Jansen et al. 2001) observed SGR 0501+4516 again on 2009 August 30 (see Tab.1) with the EPIC instruments (pn and MOSs; Turner et al., 2001; Strüder et al., 2001).
This new observation was processed using SAS version 12.0.1 with the most up to date calibration files (CCF) available at the time the reduction was performed (December 2012). Standard data screening criteria were applied in the extraction of scientific products. Soft proton flares were not present, resulting in the total on-source exposure time of 37.8 ks (see also Table 1). For consistency, source and background events were also re-extracted for previous observations (see Table 1), using the same version of the standard software.
Similar to Rea et al. (2009), here we will report only on the pn results (see Table 1 for the pn source count rate for this new observation). The observation with the pn camera was set in Prime Small Window mode, using thick filter. We extracted source photons from a circular region with 30″radius, centered at the source position (RA=75.278167∘, Dec=+45.276089∘, Woods et al., 2008). The background was obtained from a similar region but far from the source. Only photons with PATTERN were retained. All the photon arrival times have been converted to refer to the barycenter of the Solar System.
2.2 Other X-ray observations
To obtain an accurate timing solution we also extracted the events from observations carried out by other X-ray missions. SGR 0501+4516 was first monitored with the Swift/XRT from 2008 August 26 until 2009 April 19, in windowed timing (WT) mode and for a total exposure of 436 ks (see Göğüş et al. 2010, for details). Later on, seven new observations were performed in photon counting (PC) mode from 2009 October 7 to 2010 February 21, and for a total exposure time of 38.5 ks. To extract all the events we used xselect as part of the HEAsoft package (version 6.13), and then converted all the event arrival times to the solar system barycenter. For this we selected the same source position used for the XMM-Newton data set.
From 2008 August 22 to October 14 the source was monitored with RXTE/PCA, with a total exposure time of 82.4 ks in 29 observations (details in Göğüş et al. 2010). The source was also observed with the Advance CCD Imaging Spectrometer (ACIS) and the High Resolution Camera (HRC) on board Chandra, on 2008 August 26 (36.5 ksec) and September 25 (10 ksec) (see Göğüş et al. 2010 for a discussion). Suzaku observed SGR 0501+4516 with the X-ray Imaging Spectrometer (XIS) for 51 ks on 2008 August 26–27 (see Enoto et al., 2009). For all these observations source and background events were extracted, and was applied the barycenter correction at the source position.
3 Timing Analysis and Results

In order to produce a timing solution for the source covering the time interval over which data are available (MJD 54701.1–55248.6), we started from the solution determined by Rea et al. (2009). We considered data obtained by Swift/XRT, XMM-Newton/EPIC pn and Suzaku, RXTE/PCA and Chandra covering the first 160 days (interval MJD 54701.1–54859.5). We folded all the available observations around the best period they determined, s, where MJD, sampling the profiles so obtained in 12 bins. The phases of the profiles were obtained from a sinusoidal fit of the profile. We note that only phases evaluated from profiles detected at a significance larger than 2 were collected. On top of a strong noise component affecting the pulse phases (which leads to a high value of the fit 7.8), we found that a second derivative significantly improves the modelling with respect to a fit with a quadratic function (see leftmost column of Table 2), compatible with the results quoted by Rea et al. (2009).
| Parameter | MJD 54701.1–54859.5 | MJD 54701.1–55248.6 |
|---|---|---|
| (MJD) | 54701.0 | 54701.0 |
| (s) | 5.7620699(2) | 5.7620695(1) |
| (s/s) | 6.4(1) | 5.94(2) |
| (s/s2) | -9(3) | -1.0(1) |
| 635.751/81 | 851.511/92 |
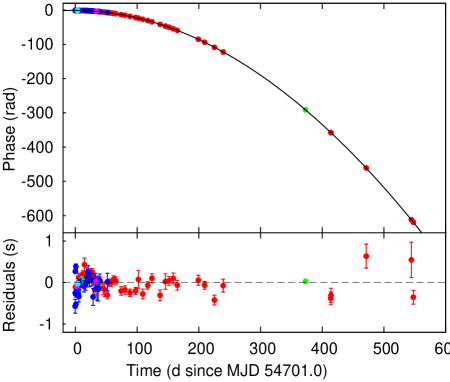
Finally, to obtain a timing solution for the whole interval ( 548 days) we added the new observations during quiescent state. We point out that the uncertainty on the resulting parameters, and in particular that affecting the second derivative, prevents to univoquely phase connect the observations obtained by XMM-Newton and Swift in quiescence (after MJD 55073.616). Nevertheless, we tentatively phase connect these observations, considering the solution giving the lower value of residuals as the most probable one. The best solution quoted in the rightmost column of Table 2 has a lower by 104, for 92 degrees of freedom, with respect to the second best. However, we stress that the solution is not unique, since the phase connection is not warranted by the available data, and its validity relies on the choice of the particular functional form used to model the phase evolution (a cubic polynomial in this case). We also note that the second derivative of the spin period takes a value which is roughly one order of magnitude smaller than that obtained considering only the first 159 days of the outburst. The best-fit solution and timing residuals are plotted in Figure 2.
According to this timing solution, the spin period evaluated at the beginning of the 2009 August XMM-Newton observation (MJD 55073.61477) is s. To check this estimate, we compared this value with that obtained by performing an epoch folding search analysis (Leahy, 1987) over the XMM-Newton data set alone, considering 20 phase bins to sample the oscillation. The value that we have obtained ( s) is compatible with that predicted by the tentative timing solution listed in Table 2, even if its larger uncertainty with respect to the value obtained from phase fitting makes it compatible with more than one possible timing solution.
By fitting a fifth order polynomial to the phases observed in the interval MJD 54700.794–54940.953, Göğüş et al. (2010) estimated a spin period of 5.762096529(1) at MJD 54750.0. Evaluating our solution at that epoch yields instead an estimate of 5.76209578(4) s. The significant difference between the two solutions is most probably due to the different model used in the fit of the pulse phases. In presence of a strong timing noise component, like in this case, a higher order polynomial is able to follow more closely the variations of the pulse phase on short time-scale, which has a significant effect on the value of the spin period evaluated at each epoch.
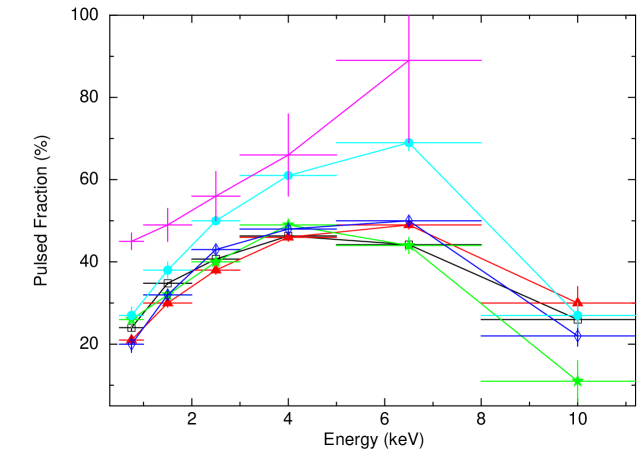
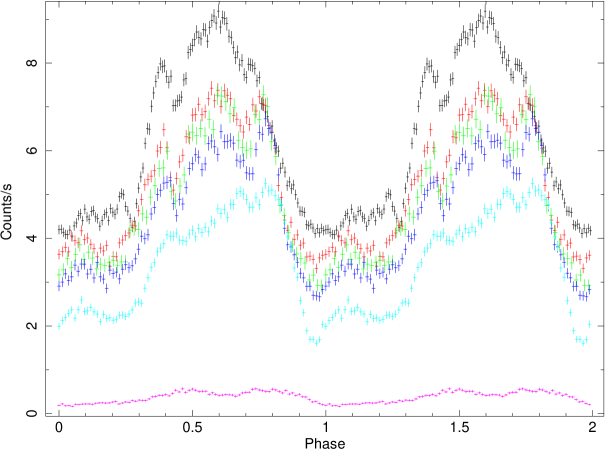
In the new XMM–Newton observation we find that the 0.3–12 keV pulse profile consists of a main peak from phases0.3–1.0 divided into two sub-pulses at phase0.65, and with a flatter region between phases0–0.3. At lower energies, the two sub-pulses seem to merge into one single peak as the energy increases (see Fig. 3). We also computed the pulsed fraction as , obtaining a value of 45(6) (see also Tab. 1). As seen in the previous 5 XMM–Newton observations, both the pulse shape and the pulsed fraction change as a function of energy (see Fig. 3 and Fig. 4).
4 Spectral Analysis and Results
To obtain the 0.5–10 keV phase-averaged spectrum for the new XMM–Newton observation we used source and background photons extracted as described in §2. Then, the response matrix was created for that observation. For the present analysis we used the XSPEC package (version 12.7.0).
The spectrum during quiescence was well fit by an absorbed blackbody (BB) + power law (PL) model. Neither a single BB nor a PL gave an acceptable fit. For the photoelectric absorption we used the cross-sections from Balucinska-Church and McCammon (1992), an the Solar abundance from Anders and Grevesse (1989). The best-fit parameters for the absorbed BB+PL model are =0.85(3) cm-2, kT=0.520.02 keV, and =3.870.13 (reduced =1.06 for 165 d.o.f.). In Table 3 we display the main spectral parameters obtained with this new XMM-Newton observation111We note that the (BB+PL) model is unphysical, and probably tend to overpredict the (sub) keV unabsorbed flux together with the value.. We also show for comparison the results at the peak of the 2008 outburst (more details in Rea et al. 2009).
Comparing our results with the measurements reported in Göğüş et al. (2010) for Swift-XRT observations at the very end of 2009 and starting 2010, we note that their photon index () is steeper than the value found in the present study (). However, in Göğüş et al. (2010) the Swift-XRT spectra were extracted using observations of 12 ks, three times lower than the exposure time of this new XMM-Newton observation (see Tab. 1), plus the fact that the XMM-Newton EPIC pn camera has an effective area larger than the Swift-XRT one (10). We made an attempt to reconcile these results by freezing the hydrogen column density to the value obtained by Göğüş et al. (2010) (1.19 cm-2). We obtained a photon index of 5.590.13, but the reduced increased up to 1.84 (165 d.o.f.) and the residuals showed a strong sinusoidal structure. Furthermore, we have fit the Swift-XRT spectrum with the fixed at the XMM-Newton best-fit value. We obtained a photon index (3.70.9) consistent with the XMM-Newton one, and an acceptable fit (reduced =1.1 for 78 d.o.f.). Therefore, the discrepancy may be explained due to the lower statistics of the Swift-XRT spectra with respect to our XMM-Newton EPIC pn observation.
In addition, the averaged spectra showed an excess in the residuals at energies larger than 8 keV (see Fig. 5), that Rea et al. (2009) suggested to be due to the presence of the same hard X-ray component detected by INTEGRAL. However, the addition of a second PL component was not significant.
| Parameters | Blackbody + Power-lawa | |
|---|---|---|
| 2008-08-23 | 2009-09-30 | |
| kT (keV) | ||
| BB Radius (km) | ||
| BB fluxb | ||
| PL flux | 0.5 | |
| Abs. Flux | 0.02 | |
| Unab. Flux | 0.1 | |
a Model: absorbed BB +PL; reduced (d.o.f.) = 1.15 (371); = cm-2.
b Fluxes are unabsorbed in the 0.5-10 keV range (unless specified), and in units of erg cm-2 s-1.


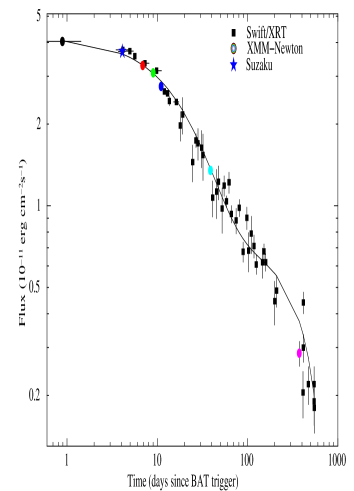
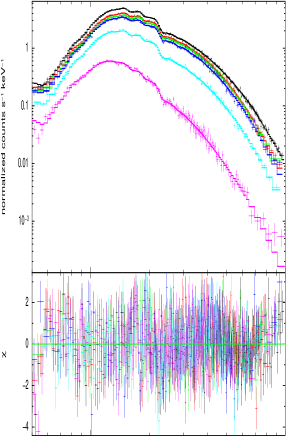
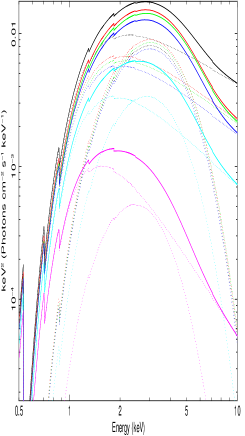
To study the spectral evolution of SGR 0501+4516 since the 2008 Aug 22 outburst, we fitted simultaneously the spectra of all the XMM–Newton observations again with a BB plus PL model (see Fig. 5), leaving all parameters free except which was constrained to be the same in all observations (final reduced for 1011 d.o.f.; see also Rea et al. 2009). The values of the spectral parameters were not significantly different when modelling each observation separately. The measured hydrogen column density is cm-2 , and the absorbed flux in the 0.5–10 keV band varied from 4.1 to 0.3erg s-1cm-2 (see also Tab. 3), corresponding to a luminosity range of 1.2 to 0.10 erg s-1 (where is the source distance in units of 2.5 kpc) (see Fig. 6).
Moreover, we have tried more sophisticated models, the RCS (Resonant Cyclotron Scattering; Rea et al. 2008b) and the NTZ (the 3D evolution of the RCS model; Nobili et al. 2008 and Zane et al. 2009), but this resulted in poorer fits with respect to the BB+PL.
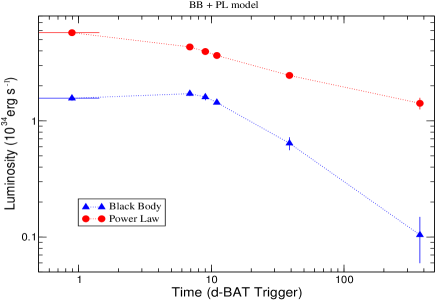
Rea et al. (2009) found evidence that as the flux decreased the X-ray spectrum softened during the first month after the bursting onset. In this new observation, SGR 0501+4516 exhibited an even softer spectrum and a flux 75 times lower than that measured during the outburst. A similar behaviour was observed with ROSAT back in 1992 (Rea et al. 2009). This result is also consistent with the results obtained by Göğüş et al. (2010) using Swift/XRT data. Fitting the flux evolution in the first 548 days after the onset of the bursting activity, we found that a double exponential function of the form Flux(t) = provided the best (although not completely satisfactorily) representation of the data (see Figure 1; reduced =5.7/51); the best values of the parameters are = 0.16 erg s-1cm-2 (fixed), =3.20(8) erg s-1cm-2 and =0.84(8) erg s-1cm-2 , and and days. This is similar to the outburst decays of other magnetars, usually fitted by two components (see Rea et al. 2009, and references therein).
4.1 Phase-resolved spectroscopy
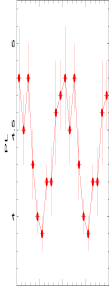
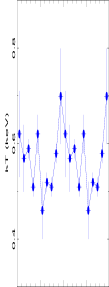
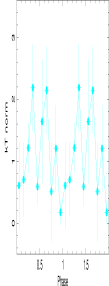
We performed a phase-resolved spectroscopy (PRS) for the new XMM–Newton observation. We generated 10 phase-resolved spectra for this observation using the ephemeris reported in § 3. An absorbed BB plus PL model provided a good fit for all ten phase-resolved spectra during quiescence. A simple absorbed BB or PL models did not yield acceptable fits. In Fig. 7 we have plotted the parameters derived from the PRS analysis. In general, the spectral parameters follow the trend seen during the outburst. The power-law photon index becomes softer between phases 0.0-0.4, and the blackbody temperature remained rather constant.
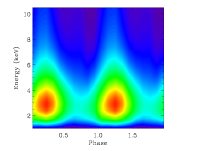
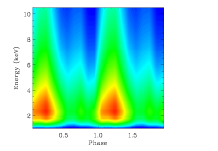
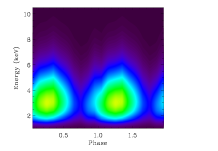
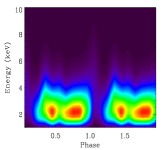
The pulse profiles and the spectral changes in phase and time can be globally analysed by carrying out Dynamic Spectral Profiles (DSP). In Figure 8 we show DSP for two XMM-Newton observations, at the peak of the 2008 outburst (panels on the left) and during quiescence (panels on the right). Each panel show a contour plot of the Fν flux as a function of phase and energy, and has been derived from the 10 extracted phase-resolved spectra. The top panels correspond to the total flux, using the BB+PL model, while middle bottom panels show, respectively, the flux of the PL and BB components. The new XMM-Newton observation during quiescence confirms the evolutionary trend of the phase-dependent spectrum during the outburst, with the PL component dominating the emission at all the times at energies above 5 keV. However, the main component of the profiles was dominated by the BB component (see also Fig. 7).
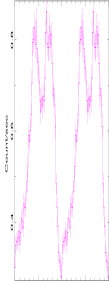
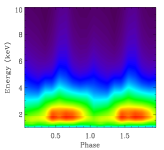
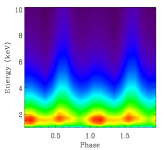
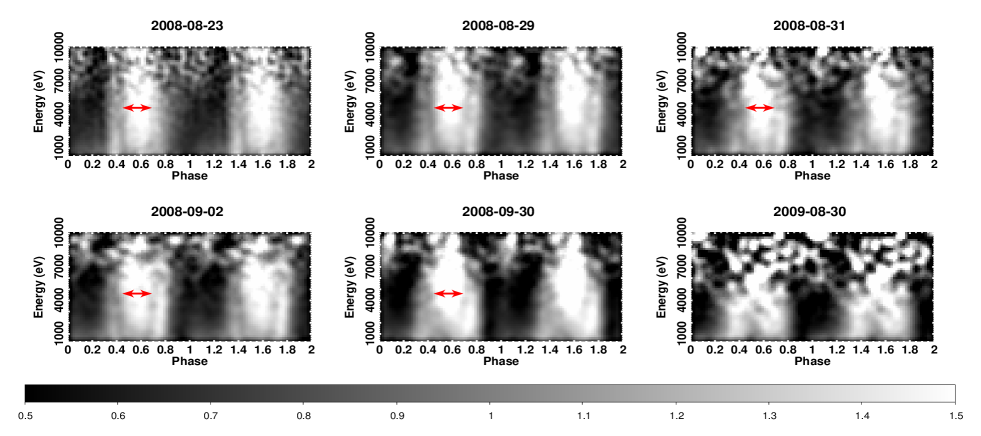
To study whether the X-ray spectrum of SGR 0501+4516 has any phase-dependent absorption feature, similar to the one detected in SGR 0418+5729 (Tiengo et al., 2013), we produced energy versus phase images for all the available XMM-Newton observations by binning the source counts into 50 phase bins and energy channels of 200 eV (and then divided by the average number of counts in the same energy bin). The resulting images can be seen in Fig. 9. Some hints for two narrow dark stripes, indicating a possible phase-variable feature, seem to be visible at the two sides of pulse maximum in early observations. However, these deviations from the phase average spectrum are much smaller than in SGR 0418+5729 and could not be significantly detected by fitting the corresponding phase-resolved spectra.


5 Discussion and Conclusions
In this paper we presented an X-ray study of the spectral and timing properties of SGR 0501+4516 during quiescence, using a new XMM–Newton observation obtained on 2009 August 30. We also made use of this new observation to improve the modeling of the outburst and the spin period evolution of the source since it was first detected in 2008 Aug 22. To do this we used all the available data collected up to date from XMM–Newton, Swift-XRT, RXTE, Chandra, and Suzaku.
During quiescence both the pulse shape and the pulsed fraction change as a function of energy. The 0.3–12 keV pulse profile consists mainly of a single peak showing no very prominent features. At lower energies the pulse profile presents two peaks that seem to get dissolved into one as the energy increases. Moreover, the pulsed fraction increases at any given energy range as the outburst evolves (see Fig. 3).
The spectrum was well fit by an absorbed BB + PL model. The best-fit parameters for this model are =0.85(3) cm-2, kT=0.520.02 keV, and =3.870.13. The source shows an absorbed flux 75 times lower than that measured during the 2008 outburst, and a rather soft spectrum, with the same value of the blackbody temperature observed with ROSAT back in 1992 and with Swift-XRT in 2009-2010. The 0.1–2.4 keV observed flux was F1.810-12 erg cm-2 s-1, in line with that observed by ROSAT before the outburst.
All magnetar outbursts detected so far were characterized by the presence of a hot spot, which cools down until quiescence is reached; the peak luminosity is of the order of a erg s-1(see Pons and Rea, 2012). Magnetar outbursts are believed to be due to a sudden crustal crack consequence of their unstable magnetic field configuration, when the twisted magnetic field in its constant movement toward a stable/quiet assessment, stresses the crust until its breaking point. The large amount of energy that is released in this event is expected to be of the order of ergs. Part of this energy will heat the crust (explaining the sudden increase of the surface temperature soon after the outburst onset), part of it will be spent in accelerating particles in the magnetosphere (explaining the hardening of the spectral shape), and a large fraction will be released in neutrinos. The limiting luminosity is a consequence of the neutrino emission that regulates the release of most of the energy dumped in the crust as soon as a temperature reaches here a value of 4109 K (Pons and Rea, 2012). The total energy released by SGR 0501+4516 ’s outburst in the 0.5–10 keV band is ergs, in line with what expected for a typical large scale crustal event. On the other hand, all typical outburst characteristics were observed for SGR 0501+4516 (see §4), as well as a clear dependence on the rotational phase of the crustal heating, which was localized in a few degrees of surface, creating a localized hot spot, possibly on the magnetic pole, which cooled down until its quiescent emission level.
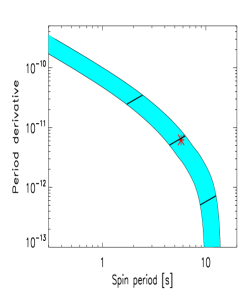
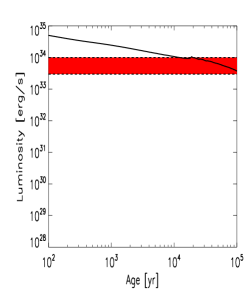
The long-term magneto-thermal evolution, simulated with the Viganò et al. (2012) code, indicates that this source is consistent with being born kyr ago (not too far from its 16 kyr characteristic age) with an initial dipolar magnetic field of G. This exact value depends, by a factor 2, on the parameters of the neutron star (mass, radius, inclination angle) and on the poorly known internal magnetic configuration. In Figure 10, we show the evolution of period, period derivative, the source track in the - diagram, and the thermal, bolometric luminosity.
As generally found in magnetars, the temperature inferred from the BB+PL fit is of the same order of, although somewhat higher than, what predicted by the evolutionary model (100-200 eV, depending on the details and the internal geometry). The mismatch (by a factor –3) is well within what can be expected from the assumptions of both the emission and evolution models. It is known that spectral fitting with resonant Compton scattering models results in a lower temperature, closer to that of the cooling models, even keeping the assumption of blackbody seed photons. Actually, thermal radiation from the star surface is likely different from a simple blackbody, because of local reprocessing by some sort of atmosphere or, on the contrary, because the surface is in a condensed state. Moreover, the hot spot temperature is not uniform and geometrical effects (viewing angle, inclination of the magnetic axis) come into play; these are not accounted for as yet. Given these uncertainties, we rather compare the luminosity, which depends on the distance, but not much on the details of the model.

We note that this source belong to a vast group of magnetars (1E 1547-5408, SGR 1627-41, SGR 1745-2900, XTE J1810-197, SGR 1833-0832, 4U 0142+614, CXO 1647-4552), which timing properties are linked by the same evolutionary track, compatible with being born with an initial field of G, as discussed in Viganò et al. (2013). In this scenario, most magnetars are born with a narrow range of magnetic field values, and the timing and spectral differences between them are due only to their particular ages.
We have also compared the observed outburst decay with the detailed theoretical model presented in Pons and Rea (2012), and used to reproduce the outburst decay of other magnetars (Rea et al., 2012, 2013). Starting with a neutron star with G and the crust temperature fixed to reproduce the flux observed by ROSAT in 1992 at the estimated distance, we simulate the starquake by injecting erg in the crust layer between and g cm-3 in a polar cap of about 30 degrees around the pole. We then follow the thermal evolution of the crust until it returns to the original state. The results are shown in Figure 11, where we compare the theoretical model with the XMM-Newton observations.
Acknowledgements
This work was supported by the grants AYA2012-39303, SGR2009-811, and iLINK2011-0303. AP is supported by a Juan de la Cierva Fellowship in IEEC. NR is supported by a Ramon y Cajal fellowship and by an NWO Vidi Award. DV was supported by the grants AYA2010-21097-C03-02, ACOMP/2012/135, AYA 2012-39303 and SGR 2009-811.
References
- Anders and Grevesse (1989) Anders, E. and Grevesse, N.: 1989, Geochim. Cosmochim. Acta 53, 197
- Balucinska-Church and McCammon (1992) Balucinska-Church, M. and McCammon, D.: 1992, ApJ 400, 699
- Baring and Harding (2007) Baring, M.G. and Harding, A.K.: 2007, Ap&SS 308, 109
- Barthelmy et al. (2008) Barthelmy, S. D. et al.: 2008, The Astronomer’s Telegram 1676, 1
- Beloborodov and Thompson (2007) Beloborodov, A.M. and Thompson,, C.: 2007, ApJ 657, 967
- (6) Beloborodov, A.M.: 2013, ApJ 762, 13
- Dhillon et al. (2011) Dhillon, V. S. et al.: 2011, MNRAS 416, L16
- Enoto et al. (2009) Enoto, T. et al.: 2009, ApJ 693, L122
- Fatkhullin et al. (2008) Fatkhullin, T. et al.: 2008, GRB Coordinates Network 8160, 1
- Gelfand et al. (2008) Gelfand, J. D., Taylor, G., Kouveliotou, C., Gaensler, B., and van der Horst, A. J.: 2008, GRB Coordinates Network 8155, 1
- Gogus et al. (2008) Gogus, E., Woods, P., and Kouveliotou, C.: 2008, The Astronomer’s Telegram 1677, 1
- Göğüş et al. (2010) Göğüş, E., Woods, P. M., Kouveliotou, C., Kaneko, Y., Gaensler, B. M., and Chatterjee, S.: 2010, ApJ 722, 899
- Hessels et al. (2008) Hessels, J., Rea, N., Ransom, S., and Stappers, B.: 2008, GRB Coordinates Network 8134, 1
- Holland et al. (2008) Holland, S. T. et al.: 2008, GRB Coordinates Network 8112, 1
- Kulkarni and Frail (2008) Kulkarni, S. R. and Frail, D. A.: 2008, GRB Coordinates Network 8130, 1
- Kumar et al. (2010) Kumar, H. S., Ibrahim, A. I., and Safi-Harb, S.: 2010, ApJ 716, 97
- Leahy (1987) Leahy, D. A.: 1987, A&A 180, 275
- Lyubarsky (2002) Lyubarsky, Y. E.: 2002, MNRAS 332, 199
- Mereghetti (2008) Mereghetti, S.: 2008, A&A Rev. 15, 225
- Nobili et al. (2008) Nobili, L., Turolla, R., and Zane, S.: 2008, MNRAS 389, 989
- Pons and Rea (2012) Pons, J. A. and Rea, N.: 2012, ApJ 750, L6
- Rea et al. (2013) Rea, N. et al.: 2013, ApJ 770, 65
- Rea et al. (2012) Rea, N. et al.: 2012, ApJ 754, 27
- Rea and Esposito (2011) Rea, N. and Esposito, P.: 2011, in High-Energy Emission from Pulsars and their Systems, ed. D. F. Torres & N. Rea, Astrophysics and Space Science Proceedings (Springer Berlin Heidelberg), 247
- Rea et al. (2009) Rea, N. et al.: 2009, MNRAS 396, 2419
- Rea et al. (2008a) Rea, N., Rol, E., Curran, P. A., Skillen, I., Russell, D. M., and Israel, G. L.: 2008a, GRB Coordinates Network 8159, 1
- Rea et al. (2008b) Rea, N., Zane, S., Turolla, R., Lyutikov, M., and Götz, D.: 2008b, ApJ 686, 1245
- Rol et al. (2008) Rol, E., Tanvir, N., Rea, N., Wiersema, K., Skillen, I., and Curran, P. A.: 2008, GRB Coordinates Network 8164, 1
- Strüder et al. (2001) Strüder, L. et al.: 2001, A&A 365, L18
- Tanvir and Varricatt (2008) Tanvir, N. R. and Varricatt, W.: 2008, GRB Coordinates Network 8126, 1
- Thompson et al. (2002) Thompson, C., Lyutikov, M., and Kulkarni, S. R.: 2002, ApJ 574, 332
- Tiengo et al. (2013) Tiengo, A. et al.: 2013, Nature 500, 312
- Turner et al. (2001) Turner, M. J. L. et al.: 2001, A&A 365, L110
- Viganò et al. (2012) Viganò, D., Pons, J. A., and Miralles, J. A.: 2012, Computer Physics Communications 183, 2042
- Viganò et al. (2013) Viganò, D., Rea, N., Pons, J. A., Perna, R., Aguilera, D. N., and Miralles, J. A.: 2013, MNRAS 434, 123
- Woods et al. (2008) Woods, P. M., Gogus, E., and Kouveliotou, C.: 2008, The Astronomer’s Telegram 1691, 1
- Zane et al. (2009) Zane, S., Rea, N., Turolla, R., and Nobili, L.: 2009, MNRAS 398, 1403