Supermassive Black Holes and Nuclear Star Clusters:
Connection with the Host Galaxy Kinematics and Color
Abstract
We consider the relationship between the masses of the central objects in disky galaxies – supermassive black holes (SMBHs) and nuclear star clusters (NCs) – and various parameters of parent galaxies: velocity of rotation at kpc, maximal velocity of rotation , the indicative dynamical mass , the total mass of the stellar population , and the total color index () of galaxies. The mass of nuclear clusters correlates more closely with the kinematic parameters and total masses of galaxies than the mass of central black holes , including correlation with the velocity , which characterizes the virial mass of the dark halo. On average, lenticular galaxies are distinguished by higher masses compared to other types of galaxies with similar characteristics. The dependence of masses of central objects on the color index is bimodal: galaxies of the red group (red-sequence), which have (, being mostly early-type galaxies, differ from bluer galaxies, by higher values of and . The red-group galaxies have systematically higher values, even when the host-galaxy parameters are similar. In contrast, in the case of nuclear stellar clusters, the “blue” and “red” galaxies form unified sequences. The results agree with scenarios in which most red-group galaxies form as a result of the partial or complete loss of interstellar gas in a stage of high nuclear activity which took place in galaxies whose central black-hole masses exceed (depending on the total mass of the galaxy). Most of galaxies with are lenticular galaxies (types S0, E/S0) whose disks are essentially devoid of gas.
1 INTRODUCTION
There are two kinds of central massive objects which are observed at the dynamical centers of both disky and elliptical galaxies: supermassive black holes (SMBHs), with masses of up to a few billion solar masses (see, e.g., the review of Shankar [1]), and central (nuclear) star clusters (NCs), with total masses of (see, e.g., the papers by Wehner and Harris [2], Seth et al. [3], and Ross et al. [4]). As a rule, the masses of nuclear star clusters are appreciably larger than the masses of central black holes, except for the most massive galaxies, where the opposite is true [5, 6]. The genetic connection between NCs and SMBHs, their formation mechanisms, and, especially, their evolution are poorly known and are subjects of active discussions (see, e.g., [6]).
The observations show that both NC and SMBH masses are correlated with the properties of the host galaxies. The black-hole mass is most closely related to the central stellar-velocity dispersion , as well as the luminosity (mass) of the spheroidal system; i.e., the bulge for disk galaxies and the entire galaxy for elliptical systems (see, e.g., [7] and references therein). On the contrary, the NC masses are more closely related to the stellar components of their galaxies, and, unlike the SMBHs, they are often observed in late-type galaxies where a bulge is nearly absent [8, 9]. Like the SMBH mass, the mass of NC is correlated with the central velocity dispersion, though not so closely [10–12]. However, the NCs and SMBHs do not form a unified sequence: the slopes of the logarithmic dependencies of on (as well as their dependencies on the luminosity and mass of the stellar components) are gentler than the corresponding slopes for , suggesting different formation mechanisms and evolutionary trends for these objects [12].
When comparing SMBHs and NCs, we should bear in mind that most galaxies with reliable estimates are massive ellipticals, in which nuclear star clusters are rarely observed, while their masses have been measured mostly in low-mass, late-type (Sd–Sm) galaxies, in which the velocity dispersion and bulge mass are small, so that few estimates of the SMBH masses are available for them. This makes difficult to compare these two types of central objects. A correlation between and is clearly expressed for early-type (E–S0) galaxies, but is smeared out and almost vanishes completely for late-type galaxies (which have low values of , as a rule).
As it was pointed out by Erwin and Gadotti [9], the stellar-velocity dispersion along the line of sight is not a very good parameter for comparing galaxies whose spherical component is small. This is due to the fact that it is hard to divide the measured stellar-velocity dispersion in galaxies with small bulges into separate components belonging to the nuclear cluster, the bulge, or the inner disk. Moreover, an estimated velocity dispersion generally depends on the radius of the region in which it is determined. It is not unambiguously related to either the bulge mass or the total mass within a given radius: the mass of a stellar system estimated from its velocity dispersion is always model-dependent.
In the case of disk galaxies, another approach is possible: one may compare the masses of the central objects with direct estimates of the disk rotation velocities, instead of the velocity dispersion. One can use the maximum rotation velocities, which, as a rule, are close to the “asymptotic” circular velocities at large distances from the center, or the velocities at a specified distance in the inner region of the disk, if our interest is in the density of the central region of the galaxy [11]. A shortcoming of this approach is the lower (on average) accuracy of the estimated rotation velocity, compared to estimates of the velocity dispersion, especially given the dependence of the velocity on the adopted disk inclination and the possible presence of non-circular or non-planar motions, which are often observed in the central regions of galaxies.
The first attempts to identify kinematic features in the central kiloparsec of galaxies with active nuclei were undertaken by Afanasyev [13] in the 1980s. Zasov et al. [11, 14] applied this approach to SMBHs, for which the estimates of have mostly been obtained via reverberation mapping or direct kinematic measurements. In particular, it was shown in [11] that the mass is correlated with the disk rotation velocity at a distance of kpc, i.e., with the density of the central region, which agrees well with the scenario where the bulge and the SMBH are formed as a result of a monolythic collapse of the central region of the protogalaxy. In the present work we use the rotational velocity at kpc, , because many galaxies do not have reliable estimates of , corresponding to a distance of 1 kpc, due to the limited linear resolution of their rotation curves. However, as we found, a transiton from to does not qualitatively change the form of the dependencies, however it increases their statistical significance.
The dark halo could theoretically play a large role in SMBH formation, and in determining the final black hole mass [15–21]. The total (virial) mass of the dark halo is determined by the circular velocity at the virial radius, which is close to the observed maximum or “asymptotic” rotation velocities of galaxies at large [22, 23]. So the relationship between the masses of the central objects, or , and are of special interest.
The connection between the SMBH or NC masses and galactic circular velocities has been considered in a number of studies, but the results are contradictory. It is obvious, that the most massive black holes are observed in high-luminosity galaxies, which have high rotation velocities. However, the tight correlation – for disk galaxies found in some studies [21, 24] is probably the result of using indirect estimates of , based on their statistical dependencies on the central stellar-velocity dispersion. In the paper of Beifiori at al. [25], where the maximum rotation velocity was estimated from the width of the HI line, the correlation between and for disk galaxies turned out to be very weak, and became significant only after the addition of elliptical galaxies with model estimates of their circular velocities (see Fig. 13 of [25]). A weak correlation between these parameters was also noted for early-type disk galaxies in [14], where real rotation curves of galaxies were used. According to Kormendy and Bender [8], is only correlated with the parameters of “classical” bulges, and does not depend on the parameters of the disk (which can even be absent); therefore, a correlation between and is clearly expressed only for galaxies with massive bulges, probably as a result of a link between the bulge parameters and the rotation velocity of the galaxy at large (the “baryon–dark matter conspiracy”). However, Volonteri et al. [17] came to conclusion that there is no discrepancy between the theoretically expected correlation between and and observations.
In the current study, we have analyzed the connection between the masses of nuclear star clusters and central supermassive black holes with the kinematic parameters and integrated color indices of their host disky galaxies. We don’t consider purely elliptical galaxies without disks here.
2 GALAXY SAMPLE AND DATA SOURCES
Our sample of galaxies with known NC masses is based on the list of Seth et al. [3], to which we have added a few objects from the lists of galaxies with the most confident NC mass estimates compiled by Erwin and Gadotti [9], Graham and Spitler [5] and Graham [26]. The sample of galaxies with the SMBH masses is based on the catalog of Graham [26], supplemented by data from [7, 27], as well as a few galaxies we had observed earlier [11, 28]. Since the number of galaxies with is very small, we added a few objects with low mass black holes, although for some of them only upper limits of are known (IC 342 [29] , NGC 404 [30], NGC 598 [31], and NGC 4395 [32], and several galaxies from the list of Neumayer et al [6]). Our list also includes NGC 1277, which possesses the most massive SMBH [32]. We adopted the inclination angle [33] for this galaxy to get from the line-of-sight velocity curve given in the cited paper.
The characteristic errors of the estimates are about a factor of two [7, 27]; the errors are smaller for the most massive and larger for less massive black holes. The accuracy of the NC masses values is generally also close to a factor of two [5]. The adopted distances to the galaxies correspond to km s-1Mpc-1. The results of a comparison of the SMBHs and NCs will depend only weakly on this parameter. For nearby galaxies ( km/s), we adopted the same distances as in the papers where the rotation velocities were estimated (the exception is NGC 4258, for which Sofue et al. [34] apparently used a strongly overestimated distance of 6.6 Mpc). The distance to the Virgo cluster was taken to be 16 Mpc. In a few cases, where the accepted distance was substantially different from the distance given in the papers presenting the central-object mass estimates, the appropriate corrections were applied.
| Galaxy | Type | Source | ||||
|---|---|---|---|---|---|---|
| Mpc | km/s | |||||
| Circinus | Sb | 4 | – | 6.2 | 150 | [36] |
| IC 0342 | Scd | 3.9 | 7.1 | 6 | 193 | [34] |
| IC 2560 | SBb | 40.7 | – | 6.6 | 196∗ | [33] |
| MW | SBbc | – | 7.5 | 6.6 | 230 | [37] |
| N 0224 | Sb | 0.77 | 7.5 | 8.2 | 250 | [38] |
| N 0253 | SBc | 3.5 | – | 7 | 210 | [34] |
| N 0289 | SBbc | 21.4 | 7.9 | – | 170 | [39] |
| N 0300 | Scd | 1.8 | 6 | 3 | 90 | [40] |
| N 0428 | SABm | 15.9 | 6.5 | 4.5 | 110 | [28] |
| N 0450 | SABc | 24.3 | 6.1 | – | 130 | [41] |
| N 0524 | S0/a | 35 | – | 8.92 | 360 | [42] |
| N 0598 | Sc | 0.84 | 6.3 | 3.2 | 130 | [43] |
| N 1023 | E/SO | 11.7 | 6.4 | 7.64 | 205 | [44] |
| N 1042 | SABc | 18.2 | 6.5 | 4.4 | 52 | [45] |
| N 1068 | Sb | 15 | – | 6.9 | 240 | [46] |
| N 1277 | S0 | 73 | – | 10.2 | 350 | [32] |
| N 1300 | SBbc | 20 | 7.9 | 7.9 | 210 | [47] |
| N 1325 | SBbc | 20.1 | 7.1 | – | 184 | [48] |
| N 1345 | Sc | 19.4 | 6.1 | – | 100 | [45] |
| N 1385 | Sc | 18.7 | 6.4 | – | 130 | [49] |
| N 1705 | S0 | 6.2 | 5 | – | 70 | [50] |
| N 2139 | Sc | 22.2 | 5.2 | 136 | [33] | |
| N 2549 | S0 | 16 | 7 | 7.26 | 160 | [44] |
| N 2552 | SABm | 10.1 | 5.8 | – | 90 | [51] |
| N 2778 | E/S0 | 27 | – | 7.26 | 135 | [52] |
| N 2787 | SB0 | 11.5 | – | 7.8 | 200 | [28] |
| N 2964 | Sbc | 17 | 7.8 | – | 220 | [53] |
| N 3079 | Sb | 16 | – | 6.28 | 230 | [34] |
| N 3115 | S0 | 10.3 | – | 8.96 | 240 | [54] |
| N 3227 | S0 | 20.3 | – | 7.15 | 250 | [55] |
| N 3245 | S0 | 18 | – | 8.25 | 250 | [28] |
| N 3346 | SBc | 15.6 | 6.1 | – | 110 | [51] |
| N 3368 | SBab | 10.1 | – | 6.86 | 210 | [56] |
| N 3384 | S0 | 11.6 | 7.3 | 7.23 | 160 | [57] |
| N 3414 | S0 | 18 | – | 8.4 | 145 | [58] |
| N 3423 | Sc | 11.9 | – | 5.2 | 127 | [33] |
| N 3489 | S0 | 11.7 | – | 6.76 | 54 | [33] |
| N 3501 | Sc | 14 | 5.9 | 126 | [59] | |
| N 3516 | S0 | 36 | – | 7.6 | 200 | [28] |
| N 3585 | SB0 | 18 | 6.5 | 8.49 | 140 | [57, 60] |
| N 3607 | S0 | 22 | – | 7.94 | 250 | [61] |
| N 3621 | Sd | 6.6 | 7 | – | 150 | [62] |
| N 3949 | Sbc | 11.4 | 6.9 | – | 170 | [39] |
| N 3998 | S0 | 15 | – | 8.34 | 305 | [57] |
| N 4026 | S0 | 13.2 | 6.7 | 8.26 | 200 | [57] |
| N 4027 | SBd | 20.1 | 5.9 | – | 110 | [63] |
| N 4144 | SABc | 4.3 | 4.8 | 80 | [64] | |
| N 4183 | Sc | 12.9 | 5.9 | [65] | ||
| N 4206 | Sbc | 16 | 6.8 | – | 100 | [66] |
| N 4244 | Sc | 5.2 | 6.5 | – | 100 | [67] |
| N 4258 | SBbc | 6.6 | – | 7.59 | 213 | [34] |
| N 4395 | Sm | 4.6 | 6.1 | 5.6 | 90 | [51] |
| N 4459 | S0 | 16 | – | 7.85 | 300 | [68] |
| N 4496 | SBd | 16 | 5.7 | – | 110 | [59] |
| N 4564 | S0 | 16 | – | 7.78 | 150 | [69 |
| N 4625 | SABm | 9.5 | 5.6 | – | 37 | [70] |
| N 4945 | SBcd | 3.8 | – | 6.15 | 170 | [70] |
| N 5023 | Sc | 4.8 | 5.3 | – | 83 | [71] |
| N 5128 | S0 | 3.8 | – | 7.65 | 230 | [72] |
| N 5377 | Sa | 25.3 | 8.6 | – | 220 | [73] |
| N 5584 | SABc | 21.6 | 5.1 | – | 100 | [74] |
| N 5585 | SABc | 10.5 | 5.8 | 100 | [51] | |
| N 5669 | SABc | 18.5 | 6.5 | – | 98 | [75] |
| N 5678 | SABb | 27.2 | 8.1 | – | 187 | [59] |
| N 5806 | Sb | 18 | 8.1 | – | 200 | [39] |
| N 5879 | Sbc | 12.3 | 7.2 | – | 140 | [76] |
| N 5964 | SBcd | 19.9 | 6.4 | – | 112 | [35] |
| N 6239 | SBb | 14.6 | 6.7 | – | 84 | [59] |
| N 6509 | SABc | 26 | 6.4 | – | 218 | [75] |
| N 6946 | Scd | 5.9 | 7.9 | – | 200 | [62] |
| N 6951 | SABb | 21.9 | 8.2 | – | 230 | [34] |
| N 7418 | Sc | 19.3 | 7.8 | 5.2 | 155 | [33] |
| N 7424 | Sc | 12.3 | 6.1 | 5.2 | 82 | [33] |
| N 7457 | E-S0 | 14.6 | 7 | 6.54 | 130 | [11] |
| N 7469 | Sa | 68 | – | 7.1 | 170 | [11] |
| N 7793 | Scd | 3.4 | 6.9 | 3.7 | 115 | [77] |
| U 03826 | SABc | 24 | 5.6 | – | 70 | [76] |
| U 04499 | Sd | 13 | 4.9 | – | 60 | [71] |
| U 06983 | Sd | 15.3 | 5.5 | – | 107 | [65] |
| U 08823 | S0 | 126 | – | 7.54 | 230 | [11] |
| U 12732 | SABm | 13.2 | 5.8 | – | 65 | [71] |
| VCC1242 | S0 | 16 | 7.1 | – | 120 | [78] |
The velocity used here corresponds to the plateau or the maximum in the rotation curve, if it is located further than 2 kpc from the center to avoid the cases where it is related to a bulge. The galaxy inclination was taken from the original paper, or, if not presented there, from the Hyperleda database [33]. An exception is the NGC 5964, for which we adopted instead of the underestimated value used by Fathi et al. [35]. No corrections for asymmetric drift were introduced for rotation curves obtained from absorption lines (if it was not given in the original paper). However, we excluded from consideration those galaxies where the velocity dispersions outside the bulge is comparable with , making the correction for asymmetric drift substantial. In order not to exclude from consideration those galaxies which have only upper limits for the SMBH mass, we took for them, if necesary, estimates obtained from the width of the HI line and given in Hyperleda [33]. Conditionally we adopted the accuracy of the rotation velocities to be (or . The indicative mass within the 25 mag/arcsec2 isophote, which is proportional to , typically has an uncertainty of a factor of , which corresponds to . The central velocity dispersions have higher accuracies than the rotation velocities (about 10) [7].
The data for galaxies with the estimates are given in Table 1. This table also presents the morphological types of the galaxies, the adopted distances and references.
3 DEPENDENCE OF THE MASS OF CENTRAL OBJECTS ON THE ROTATION VELOCITY AND HOST-GALAXY MASS
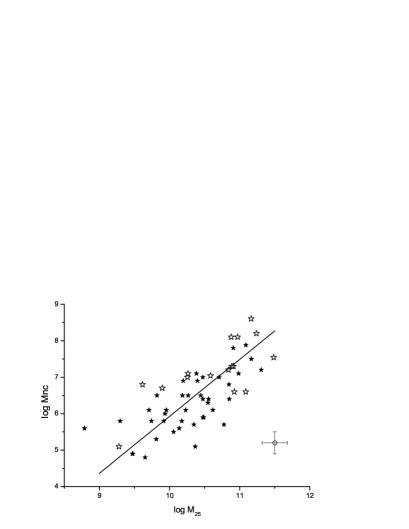
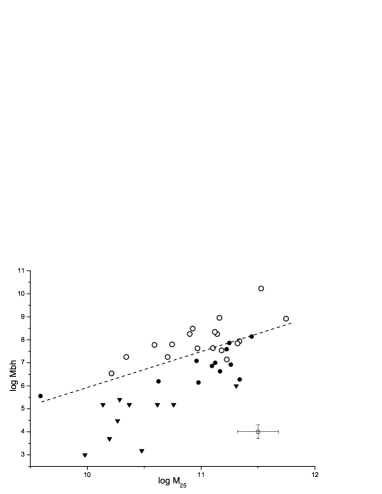
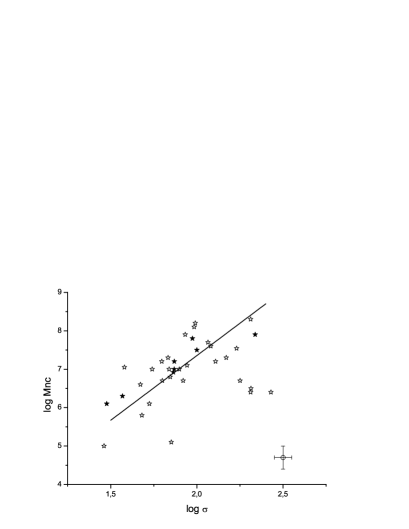
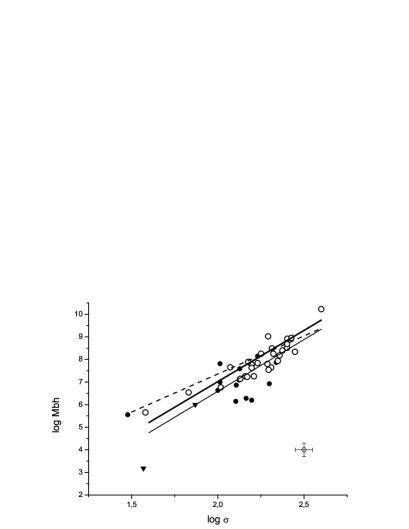
Figures 1a,b show the velocity of rotation at kpc plotted against the central-object mass for NCs and SMBHs, respectively. The velocity characterizes the disk angular velocity in the inner part of a galaxy, being the indicative of the mean density within 2 kpc. The filled triangles denote galaxies for which only upper limits for are known. The galaxies of our sample with the and values were divided into two nearly equial groups: early types (hollow symbols) and late types (filled symbols). We refer to the early types the lenticular (S0 and E/S0) galaxies with known , while in the case of the galaxies with known we also assign to the early types Sa-Sb galaxies, since the number of S0 galaxies among them is very small. The letter “e” denotes galaxies whose disks are seen almost edge-on ( [33]), and “B” denotes those with a bar (SB, SB0). Due to projection effects and the inner absorption, the rotation velocities in the inner regions of galaxies seen almost edge-on may be underestimated [79], but this effect is not appreciable in either Fig. 1 or the other diagrams considered below (though the positions of edge-on galaxies are only marked in Fig. 1a). The same is true for SB galaxies: we didn’t find any systematic differences between galaxies with and without bars in the diagrams. The straight regression line in Fig. 1a and the other diagrams below is a bi-sector line obtained by a least-squares fit. Regression line in Fig 1b is the same as in Fig. 1a, being moved there for comparison.
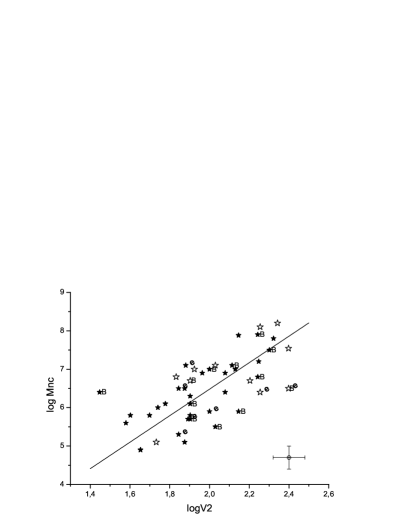
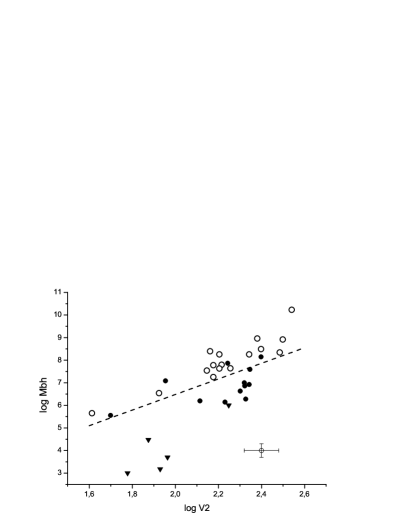
A comparison of Figs. 1a and 1b shows that the masses of both NCs and SMBHs correlate with the angular velocities of central regions, but this correlation is shallower for black holes, mainly owing to the galaxies with the upper limits for . Early-type and late-type galaxies are not separated in the NC plot, however they occupy distinct regions in the SMBH plot: the lenticular galaxies (hollow symbols) possess more massive black holes than late-type galaxies with the same velocities . The dependence is shallower for NCs as well as for SMBHs.
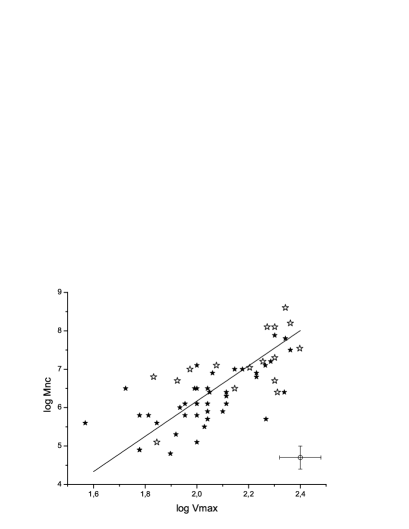
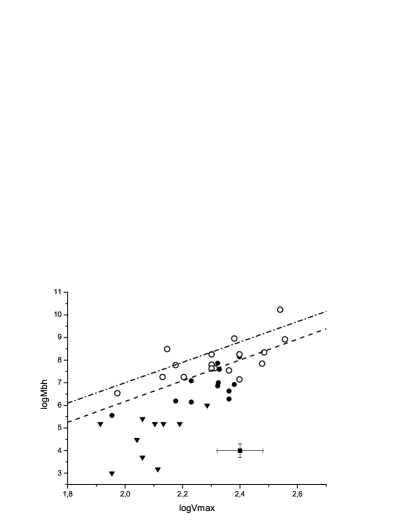
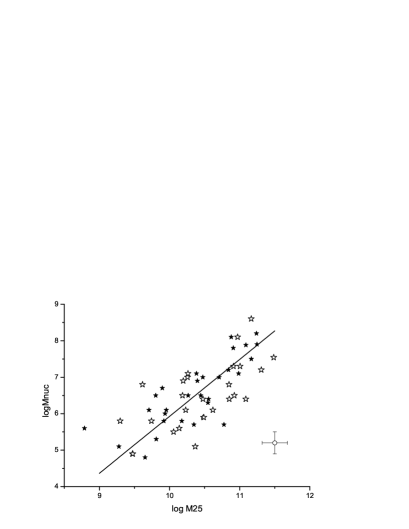
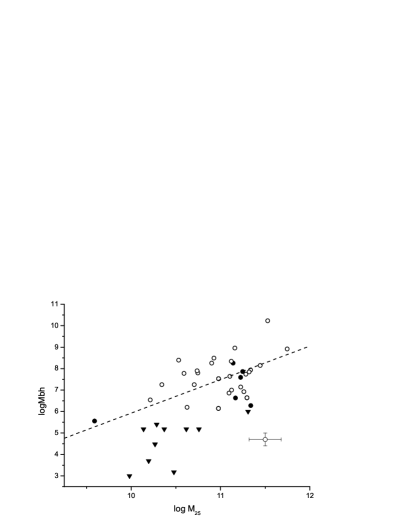
Similar conclusions follow from a comparison of the mass of central objects with the maximum rotation velocity of parent galaxy (Fig. 2) and with the total (indicative) mass of a galaxy within the optical diameter , defied as /2G (Fig. 3). The notations in Figs. 2 and 3 are the same as in Fig. 1. Unlike , the values for galaxies of early and late types form a unified sequence in all diagrams we considered.
The dot-dashed line in Fig. 2b has the slope expected theoretically by models, in which the formation of SMBH and its final mass is linked with the mass of a dark halo: , which corresponds to [18]. The shift of this line along the vertical axis is arbitrary. It is clear that the data for SMBHs agree poorly with the predicted slope. At the same time, this model slope is surprisingly close to the slope fitted for the NCs (dashed and dot-dashed lines in Fig. 2b). It is unclear, whether this agreement is a coincidence, or if the gravitational potential of the halo determines the mass of a nuclear star cluster to a greater extent than the mass of a central SMBH.
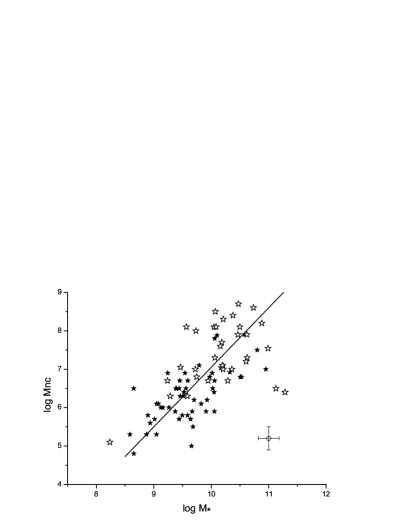
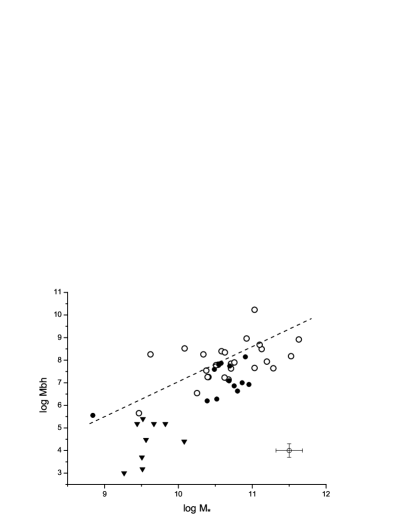
In Fig. 4, the masses and are compared with the total masses of stellar population of galaxies, . The latter was found from the total luminosity taking into account the mass/luminosity ratio as a function of color index () [80]. The dependence we consider is apparent only for late-type galaxies, being more shallow for the NCs (Fig. 4a) than for SMBHs (Fig. 4b). Using the whole set of galaxies of different types, including elliptical galaxies, Scott and Graham [12] also found relationship to be a shallower than that for the SMBHs. In general, our results for the disk galaxies are in good agreement with the results of [12].
It is worth noting, that the masses of both NCs and SMBHs correlate more closely with dynamical masses , which include both stellar and dark-halo masses, than with pure baryonic stellar masses of galaxies (Figs. 3 and 4), despite the fact that the notion of dynamical mass is rather vague, because it contains the somewhat arbitrary adopted limiting radius .
There is a somewhat different situation with the dependence of the masses of the central objects on the central velocity dispersion . Though this relationship exists for both NCs and SMBHs (Fig. 5), is is much weaker and more gently sloped for the nuclear clusters than for the black holes, which has been noted earlier by Scott and Graham [12]. The galaxies that most strongly deviate towards higher velocity dispersions in Fig. 5a are lenticular galaxies with close values: NGC 1023, VCC 1125 = NGC 4452 and NGC 3585, whose disks are observed edge-on, and (at the bottom) the dwarf peculiar galaxy NGC 1705 with an outburst of star formation. It cannot be excluded that the high velocity disperions in these three galaxies result from the projection of different regions of the disk onto the line of sight, although other galaxies viewed edge-on do not show such an effect. After the exclusion of these three galaxies, the correlation coefficient for the relation between and turns out to be fairly high (). The dashed line in Fig. 5b was fitted for the NCs and reproduced from Fig. 5a. The solid lines in Fig. 5b show the dependencies for SMBHs obtained by McConnell et al. [81]: the bold line corresponds to S0 and E galaxies and the thin one – to spiral galaxies. The lenticular galaxies in our sample (small, hollow circles) lie on a common dependence with the spiral galaxies, but are shifted by , on average, relative to the dependence constucted in [81] for elliptical galaxies.
The parameters of linear regressions for galaxies with NCs and SMBHs, corresponding to the half-angle between the direct and inverse regression lines, are presented in Tables 2 and 3, together with their standard errors and correlation coefficients .
4 MASSES OF THE CENTRAL OBJECTS AND THE GALAXY COLOR INDICES
Since the growth mechanisms for the NCs and SMBHs are directly or indirectly connected with the evolution of stellar population, we consider below the relationship between their masses and the colors of parent galaxies, using the () color index, corrected for absorption and reduced to a face-on orientation of the disk (according to [33]). For Mkn 279, which has a bright blue nucleus that affects the integrated color, we used the color index of the outer region, outside the effective radius containing half the total luminosity.
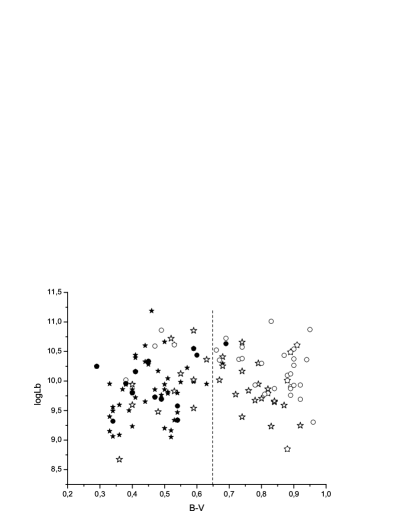
Figure 6 shows a luminosity–color diagram for the galaxies. The overall sample of galaxies clearly splits into two groups separated by . Here we tentatively adopt as the boundary. These groups are well known as the red and blue sequences of galaxies in the bimodal distribution of color indices in the color–luminosity diagram (see, e.g., [82–85]). The blue group contains galaxies with active star formation, whereas the red group is formed by passively evolving galaxies, in which star formation is very weak or absent. This bimodal color distribution is a common feature of galaxies; it takes place independently on the environment density of galaxies [85, 86] and corresponds fairly well to the separation into early and late morphological types (the hollow and filled symbols in Fig. 6).
| 0.74 | |||
| 0.74 | |||
| 0.75 | |||
| 0.71 | |||
| 0.66 |
| 0.70 | |||
| 0.56 | |||
| 0.43 | |||
| 0.55 | |||
| 0.81 |
The bimodal nature of the galaxy color-index distribution indicates that the transition of galaxies from the blue to the red sequence must occur fairly quickly, at some stage of the evolution. Several hypothetical mechanisms for this transition have been considered (see the discussions of this problem by Gonsalves et al. [86], Mendez et al. [87], Gabor et al. [88], di Matteo et al. [89]). Both internal and external mechanisms that can halt star formation, but do not destroy the stellar disk, are possible. If we exclude from consideration the rich clusters of galaxies, where galaxies actively interact with the environment, an efficient mechanism that can halt star formation in massive galaxies is the sweeping a gas out from the inner regions during a stage of high nuclear activity, which could be associated with galaxy mergers [89, 90]. Nuclear activity can also stop the accretion of gas from a halo onto a disk, which, in turn, inhibits the formation of stars [91].
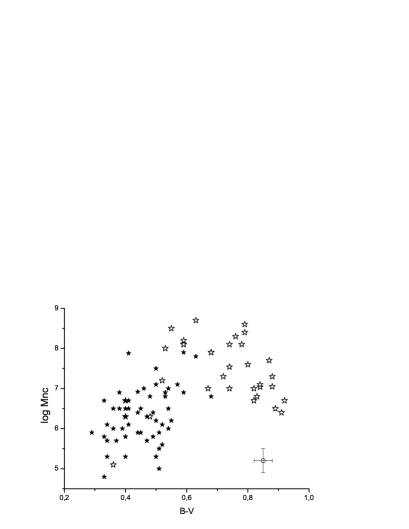
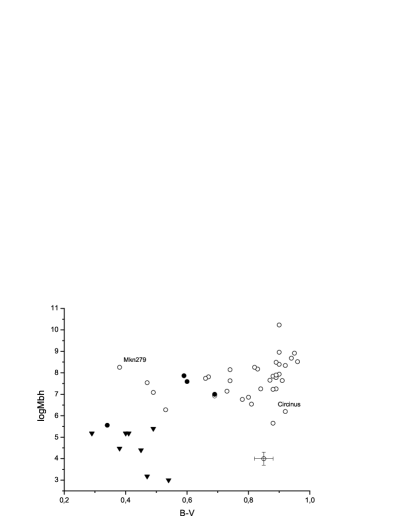
The estimated masses of the central objects – NCs and SMBHs – also dispart according to the colors or morhological types of parent galaxies (Fig. 7). A red group contains more massive (in the mean) nuclear clusters or black holes, whereas a blue group combines most of the low-mass central objects. At the same time, there is no dependence of or on the color index within each color group (for galaxies with massive NCs, there may even be an inverse dependence). An abrupt change in the relative mass between early and late-type galaxies was pointed out earlier by Erwin and Gadotti [9]. However, a considerable fraction of early-type galaxies in [9] are ellipticals, which have different star-formation histories, whereas here we consider the disky galaxies only.
Almost all galaxies, in which or does not exceed a few million , belong to the blue group. Thus, the masses of NC or SMBH are connected not only with the mass (density) of the central regions of galaxies, but also with the star formation in the entire disk.
It is important that the ``red'' and ``blue'' galaxies are not distinguished on the diagrams where the NC masses are compared with the properties of the host galaxies: their rotation velocity ( or ), total mass, and mass of stellar population. In contrast, SMBH masses are in most cases much higher for ``red'' galaxies than for ``blue'' ones, even for the analogous parameters of galactic disks. This diference is most clearly visible when we compare the masses of the central objects with the total masses for galaxies of both color groups (Fig. 8). One may concludee that the red-group galaxies usually possess much more massive central SMBHs than blue-group galaxies with the same rotation velocities (Fig. 8b), which is not true of the NCs (Fig. 8a). It agrees well with a scenario in which the decrease of star formation rate which makea a galaxy to be ``red`` is the result of high nuclear activity associated with already formed massive SMBH at an early stage of the galaxy's evolution. The ejection of a large amount of energy by an active nucleus leads to the compression and throwing gas out of central region of a galaxy, or even from the entire galaxy (see, e.g., [90–93]), or to the cessation of gas accretion onto the disk from the halo [91], which moves a galaxy into the passively evolving red sequence. Indications of intense gas outflows from the central parts of galaxies containing quasars are indeed observed [94]. Judging from the values for the ``red'' galaxies (Fig. 7b), the SMBH mass must exceed a few to halt star formation, with a higher threshold probably required for more massive galaxies (Fig. 8b).
The impact of active nucleus on the NCs is not entirely clear (see the discussion in [6]), however it is obvious that it should halt the rapid growth phase of either SMBH or NC. Since the red-group galaxies (mostly of earlier morphological types) cannot be distinguished in the diagrams (as well as in the other diagrams), the nuclear clusters inside these galaxies either managed to avoid the destruction during the active phase of nucleus, or they began their growth after this violent phase.
5 CONCLUSIONS
1. Using the available kinematic and photometric data for disk galaxies, we have confirmed the existence of correlations between the masses of the central objects (nuclear clusters and supermassive black holes) and various kinematic parameters of the galaxies: the maximum rotation velocity, the angular velocity of the central region, the dynamical mass inside the optical radius, the central velocity dispersion, and also the mass of the stellar population. The correlations are tighter for NCs than for SMBHs, except for the correlation with the central velocity dispersion, which is closely connected with the SMBH mass. In all cases, the dependencies for SMBH masses () are steeper than for NC masses (), although this difference is determined by the late-type galaxies only, whose central black holes, if present, have very low masses.
2. The NC masses are probably more closely related with the galactic dark halos than are the SMBH masses. This is indicated by the tighter correlations between and the total mass of the galaxy (which is the sum of the baryonic and dark masses) inside the optical radius, and also with the velocity , which characterizes the virial mass of the halo. In addition, the slope of the dependence turns out to be close to the corresponding relation for SMBHs in numerical models relating the black hole' mass to the virial mass of the halo. This relationship between the NCs and the dark halo allows to suggest that the gravitational potential well, created by the central density peak (cusp) of the dark matter (which may later disapppear, see, e.g., [95]), may determine the growth condition of an NC in a young galaxy.
3. The black-hole masses are systematically higher in lenticular galaxies than in spiral galaxies with similar values of or , or the mass of the stellar population (Figs. 1b, 2b, 3b, 4b). This indicates that the formation of at least a substantial fraction of S0 galaxies seems to be connected with the existence of massive central SMBHs in these galaxies.
4. The galaxies of our samples clearly divide into blue and red groups on the diagram ``Color index - total luminosity''. The red group mostly contains S0–Sb galaxies with low star formation rate (Fig. 7). ``Red'' galaxies have much higher black-hole masses than the ``blue'' ones with similar host-galaxy masses or rotation velocities (Figs. 1b, 2b, 3b, 4b, 8b).
5. The situation with the NCs is different: there is no statistically significant distinction between the galaxy color groups in the ``NC mass — Galaxy mass'' diagram (Fig. 8). Irrespective of its color (although with a fairly large dispersion), the mass of an NC is determined by parameters such as the disk rotation velocity, the dynamical mass inside the optical radius, and the total stellar mass of a galaxy. This agrees with a scenario in which the growth of the SMBHs was determined first and foremost by the physical conditions at the very center of the host galaxy, whereas the resulting masses of the NCs are mostly related to the galaxies' integrated characteristics.
6. Our conclusion that the red-sequence galaxies tend to have more massive central black holes agrees well with the idea that the division of galaxies into two color groups may be a result of the partial or virtually total (as in the case of most S0 galaxies) loss of gas during a stage of high nuclear activity caused by the existence of massive SMBH. The threshold value of , providing the transition to the red group, is , and evidently depends on the total mass of a galaxy. However, the occurrence of outbursts of nuclear activity need not imply the destruction of a nuclear cluster at the disk center, because its mass remains statistically tied with the properties of a parent galaxy. Otherwise the formation of central stellar cluster in a galaxy should begin after the phase of violent activity.
6 ACKNOWLEGEMENTS
We acknowledge the usage of the HyperLeda database (http://leda.univ-lyon1.fr).
References
- (1) F. Shankar, New Astron. Rev. 53, 57 (2009).
- (2) E. H. Wehner and W. E. Harris, Astrophys. J. Lett. 644, L17 (2006).
- (3) A. Seth, M. Agueros, D. Lee, and A. Basu-Zych, Astrophys. J. 678, 116 (2008).
- (4) J. Rossa, R. P. van der Marel, T. Böker, et al., Astron. J. 132, 1074 (2006).
- (5) A. W. Graham and R. L. Spitler, Mon. Not. R. Astron. Soc. 307, 2148 (2009).
- (6) N. Neumayer and C. J. Walcher, Adv. Astron. 2012, 709038 (2012).
- (7) A. W. Graham, C. A. Onken, E. Athasnassoula, and F. Combes, Mon. Not. R. Astron. Soc. 412, 2211 (2011).
- (8) J. Kormendy, R. Bender, and M. E. Cornell, Nature 469, 374 (2011).
- (9) P. Erwin and D. A. Gadotti, Adv. Aston. 2012, 1 (2012).
- (10) L. Ferrarese, P. Cote, E. Dalla Bonta et al., Astrophys. J. Lett. 644, L21 (2006).
- (11) A. V. Zasov, A. M. Cherepashchuk, and I. Yu. Katkov, Astron. Rep. 55, 595 (2011).
- (12) N. Scott and A. W. Graham, Astrophys. J. 763, 76 (2013).
- (13) V. L Afanasiev, Sov. Phys. Usp. 29, 980 (1986).
- (14) A. V. Zasov, A. M. Cherepashchuk, and L. N. Petrochenko, Astron. Rep. 49, 362 (2005).
- (15) A. S. Ilyin, K. P. Zybin, and A. V. Gurevich, J. Exp. Theor. Phys. 98, 1 (2004); arXiv:astro-ph/0306490 (2003).
- (16) M. Volonteri, F. Haardt, and P. Madau, Astrophys. J. 582, 559 (2003).
- (17) M. Volonteri, N. Priyamada, and K. Gultekin, Astrophys. J. 737, 50 (2011)
- (18) C. M. Booth and J. Schaye, Mon. Not. R. Astron. Soc. 405, L1 (2010).
- (19) E. Barrause, Mon. Not. R. Astron. Soc. 423, 2533 (2012).
- (20) T. Di Matteo, R. A. C. Croft, V. Springel, and L. Hernquist, Astrophys. J. 593, 56 (2003).
- (21) L. Ferrarese, Astrophys. J. 576, 901 (2002).
- (22) A. Dutton, C. Convoy, F. C. van den Bosch, et al., Mon. Not. R. Astron. Soc. 407, 2 (2010).
- (23) R. Reyes, R. Mandelbaum, J. E. Gunn, et al., Mon. Not. R. Astron. Soc. 425, 2610 (2012).
- (24) M. Baes, P. Buyle, G. K. T. Hau, and H. Dejonghe, Mon. Not. R. Astron. Soc. 341, L44 (2003).
- (25) A. Beifiori, S. Courteau, E. Corsini, and Y. Zhu, Mon. Not. R. Astron. Soc. 419, 2497 (2012).
- (26) A. W. Graham, Publ. Astron. Soc. Austral. 25, 167 (2008).
- (27) A. W. Graham, Mon. Not. R. Astron. Soc. 422, 1586 (2012).
- (28) A. M. Cherepashchuk, V. L. Afanasiev, A. V. Zasov, and I. Yu. Katkov, Astron. Rep. 54, 578 (2010).
- (29) T. Böker, R. P. van der Marel, and W. D. Vacca, Astron. J. 118, 831 (1999).
- (30) A. C. Seth, M. Capellari, M. Neumayer, et al., Astrophys. J. 714, 713 (2010).
- (31) K. Gebhardt, T. R. Layer, J. Kormendy, et al., Astron. J. 122, 2469 (2001).
- (32) S. C. E. van den Bosch, K. Gebhardt, K. Gultekin, et al., Nature 491, 729 (2012).
- (33) Paturel G., Petit C., Prugniel P., et al., A&A, 412, 45 (2003): HYPERLEDA: Database for physics of galaxies. http://leda.univ-lyon1.fr/
- (34) Y. Sofue, T. Tutui, M. Honma, et al., Astrophys. J. 523, 136 (1999).
- (35) K. Fathi, J. E. Beckman, N. Pinol-Ferrer et al., Astrophys. J. 704, 1657 (2009).
- (36) K. L. Jones, B. S. Koribalski, M. Elmouttie et al., Mon. Not. R. Astron. Soc. 302, 649 (1999).
- (37) Y. Sofue, Publ. Astron. Soc. Jpn. 64, 75 (2012).
- (38) L. M. Widrow, K. M. Perrett, and S. H. Suyu, Astrophys. J. 588, 311 (2003).
- (39) S. A. Kassin, R. S. de Jong, and B. J. Weiner, Astrophys. J. 643, 804 (2006).
- (40) J. Hlavacek-Lorrado, M. Marcelin, B. Epinat, et al., Mon. Not. R. Astron. Soc. 416, 509 (2011).
- (41) V. C. Rubin and W. K. Ford, Astrophys. J. 271, 556 (1983).
- (42) I. Yu. Katkov, I. Chilingarian, O. Sil'chenko, et al., Baltic Astron. 20, 453 (2011).
- (43) E. Corbelli, Mon. Not. R. Astron. Soc. 342, 199 (2003).
- (44) F. Simien and Ph. Prugniel, Astron. Astrophys. Suppl. Ser. 126, 519 (1997).
- (45) D. A. Kornreich, M. P. Haynes, R. V. E. Lovelace, and L. van Zee, Astron. J. 120, 139 (2000).
- (46) E. Emsellem, K. Fathi, H. Wozniak, et al., Mon. Not. R. Astron. Soc. 365, 367 (2006).
- (47) P. A. B. Linblad and H. Kristen, Astron. Astrophys. 313, 733 (2006).
- (48) V. C. Rubin, W. K. Ford, N. Thonnard, and D. Burstein, Astrophys. J. 261, 439 (1982).
- (49) A. Omar and K. S. Dwarakanath, J. Astrophys. Astron. 26, 1 (2005).
- (50) G. R. Meurer, L. Staveley-Smith, and N. E.B. Killeen, Mon. Not. R. Astron. Soc. 300, 705 (1998).
- (51) M. Spano, M. Marcelin, P. Amram, et al., Mon. Not. R. Astron. Soc. 383, 297 (2008).
- (52) H.-W. Rix, C. M. Carollo, and K. Freeman, Astrophys. J. Lett. 513, L25 (1999).
- (53) A. M. Fridman, V. L. Afanasiev, S. N. Dodonov, et al., Astron. Astrophys. 430, 67 (2005).
- (54) M. A. Norris, R. M. Sharples, and H. Kuntschner, Mon. Not. R. Astron. Soc. 367, 815 (2006).
- (55) C. C. Mundell, A. Pedlar, D. J. Axon, et al., Mon. Not. R. Astron. Soc. 277, 641 (1995).
- (56) S. Haan, E. Schinnerer, C. G. Mundell, et al., Astron. J. 135, 232 (2008).
- (57) D. Fisher, Astron. J. 113, 950 (1997).
- (58) R. Morganti, P. T. de Zeeuw, amd T. A. Oosterloo, Mon. Not. R. Astron. Soc. 371, 157 (2006).
- (59) I. Marquez, J. Masegosa, M. Moles, et al., Astron. Astrophys. 393, 389 (2002).
- (60) C. Scorza and R. Bender, Astron. Astrophys. 293, 20 (1995).
- (61) N. Caon, D. Macchetto, and M. Pastoriza, Astrophys. J. Suppl. Ser. 127, 39 (2000).
- (62) W. J. de Blok, F. Walter, E. Brinks, et al., Astron. J. 136, 2648 (2008).
- (63) W. D. Pence, K. Taylor, and K. C. Freeman, Astrophys. J. 326, 564 (1988).
- (64) M.-H. Rhee and T. S. van Albada, Astron. Astrophys. Suppl. Ser. 115, 407 (1996).
- (65) M. A. W. Verheijen and R. Sancisi, Astron. Astrophys. 370, 765 (2001).
- (66) V. Rubin, Astron. J. 118, 23 (1999).
- (67) R. P. Olling, Astron. J. 112, 457 (1996).
- (68) V. C. Rubin, A. H. Waterman, and J. D. P. Kenney, Astron. J. 118, 236 (1999).
- (69) J. Pinkney, K. Gebhardt, R. Bender, et al., Astrophys. J. 596, 903 (2003).
- (70) O. Daigle, C. Carignan, P. Amram, et al., Mon. Not. R. Astron. Soc. 367, 469 (2006).
- (71) R. A. Swaters, R. Sancisi, T. S. van Albada, and J. M. van der Hulst, Astron. Astrophys. 493, 871 (2009).
- (72) C. Struve, T. A. Oosterloo, R. Morganti, and L. Saripalli, Astron. Astrophys. 515, A67 (2010).
- (73) D. A. Korneich, M. P. Haynes, K. P. Jore, and R. V. E. Lovelace, Astron. J. 121, 1358 (2001).
- (74) B. Catinella, M. P. Haynes, and R. Giovanelli, Astron. J. 130, 1037 (2005).
- (75) N. Neumayer, C. J. Walcher, D. Andersen, et al., Mon. Not. R. Astron. Soc. 413, 1875 (2011).
- (76) B. Epinat, P. Amram, and M. Marcelin, Mon. Not. R. Astron. Soc. 390, 466 (2008).
- (77) I. Dicaire, C. Carignan, P. Amram, et al., Mon. Not. R. Astron. Soc. 385, 553 (2008).
- (78) F. Simien and Ph. Prugniel, Astron. Astrophys. 384, 371 (2002).
- (79) A. V. Zasov and A. V. Khoperskov, Astron. Lett. 29, 437 (2003).
- (80) T. Into and L. Portinari, Mon. Not. R. Astron. Soc. 430, 2715 (2012).
- (81) N. J. McConnell, Chung-Pei Ma, K. Gebhardt, et al., Nature 480, 215 (2011).
- (82) I. Strateva, V. Ivezic, G. R. Knapp, et al., Astron. J. 122, 1861 (2001).
- (83) I. Baldry, K. Glazebrook, J. Brinkmann, et al., Astrophys. J. 600, 681 (2004).
- (84) G. B. Brammer, K. E. Whitake, P. G. van Dokkum, et al., Astrophys. J. Lett. 706, L173 (2009).
- (85) M. L. Balogh, I. K. Baldry, R. Nichol, et al., Astrophys. J. Lett. 615, L101 (2004).
- (86) T. S. Gonsalves, D. C. Martin, D. Christopher, et al., Astrophys. J. 759, 67 (2012).
- (87) A. J. Mendez, A. L. Coil, J. Lotz, et al., Astrophys. J. 736, 110 (2011).
- (88) J. M. Gabor, R. Dave, B. D. Oppenheimer, and K. Finlator, Mon. Not. R. Astron. Soc. 407, 749 (2010).
- (89) T. Di Matteo, V. Springel, and L. Hernquist, Nature 433, 604 (2005).
- (90) K. Zubovas and F. King, Astrophys. J. Lett. 745, L34 (2012).
- (91) A. Dekel and Y. Birnboim, Mon. Not. R. Astron. Soc. 368, 2 (2006).
- (92) R. Valiante, R. Schneider, R. Maiolino, et al., Mon. Not. R. Astron. Soc. 427, L60 (2012).
- (93) R. Maiolino, S. Gallerani, R. Neri, et al., Mon. Not. R. Astron. Soc. 425, L66 (2012).
- (94) M. Cano-Diaz, R. Maiolino, A. Marconi et al., Astron. Astrophys. 537, L8 (2012).
- (95) S. A. Khoperskov, B. M. Shustov, and A. V. Khoperskov, Astron. Rep. 56, 664 (2012).