Auditory Brain–Computer Interface Paradigm with Head Related Impulse Response–based Spatial Cues***The final publication is available at IEEE Xplore http://ieeexplore.ieee.org and the copyright of the final version has been transferred to IEEE ©2013
Chisaki Nakaizumi1, Koichi Mori2, Toshie Matsui1, Shoji Makino1, and Tomasz M. Rutkowski1,3,†††The corresponding author. E-mail: tomek@tara.tsukuba.ac.jp
1Life Science Center of TARA, University of Tsukuba, Tsukuba, Japan
2Research Institute of National Rehabilitation Center for Persons with Disabilities, Tokorozawa, Japan
3RIKEN Brain Science Institute, Wako-shi, Japan
E-mail: tomek@tara.tsukuba.ac.jp
http://bci-lab.info/
Abstract
The aim of this study is to provide a comprehensive test of head related impulse response (HRIR) for an auditory spatial speller brain–computer interface (BCI) paradigm. The study is conducted with six users in an experimental set up based on five Japanese hiragana vowels. Auditory evoked potentials resulted with encouragingly good and stable “aha–” or P300–responses in real–world online BCI experiments. Our case study indicated that the auditory HRIR spatial sound reproduction paradigm could be a viable alternative to the established multi–loudspeaker surround sound BCI–speller applications, as far as healthy pilot study users are concerned.
Keywords: Auditory BCI; P300; EEG; Brain Signal Processing.
1 Introduction
The majority of successful BCI applications rely on mental visual and motor imagery paradigms, which require long–term user training and good eyesight from the user [1]. Alternative solutions have been proposed recently to utilize spatial auditory [2] or somatosensory modalities [3, 4, 5, 6, 7]. We propose to extend the previously published spatial auditory BCI (saBCI) paradigm [8] by making use of a head–related–impulse–response (HRIR) [9] for virtual sound images spatialization with headphones–based sound reproduction. We test the concept with six BCI users, in a simple five Japanese hiragana (a, i, u, e, o) spatial speller task as previously proposed, and compared with auditory modality, using a vector–based–amplitude–panning (VBAP) approach [8]. HRIR allows for more precise and fully spatial virtual sound images positioning utilizing even not own user’s HRIR measurements [10]. For the experiments reported in the paper we use a public domain CIPIC HRTF Database provided by the University of California, Davis (UC Davis) [9].
The remainder of the paper is organized as follows. In the next section, the experimental setup and the HRIR–based saBCI paradigm are described, together with EEG signal acquisition, pre–processing and classification steps. Next, an analysis of evoked response potentials (ERP) and especially the so–called “aha–’ or response latencies are described. Finally, classification and discussion of the HRIR–based saBCI paradigm information transfer rate (ITR) results conclude the paper, together with future research directions.
2 Materials and Methods
All of the experiments were performed in the Life Science Center of TARA, University of Tsukuba, Japan. Six volunteer users participated in the experiments. The average age of the users was years old (standard deviation years old,; one females and five males). The psychophysical and online EEG BCI experiments were conducted in accordance with The World Medical Association Declaration of Helsinki - Ethical Principles for Medical Research Involving Human Subjects. The experimental procedures were approved and designed in agreement with the ethical committee guidelines of the Faculty of Engineering, Information and Systems at University of Tsukuba, Japan. The experiments were designed to reproduce the previously reported VBAP–based spatial auditory experiments [8] this time with the more precise HRIR–based spatial auditory BCI stimulus reproduction to simplify the previously reported real sound sources generated with surround sound loudspeakers [2, 11].
2.1 Spatial Stimulus Sound Generation with HRIR and Reproduction to the User via Headphones
The sound stimuli chosen for the subsequent psychophysical and saBCI experiment were the Japanese synthetic female voice utterances generated using a say line–command of the MacOS X computer operating system by Apple Inc. The synthetic female voice labeled as Kyoko was chosen. The five Japanese vowels a, i, u, e, and o were selected. Each stimulus was in a length range of ms. The generated synthetic sounds frequency spectra were within a limit of Hz.
Next the the monaural stimulus sounds were spatialized by using the public domain CIPIC HRTF Database [9] and Matlab based signal processing functions. The HRIR model measured for the user of the CIPIC HRTF Database was chosen. Each Japanese vowel was set on horizontal plane with the same distance from the user’s head at the azimuth locations of ,, , , for the a, i, u, e, o vowels respectively. In order to generate a stereo sound of a vowel placed at a spatial location at azimuth and elevation of the following procedure was applied. Let and be the minimum–phase impulse responses from the CIPIC HRTF Database measured at the chosen azimuth and the elevation at the left () and right () ears. The respective magnitude responses obtained from Fourier transformed HRIR, the so–called head related transfer functions (HRTF), could be obtained as and . The stereo spatial sound delivered via headphones to the left and right ears respectively could be constructed, in time domain using HRIR, as a two–dimensional signal composed of the left and and right headphone channels as follows,
| (1) | |||
| (2) |
where denotes sample time delay and is the HRIR length as obtained from the CIPIC HRTF Database [9]. The so optioned spatial acoustic stimuli were delivered to the left and right ears of the user using the ear–fitting portable headphones.
2.2 Psychophysical Experiment Protocol
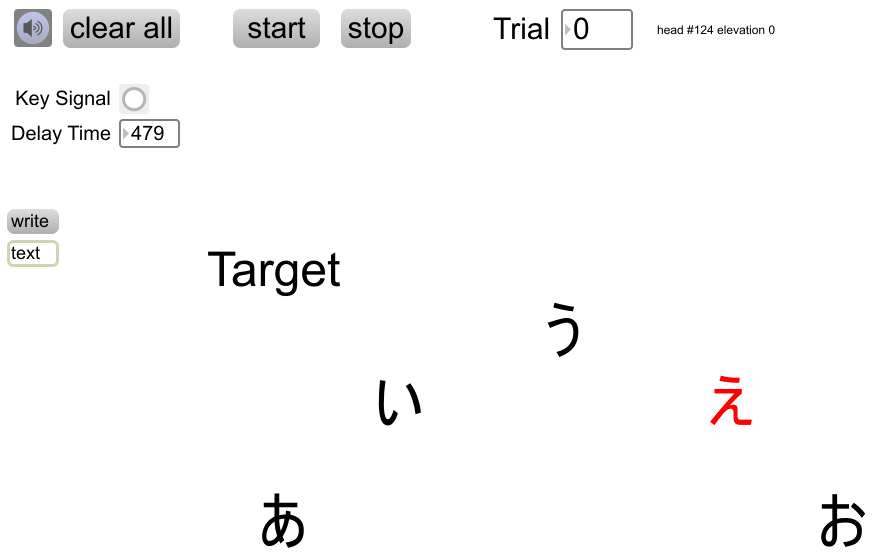
The psychophysical experiments were conducted to investigate the response time and recognition accuracy by each user for the spatial Japanese vowel stimuli. The original monaural sound stimuli were spatialized using the HRIR–database filters as in equations (1) and (2) using a MAX 6 [12] patcher developed by our team. An user instruction visual interface is depicted in Figure 1. The Japanese hiragana character marked in red color, in the above figure, represented a current spatial target which user should attend and respond to using a computer keyboard as soon as possible after the perceived and recognized utterance. The other marked in black Japanese vowel stimuli, indicating non–targets, were ignored as in a classical oddball paradigm [1]. The instruction which spatial target stimulus to attend was delivered audio–visually, while during the following experimental oddball sequence only auditory modality was used.
The user was instructed in each trial to pay attention to the target stimulus vowel type and its spatial location, as well to respond by pressing a computer keyboard key as soon as the target stimulus was heard. The behavioral response times were collected with the same MAX 6 patcher program used to display instructions (see Figure 1) and to generate the HRIR spatial sounds.
Each single trial was comprised of randomly presented single target and four non–target vowel stimuli. An inter–stimulus–interval (ISI) was set for a one second in order to give the user time for coronet behavioral response. Each trial with presented five stimuli was separated with two seconds break. We conducted trials for each vowel as the target in the sequence. Finally we recorded responses of target and non-target stimuli in the psychophysical experiment. Results of the psychophysical experiments are discussed in the Section 3.1.
2.3 EEG Experiment Protocol
In the EEG saBCI online experiment the brainwave signals were collected by a bio–signal amplifier system g.USBamp by g.tec Medical Engineering GmbH, Austria. The EEG signals were captured by sixteen active gel–based electrodes attached to the following head locations Cz, Pz, P3, P4, Cp5, Cp6, P1, P2, Poz, C1, C2, FC1, FC2, and FCz as in the extended international system [13]. The ground electrode was attached on the forehead at the FPz location, and the reference on the left user’s earlobe respectively.
The spatial auditory stimuli were delivered, as in the preceding psychophysical experiments, using small headphones. The stimuli were generated using the same MAX 6 patcher as in the psychophysical experiment (see Figure 1) yet in this case triggers were produced by an BCI2000 [14] EEG acquisition and processing environment used on our study. The triggers were communicated from the BCI2000 to the the MAX 6 patcher using an internet user datagram protocol (UDP).
The BCI2000 environment’s visual user interface was used to display the target stimulus instructions. The online classification results were also presented using the same display. In a single Japanese hiragana vowel spelling session target and non–target stimuli were presented. Through the whole five vowels spelling session target and non–target stimuli were delivered. The ISI in the EEG experiment was shorter comparing to the preceding psychophysical experiments and set in a range of ms (allowing for a random jitter within ms to break presentation’s unnecessary rhythm), since the brain event related potentials (ERP), especially the “aha–“ or P300–responses, had no jitter comparing to the behavioral keyboard presses (compare results in Figures 3 and 4). Each spatial auditory stimulus duration was set to ms. The EEG sampling rate was set to Hz and the notch filter to remove electric power lines interface of Hz was applied in a rejection band of Hz, according to the East Japan power stations specification. The high–pass filter was set at Hz and low–pass at Hz cutoff frequencies. Please note that the aim of this research is not noise and artifacts reduction [15], but comprehensive test of HRIR usability for the novel saBCI paradigm.
3 Results
This section presents and discusses results obtained from the psychophysical and EEG saBCI experiments conducted with six subjects as described in the previous sections.
3.1 Psychophysical Experiment Results
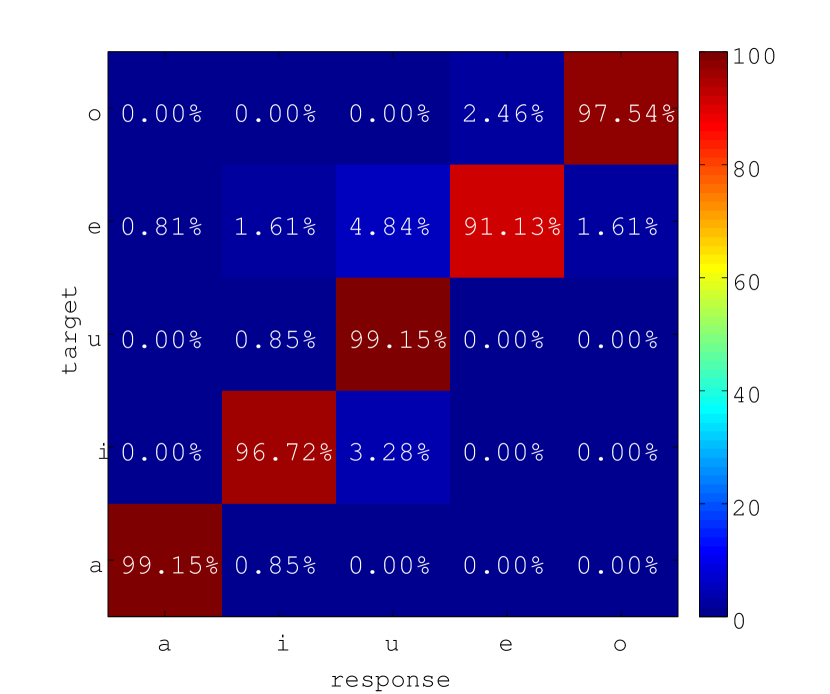
The psychophysical experiment user best response accuracy results are summarized in Table 1. All of the participants managed to reach perfect score at least once with accuracy which indicated the first confirmation of the HRIR–based spatial sound usability for the saBCI paradigm. Averaged responses are indicated in a form of confusion matrix depicted in Figure 2. The confusion matrix has visualized on a diagonal the correct response accuracies (the majorities in our case) while on off–diagonals the mistakes. The averaged targets were scored above accuracy.
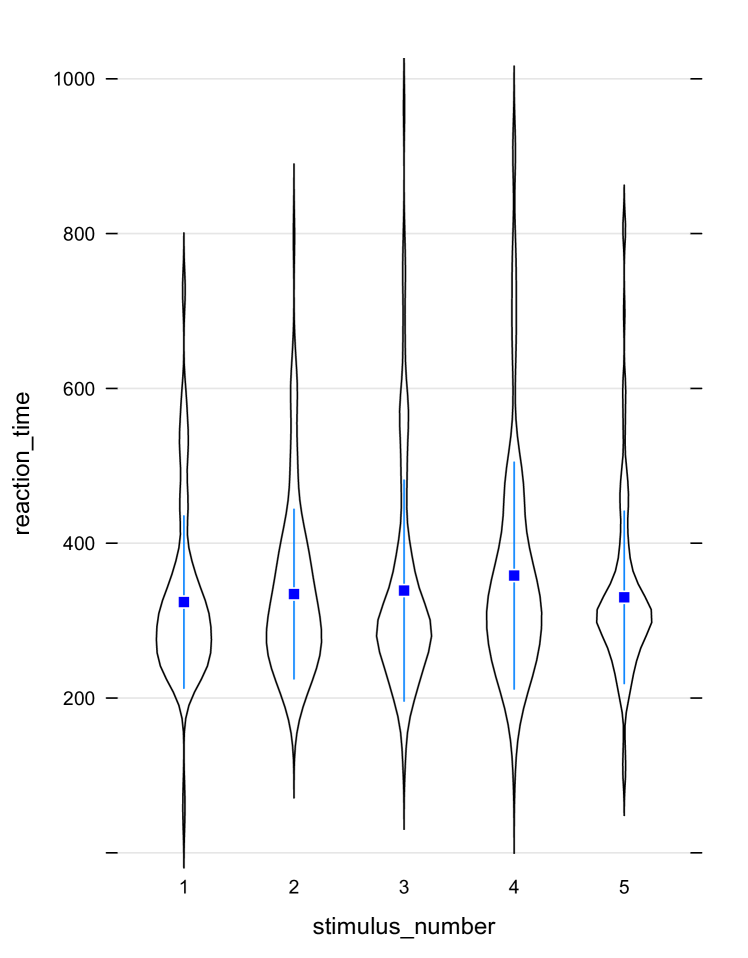
Figure 3 presents analysis of response time delays in form of violin–plots depicting distributions, median and interquartile ranges. Pairwise Wilcoxon rank sum tests revealed no significant differences among medians of the response distributions further confirming the HRIR–based spatial stimuli for the saBCI experiments.
3.2 EEG Experiment Results
The results of the EEG experiment are summarized in Figures 4 and 5, as well as in Tables 2 and 3. Table 2 presents the online classification accuracies of the P300 responses as obtained with the SWLDA classifier. All the six users scored well above the chance level of . There were two users who resulted with accuracies in online saBCI experiments.
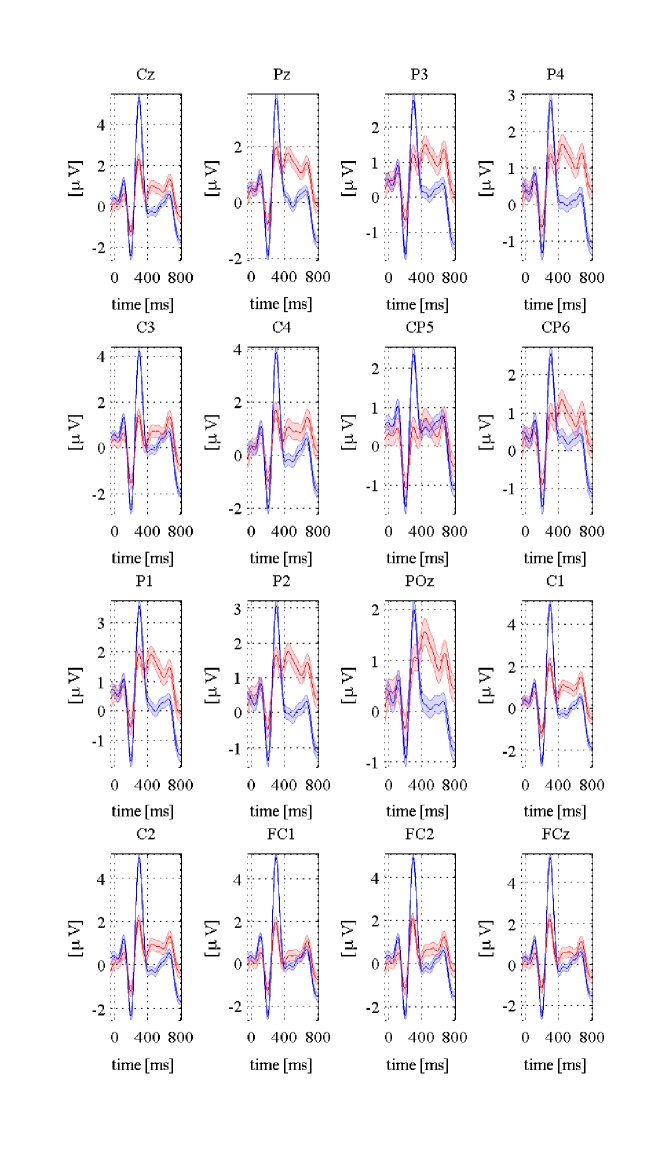
Figure 4 presents the averaged ERP brain responses for all electrodes separately together with standard error bars to target (red lines) and non–target (blue lines) stimuli. The obvious P300 responses could be clearly seen in the ms latencies.
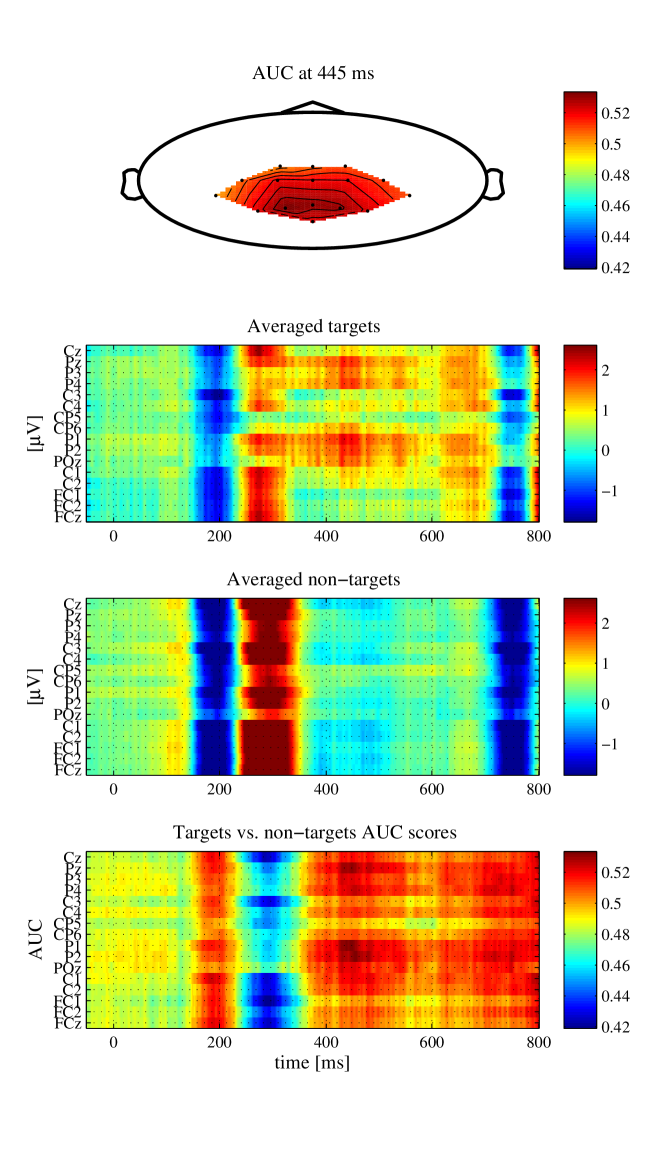
Figure 5 summarizes the results as a scalp topography in the top panel with maximum areas under the curve (AUC) [11] values for target vs. non–target latencies. The topographic plot also reflects the EEG electrodes positions used in the experiments. Although most of the electrodes produced significant P300 potential differences (see also Figure 4), the parietal cortex (the back of the head) resulted with more pronounced differences. The second panel from the top in the Figure 5 indicates the averaged ERP responses to the target, while the third panel to the non–target stimuli respectively. The bottom panel indicates the AUC of target versus non-target responses clearly confirming the ms latencies usability for the subsequent classification.
The presented EEG ERP results confirmed that the HRIR–based spatial auditory stimuli evoked the P300 response possible to classify in the online saBCI experiments with –trails averaging.
Table 3 reports the obtained ITR scores in a range of bit/min. The average ITR for the six participants in our study was bit/min. The ITR was calculated as follows[11]:
| (3) | |||||
where was the classification speed in selections/minute ( selections/minute for this study); represented the number of bits/selection; was the number of classes ( in this study); was the classifier accuracy as in the Table 2.
4 Conclusions
We conducted a series of psychophysical and online EEG saBCI paradigm experiments in order to evaluate the HRIR–based spatial sound generation system usability. In the psychophysical experiment, the HRIR–based spatial stimuli resulted with close to perfect accuracies. The online saBCI EEG experiment results also show that the HRIR–based spatial sound reproduction method allows for even accuracy as shown with two subject results. This result suggests a great potential in simple headphone–based HRIR spatial sound generation for the saBCI. The presented results confirmed the hypothesis of the possibility to simplify spatial sound–based saBCI paradigms.
This saBCI scored with high accuracy results without bulky multiple spatially distributed loudspeakers to generate stimuli. Nevertheless, current pilot study is not yet ready to compete with faster visual BCI spellers, for example. Furthermore, it is necessary to improve ITR for comfortable spelling. We plan to continue research with larger number of sound stimuli, with shorter ISI, and with more complex spatial sound patterns.
Author Contributions
Designed and performed the EEG experiments: CN, TMR. Analyzed the data: CN, TMR. Conceived the concept of the HRIR–based saBCI paradigm: TMR, KM. Supported the project: SM, KM, TM. Wrote the paper: CN, TMR.
Acknowledgment
This research was supported in part by the Strategic Information and Communications R&D Promotion Program (SCOPE) no. 121803027 of The Ministry of Internal Affairs and Communication in Japan.
References
- 1. Wolpaw J, Wolpaw EW, editors (2012) Brain-Computer Interfaces: Principles and Practice. Oxford University Press.
- 2. Rutkowski TM, Cichocki A, Mandic DP (2009) Spatial auditory paradigms for brain computer/machine interfacing. In: International Workshop On The Principles and Applications of Spatial Hearing 2009 (IWPASH 2009) - Proceedings of the International Workshop. Miyagi-Zao Royal Hotel, Sendai, Japan, p. P5.
- 3. Muller-Putz G, Scherer R, Neuper C, Pfurtscheller G (2006) Steady-state somatosensory evoked potentials: suitable brain signals for brain-computer interfaces? Neural Systems and Rehabilitation Engineering, IEEE Transactions on 14: 30-37.
- 4. Brouwer AM, Van Erp JBF (2010) A tactile P300 brain-computer interface. Frontiers in Neuroscience 4.
- 5. van der Waal M, Severens M, Geuze J, Desain P (2012) Introducing the tactile speller: an ERP-based brain–computer interface for communication. Journal of Neural Engineering 9: 045002.
- 6. Mori H, Matsumoto Y, Struzik ZR, Mori K, Makino S, et al. (2013) Multi-command tactile and auditory brain computer interface based on head position stimulation. In: Proceedings of the Fifth International Brain-Computer Interface Meeting 2013. Asilomar Conference Center, Pacific Grove, CA USA: Graz University of Technology Publishing House, Austria, p. Article ID: 095. doi:10.3217/978-4-83452-381-5/095.
- 7. Kaufmann T, Holz EM, Kuebler A (2013) Comparison of tactile, auditory and visual modality for brain-computer interface use: A case study with a patient in the locked-in state. Frontiers in Neuroscience 7.
- 8. Chang M, Nishikawa N, Struzik ZR, Mori K, Makino S, et al. (2013) Comparison of P300 responses in auditory, visual and audiovisual spatial speller BCI paradigms. In: Proceedings of the Fifth International Brain-Computer Interface Meeting 2013. Asilomar Conference Center, Pacific Grove, CA USA: Graz University of Technology Publishing House, Austria, p. Article ID: 156. doi:10.3217/978-3-85125-260-6-156.
- 9. Algazi VR, Duda RO, Thompson DM, Avendano C (2001) The CIPIC HRTF database. In: 2001 IEEE Workshop on the Applications of Signal Processing to Audio and Acoustics. IEEE, pp. 99–102.
- 10. Schnupp J, Nelken I, King A (2010) Auditory Neuroscience - Making Sense of Sound. MIT Press.
- 11. Schreuder M, Blankertz B, Tangermann M (2010) A new auditory multi-class brain-computer interface paradigm: Spatial hearing as an informative cue. PLoS ONE 5: e9813.
- 12. (2012). Max 6. URL http://cycling74.com/.
- 13. Jurcak V, Tsuzuki D, Dan I (2007) 10/20, 10/10, and 10/5 systems revisited: Their validity as relative head-surface-based positioning systems. NeuroImage 34: 1600 - 1611.
- 14. Schalk G, Mellinger J (2010) A Practical Guide to Brain–Computer Interfacing with BCI2000. Springer-Verlag London Limited. URL http://www.schalklab.org/research/bci2000.
- 15. Rutkowski TM, Mandic DP, Cichocki A, Przybyszewski AW (2010) EMD approach to multichannel EEG data - the amplitude and phase components clustering analysis. Journal of Circuits, Systems, and Computers (JCSC) 19: 215-229.
- 16. Cai Z, Makino S, Rutkowski TM (2013) Brain evoked potential latencies optimization for spatial auditory brain-computer interface. Cognitive Computation : (online first).
Tables
| User number | The best psychophysical accuracy |
|---|---|
| Average: |
| User number | Online BCI experiment SWLDA accuracy |
|---|---|
| Average: |
| User number | ITR scores |
|---|---|
| bit/min | |
| bit/min | |
| bit/min | |
| bit/min | |
| bit/min | |
| bit/min | |
| Average: | bit/min |
Figures