Green Bank Telescope observations of low column density H I around NGC 2997 and NGC 6946
Abstract
Observations of ongoing H I accretion in nearby galaxies have only identified about 10% of the needed fuel to sustain star formation in these galaxies. Most of these observations have been conducted using interferometers and may have missed lower column density, diffuse, H I gas that may trace the missing 90% of gas. Such gas may represent the so-called “cold flows” predicted by current theories of galaxy formation to have never been heated above the virial temperature of the dark matter halo. As a first attempt to identify such cold flows around nearby galaxies and complete the census of H I down to 1018cm-2, I used the Robert C. Byrd Green Bank Telescope (GBT) to map the circumgalactic (r100-200 kpc) H I environment around NGC 2997 and NGC 6946. The resulting GBT observations cover a four square degree area around each galaxy with a 5 detection limit of 1018cm-2 over a 20 km s-1 linewidth. This project complements absorption line studies, which are well-suited to the regime of lower . Around NGC 2997, the GBT H I data reveal an extended H I disk and all of its surrounding gas-rich satellite galaxies, but no filamentary features. Furthermore, the H I mass as measured with the GBT is only 7% higher than past interferometric measurements. After correcting for resolution differences, the H I extent of the galaxy is 23% larger at the 1.21018cm-2 level as measured by the GBT. On the other hand, the H I observations of NGC 6946 reveal a filamentary feature apparently connecting NGC 6946 with its nearest companions. This H I filament has 51018cm-2 and a FWHM of 555 km s-1and was invisible in past interferometer observations. The properties of this filament are broadly consistent with being a cold flow or debris from a past tidal interaction between NGC 6946 and its satellites.
1 Introduction
There have been many detections of low mass neutral hydrogen (H I) clouds accreting onto nearby galaxies (see Sancisi et al., 2008, and references therein). The inferred accretion rate of such clouds, however, is only 0.1-0.2 yr-1; an order of magnitude lower that what is needed to fuel continued star formation in galaxies (Sancisi et al., 2008; Kauffmann et al., 2010). This discrepancy either implies that star formation in galaxies will cease in the next few billion years or that our census of gas around galaxies in incomplete. It should come as no surprise that H I observations may be missing a large reservoir of gas around galaxies. Most past detections of H I clouds have been made with interferometers with H I column density sensitivities of 1019cm-2. Below this level hydrogen is believed to be mostly ionized and so only a small fraction of the gas will be visible as H I (Maloney, 1993). Such gas is likely to be more diffuse than the H I clouds visible at higher column densities, and since interferometer surveys are blind to gas distributed over large angular scales, the current census will be deficient.
There are very few observations of H I emission below 1019cm-2. The most prominent survey was that of Braun & Thilker (2004), who identified a low column density, diffuse, H I filament connecting M 31 and M 33. They attributed this filament to the cosmic web similar to those seen in simulations (Popping et al., 2009). In this case, the filament would be an example of a “cold flow” as predicted by Birnboim & Dekel (2003) and Kereš et al. (2005, 2009). Cold flows should be the dominant form of accretion for galaxies with M1011.4 and in the lowest density environments, n1 h3Mpc-3 (Kereš et al., 2005). M 31 has M1.31012 (Corbelli et al., 2010), so cold accretion is an unlikely explanation. On the other hand, numerous other authors have suggested that this H I filament can be explained as a tidal feature from a past encounter between the two galaxies (Bekki, 2008; Putman et al., 2009). This hypothesis is supported by the extensive stellar streams seen around M 31 and M 33 (Ibata et al., 2001, 2007; Ferguson et al., 2002) as well as apparent tidal features seen in the H I distribution of M 33 (Putman et al., 2009) and simulations that broadly match the distribution of material in the system (Bekki, 2008). While more sensitive, higher resolution observations by Wolfe et al. (2013), show that this H I filament is actually composed of small H I clouds with 104-5, diameters less than a few kpc, and 1018cm-2, the best way to distinguish between the two possible origins of the diffuse gas between M 31 and M 33 is to identify other instances of similar gaseous features. Despite the clumpy nature of this filament, if it were located around a more distant galaxy, it would appear as a continuous structure. Furthermore, if the diffuse H I filament is part of a cold flow, then such features should be seen around other galaxies with similar properties. If the filament is tidal, then analogs should only be seen around galaxies that have recently undergone an interaction. As a pilot study to search for analogous H I filaments and to begin to complete the census of H I emission below 1019cm-2, I chose two galaxies with similar properties to M 31: NGC 2997 and NGC 6946.
NGC 2997 is a relatively nearby, D12 Mpc, late-type spiral galaxy (Sc) that resides in the loose group LGG 180, which is composed of 8 gas-rich galaxies (Hess et al., 2009; Pisano et al., 2007, 2011). It has a measured H I rotation velocity of 226 km/s, corresponding to M2.11011 (Hess et al., 2009), and an absolute magnitude of -20.7 mag. It is nearly identical to M 31 in luminosity, but has a lower mass and its nearest known companion is 100 kpc away. NGC 2997 also has a higher star formation rate, 5 M⊙/yr, than M 31, 1 yr-1 (Williams, 2003). Pisano et al. (2007, 2011) observed a 1 Mpc2 area of the group LGG 180 in H I using the Parkes radio telescope down to a rms mass sensitivity of 1106 and a column density sensitivity, for emission filling the 14 beam, of 3.41016cm-2 per 3.3 km s-1 channel and found only H I-rich galaxies; no free-floating H I clouds were detected down to M107. While these observations are quite sensitive, the data were not obtained nor reduced in a manner conducive for detecting large-scale, diffuse H I emission. Hess et al. (2009) followed up these observations by combining 59 hours of archival Australia Telescope Compact Array (ATCA) data with 61 hours of GMRT data to produce an extremely sensitive map of NGC 2997 with 5 rms sensitivities of 2105 and 91018cm-2 per 6.6 km s-1 channel. These data reveal the presence of anomalous H I, some of which is probably related to ongoing gas accretion. While it is tempting to associate this accreted gas with a past interaction, the nearest galaxy is a dwarf 138 kpc away. It is possible, however, that these galaxies are connected via a low column density H I filament, as is seen between M 31 and M 33.
NGC 6946 is also a nearby, D6 Mpc, late-type, SABcd, spiral galaxy that resides in loose group (Rivers et al., 1999; Karachentsev et al., 2000). It has MB=-21.38 mag, brighter than M 31, and a rotation velocity of 160 km s-1, corresponding to Mdyn=9.71010 (Carignan et al., 1990), and a star formation rate of 4 yr-1 (Boomsma et al., 2008). Karachentseva & Karachentsev (1998) and Huchtmeier et al. (1997) identified three gas-rich companions within 50 kpc (projected) from NGC 6946: UGC 11583, HKK97 L149, HKK97 L150. H I mapping of NGC 6946 and companions by Pisano & Wilcots (2000) using the DRAO synthesis telescope revealed no signatures of interactions in the system. Begum & Chengalur (2004) see a hint of mild warps in both UGC 11583 and HKK97 L149 based on their morphology or kinematics, but there is no obvious signature of a recent interaction. Boomsma et al. (2008) conducted very sensitive WSRT observations of NGC 6946 revealing many H I clouds associated with the star-forming disk, and likely originating in a galactic fountain. Boomsma et al. (2008) also found a plume of H I with a similar velocity to its companions and extending in their general direction, but not actually connected to those companions down to a column density sensitivity of 51019cm-2. Since NGC 6946 is prolifically-forming stars (Karachentsev et al., 2005) and has had nine supernovae observed in the past century, the H I clouds may be tracing star-formation or supernovae-driven outflows, or, alternatively, the star formation may be driven by the inflow of these H I clouds from the IGM or a past tidal interaction. The observations I report here will determine if the H I clouds around NGC 2997 and NGC 6946 are associated with any low column density, diffuse H I structures.
2 Observations and Reductions
Radio interferometers are powerful instruments delivering excellent resolution and point source sensitivity while providing a map of sources across their primary beam. Because there is a minimum spacing between telescopes in an interferometer, however, there is a limit to the largest sources they can detect. Single-dish telescopes, while lacking the resolution of interferometers, have much better surface brightness sensitivity and can detect structures on all angular scales. Therefore, to search for low column density H I around NGC 2997 and NGC 6946, I used the Robert C. Byrd Green Bank Telescope (GBT) with its L-band receiver to map a area centered on both galaxies during five observing sessions111Taken as part of GBT project GBT09B-016. between 2009 May 9 - June 29. The GBT is the ideal telescope for this work with its unique combination of angular resolution (9.1) and sensitivity (T20 K); it is the largest, most sensitive radio telescope that can observe these two galaxies. At the distance of NGC 2997, the four square degree survey region corresponds to an area of 0.175 Mpc2; at the distance of NGC 6946, this is an area of 0.044 Mpc2. The map was made by scanning the telescope along lines of constant right ascension and declination making a “basket-weave” map of the area of interest. Each row or column was offset by 3′. In the direction of the scan, a 5 second integration was dumped every 100″ (1.67′), thus assuring that we were Nyquist sampled in both directions. The GBT spectrometer was used with a 12.5 MHz bandwidth, 8192 channels, and 9-level sampling. The band was centered at the frequency of the H I line at the redshifts of NGC 2997 (V⊙ = 1088 km s-1) or NGC 6946 (V⊙ = 48 km s-1). During the scan, the band was frequency-switched 2 MHz from this center frequency with a one second period for calibration purposes.. These observing techniques allow one to recover large-scale emission from NGC 2997 and NGC 6946 across the entire map.
For each observing session, I observed either 3C48, 3C147, or 3C295 as a primary flux calibrator using fluxes from Ott et al. (1994) in order to determine the Tcal values for the noise diode. The resultant values were constant between sessions with Tcal= 1.53 K and 1.54 K for the XX and YY polarizations with an error of 1%. An aperture efficiency of 0.66, appropriate for the GBT at 1420 MHz, was used for the calibrations (Boothroyd et al., 2011) leading to a gain of 2 K Jy-1. The typical system temperature for the observations was 20 K. The frequency-switched spectra were reduced in the standard manner using the getfs procedure in the GBTIDL222http://gbtidl.nrao.edu/ data reduction package. Because of its redshift, for NGC 2997 the frequency-switched data were not folded, since folding them placed the negative Galactic H I emission on top of NGC 2997 itself. This was not a problem for NGC 6946, so the data were folded producing improved noise by a factor of . A third order polynomial was fit to the line-free regions of the spectra to remove any residual baseline structure and continuum sources. I assumed a constant zenith opacity of 0.01 (appropriate at 21 cm, e.g. Chynoweth et al., 2008) to convert the calibrated data into units of T. About 0.4% of all the integrations were flagged due to broadband RFI. Calibrated data were boxcar smoothed to a velocity resolution of 5.15 km s-1, and a velocity range of 900 to 1300 km s-1 and -300 km s-1 to 300 km s-1 was exported from GBTIDL for NGC 2997 and NGC 6946, respectively. The calibrated data were converted into an appropriate format for gridding using the idlToSdfits333developed by Glen Langston of NRAO; documentation at http://wiki.gb.nrao.edu/bin.view/Data/IdlToSdifts. program and then imported into AIPS where it was gridded into a map using the task SDGRD with a convolution function of a Gaussian-tapered circular Bessel function (Mangum et al., 2007). For NGC 2997, an additional fourth order baseline was removed from the data cube using the AIPS task XBASL; no additional baseline removal was needed for the NGC 6946 data. To facilitate comparison with the previous WSRT observations of NGC 6946, the data cube was converted to units of mJy/beam and resampled using the Miriad (Sault et al., 1995) task, REGRID, to a channel spacing of 4.2 km s-1.
For the final map of NGC 2997, the rms noise is 21 mK per 5.15 km s-1 channel equivalent to = 2.01017cm-2 for optically-thin emission filling the 9.2′ GBT beam, or a 5 detection limit for an unresolved source with a linewidth of 20 km s-1 of = 2107. The sensitivity is 45 better than the Hess et al. (2009) survey, while the sensitivity is 100 worse. The final map of NGC 6946 has a rms noise of 15 mK per 5.15 km s-1 channel equivalent to = 1.41017cm-2 for optically-thin emission filling the GBT beam or a 5 detection limit (as described above) of = 3106.
To confirm the reality of an apparent H I filament associated with NGC 6946 an additional pointed observation towards 20:31:56.5, 60:21:27 was made on 2009 July 5. The observation was position-switched: observing the plume for 5 minutes followed by blank sky offset by 1.2° in right ascension for 5 minutes. This cycle was repeated for 2 hours. The getps procedure in GBTIDL was used to reduce the observations using the same Tcal, aperture efficiency, and opacity values listed above. After averaging both polarizations and boxcar-smoothing the final spectrum to 5.15 km s-1 channels, the final rms noise was 3.6 mK (= 3.31016cm-2) per 5.15 km s-1 channel.
3 Results
3.1 NGC 2997
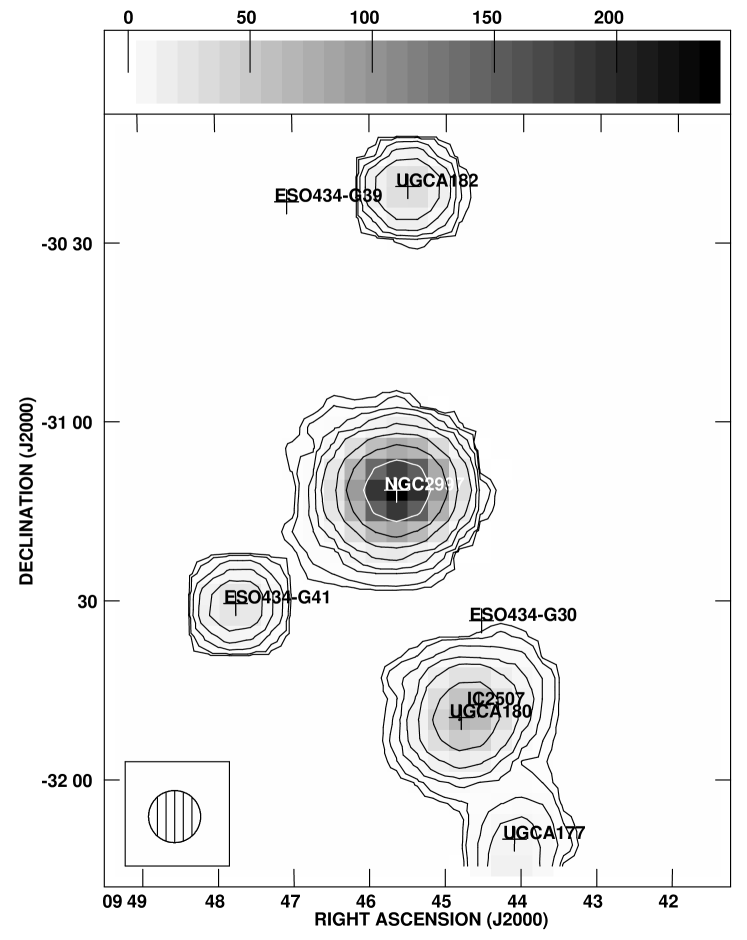
Figure 1 shows the total H I intensity map from the GBT observations of NGC 2997 and its surroundings. The observations reveal all of the galaxies detected by Pisano et al. (2011) using Parkes and the ATCA, but no additional emission. The only known group galaxies in the field that were undetected are ESO 434-G39 at V⊙=1024 km s-1, and ESO 434-G30 at V⊙ = 1288 km s-1. The GBT observations show no clear connections between discrete galaxies; there is no H I filament connecting NGC 2997 with any of its neighbors down to a 5, 20 km s-1 detection limit of =1.21018cm-2. The blending of the H I contours between UGCA 180, IC 2507 and UGCA 177 is not evident in the individual channel maps and appears to just be extended H I emission associated with the individual galaxies.
While no clear filamentary connections are seen between the galaxies, it is possible that there is an extended reservoir of H I around the individual galaxies. there are two ways to check for this: one can compare the H I areal coverage or the integrated H I fluxes for individual galaxies. High quality, sensitive data only exists for NGC 2997, so this analysis will be limited to this galaxy; this comparison cannot be done for the other galaxies in the field since the ATCA observations of Pisano et al. (2011) are much noisier. The integrated H I flux of NGC 2997 from the combined GMRT and ATCA data at low resolution (188110) presented by Hess et al. (2009) yields S180.520.21 Jy km s-1. For the same area, the GBT data yields S194.520.18 Jy km s-1(not including the 1% error in the flux calibration), which is 7.2% higher than the interferometer flux. The two spectra are shown in Figure 2, clearly showing that they are in general agreement except around 1200 km s-1 where the GBT H I flux is clearly higher. This velocity corresponds to that of the east side of NGC 2997, possibly corresponding to the lopsided H I distribution at low column density seen in Figure 1.
As for the areal extent of the H I distribution from the two datasets, we placed both datasets on the same pixel and velocity scale, as above, and convolved the Hess et al. (2009) data to match the resolution of our GBT data. While this improves the column density sensitivity of the Hess et al. (2009) cube, those data are still insensitive to emission on angular scales greater than 20′. To measure the areal extent of both datasets, we then created a total H I intensity (moment 0) map blanked at the 2 level based on the noise measured in each cube. The limit is set by the Hess et al. (2009) data and is 1.21018cm-2 at the 3 level per 6.6 km s-1 channel. The areas of both maps above this level, and their ratios, are listed in Table 1. In general, the area of NGC 2997 as measured with the GBT at a given is larger than that from the interferometer data. The only exceptions are at 1019cm-2 and 51019cm-2. These anomalies are due to the presences of artifacts in the interferometer data that dominate the area of emission at these levels, and is not a physical effect.
We can also examine how the H I extent of NGC 2997 grows as compared to theoretical predictions by Popping et al. (2009, see their Figure 6). Normalizing to the area of NGC 2997 at 1020cm-2, the predicted cumulative area (listed in Table 1) is smaller than the measured area by 20-40% at all lower column densities (Popping et al., 2009). Given the uncertainty of the assumptions used for the simulations, this indicates reasonably good agreement. This is true whether we use the interferometer data or the GBT data alone for the comparison.
3.2 NGC 6946
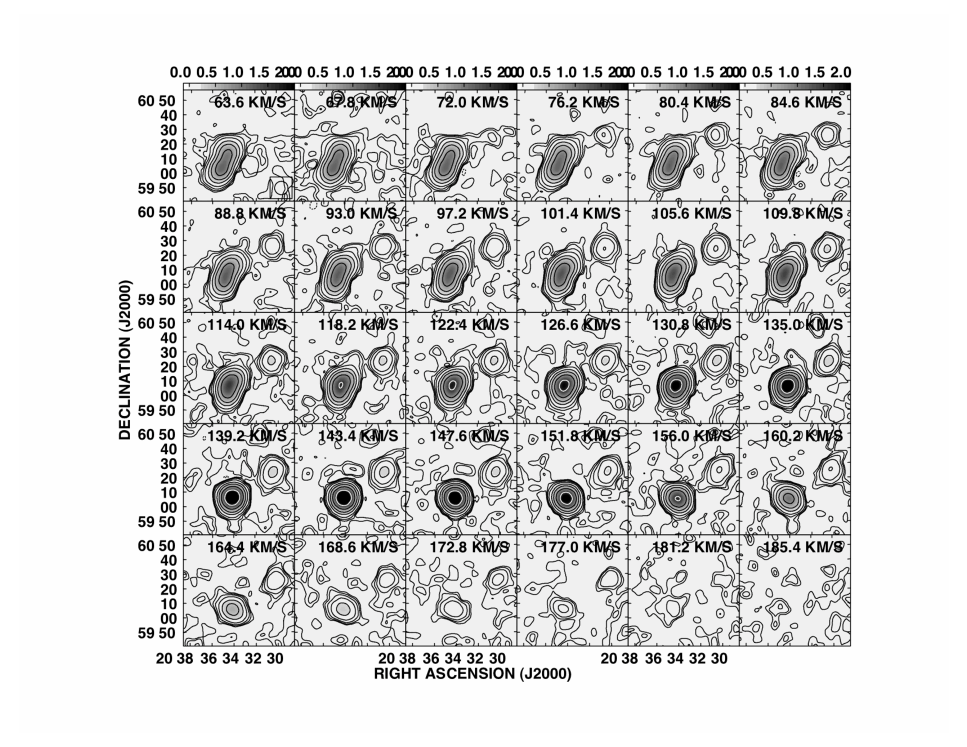
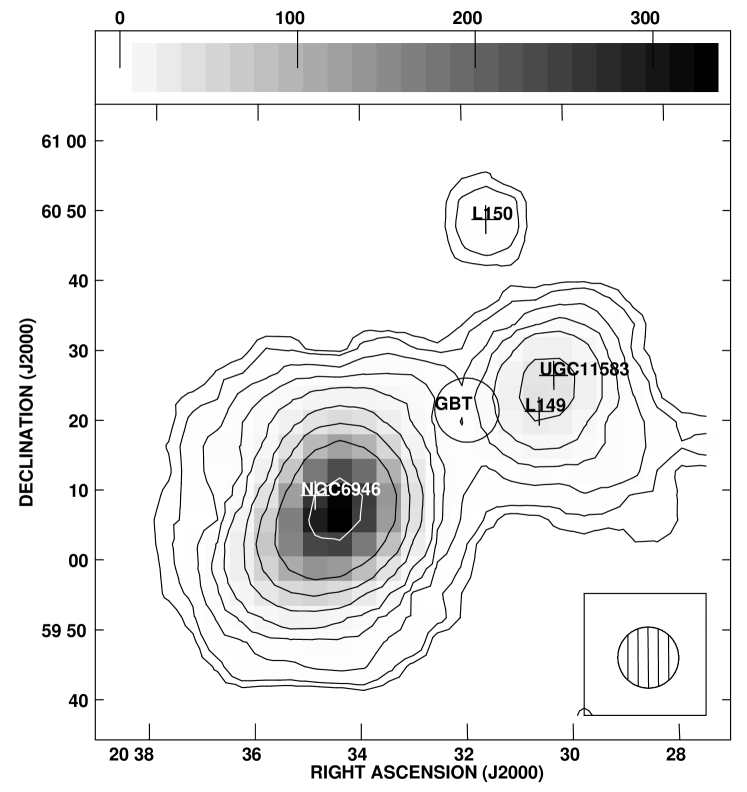
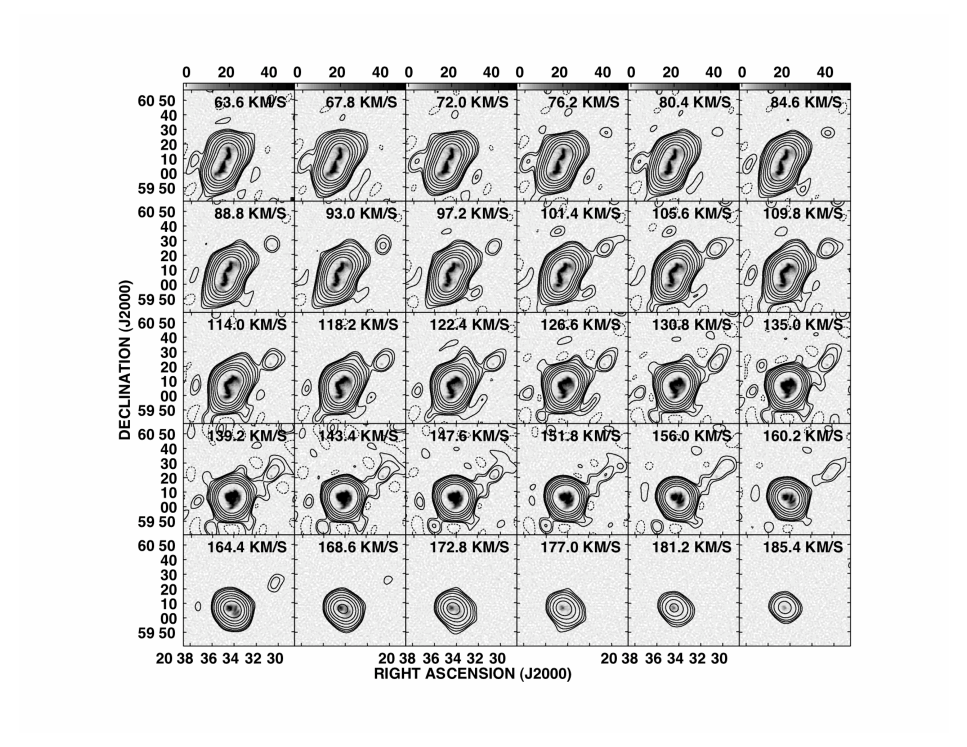
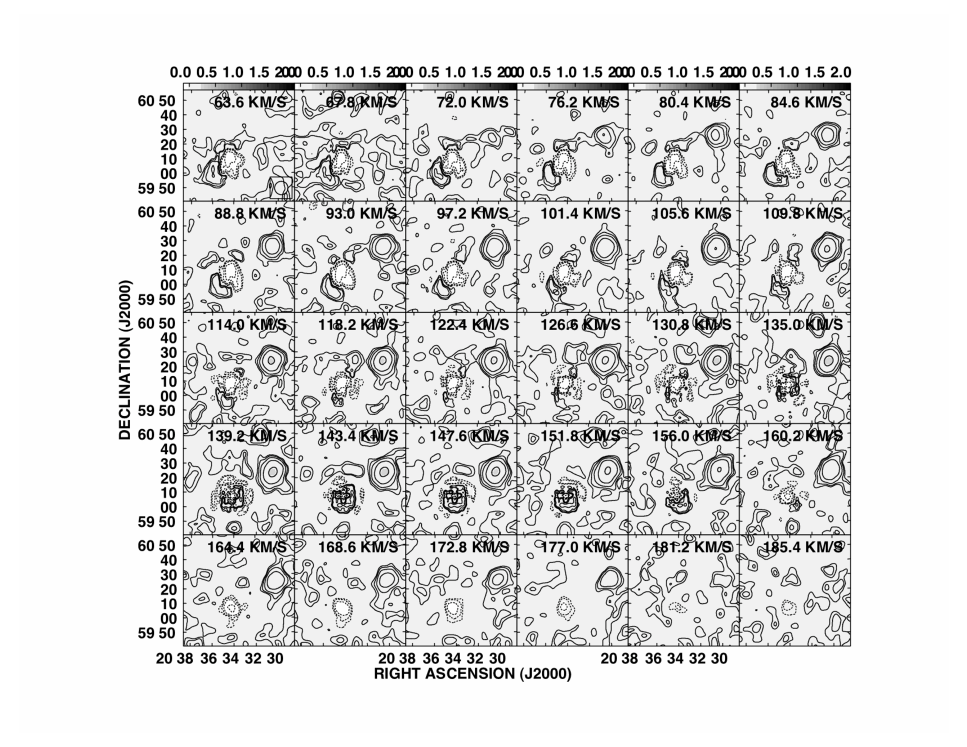
Channel maps of NGC 6946 and its surroundings are shown in Figure 3 down to 63.6 km s-1 after which emission from NGC 6946 begins to be confused with the Milky Way. These maps show emission from NGC 6946 and three of its companions: L150 and L149 (first discovered by Huchtmeier et al., 1997) and UGC 11583; the latter two of which are confused within the GBT beam. The channel maps also reveal an H I filament, present at the 2-3 level in each of 12 channels, connecting NGC 6946 with UGC 11583 and L149. This feature is more clearly seen in the total H I intensity map in Figure 4, and is completely invisible in the WSRT data from Boomsma et al. (2008) down to 51019cm-2. From Figure 4, this filament has a peak 51018cm-2 as measured with the GBT at a resolution of 9.2 (16 kpc). At this level, the filament is barely resolved with a width of 22 kpc (12.5) and a length of 12 kpc (6.8), uncorrected for the GBT beamsize. If our observations of this feature suffer from beam dilution, then the filament would be smaller, but would have a larger by the ratio of the GBT beam area to the true source area. As such, it cannot have a width smaller than 2 kpc (1) or its column density would have been high enough (1020cm-2) to be detected by (Boomsma et al., 2008). To confirm the reality of this filament, I conducted a pointed observations with the GBT at the position marked in Figure 4. The spectrum from the pointed observation of the H I filament connecting NGC 6946 with UGC 11583 and L149 is shown in Figure 5. The large wiggles between -200 km s-1 and 30 km s-1 are from the Milky Way H I that is not completely subtracted by position-switching. The H I filament is clearly visible as an emission line at 1232 km s-1, clearly distinct from Milky Way H I emission. A Gaussian fit to this line shows that it has a FWHM = 555 km s-1, a peak at 181.6 mK, and an integrated column density of 0.92 K km s-1 or 1.71018cm-2. It is clear from these data that the filament is not just structure in the baseline, but is real emission.
This putative filament is also not the product of stray radiation. The near sidelobes of the GBT are less than one percent of the main beam response and are symmetric (Boothroyd et al., 2011), and since there are no other observed features at this level around NGC 6946 or its companions it is unlikely that this feature is due to stray radiation. To confirm this, I convolved the WSRT data of Boomsma et al. (2008) with a Gaussian GBT beam. A filamentary feature connecting NGC 6946 and its companions appears, as seen in Figure 6, but at a level an order of magnitude lower than the observed of this H I filament. The H I filament becomes even more visible when subtracting the convolved WSRT H I data from the GBT H I data as shown in Figure 7. Unfortunately, due to the relatively small extent of this filamentary feature compared to the GBT beamsize, it is impossible to know for sure if this filament actually connects NGC 6946 with its companions or is merely a low extension of the H I plume seen by Boomsma et al. (2008).
Since NGC 6946 is confused with Milky Way H I emission below 50 km s-1, it is not feasible to compare the extent of the H I in the WSRT and GBT observations. Nor is it feasible to compare the integrated H I flux as observed by the two telescopes as was done for NGC 2997.
4 Discussion
These GBT observations of NGC 2997 and NGC 6946 reveal an extended low- distribution around the former galaxy and a filamentary structure attached to the latter. What is the nature of these extended H I structures around these two galaxies? In the case of NGC 2997, the low gas is morphologically and kinematically similar to the galaxy’s disk. The slight lopsidedness may due to a past interaction (but see Zaritsky et al., 2013), the unresolved, high column density peak of a filamentary cold flow, tidal debris, or just an extended H I disk. NGC 2997 has a dynamical mass, Mdyn= 2.11011 (Hess et al., 2009), that is low enough to expect that cold flows are its dominant mode of accretion (e.g. Kereš et al., 2005). NGC 2997 is located within a loose galaxy group, LGG 180, with an estimated M71012 (Pisano et al., 2011) so that it may reside in a sub-halo within a more massive group halo that suppresses cold accretion. In addition, the group galaxies have a mean separation of 500 kpc so tidal interactions with neighboring galaxies are relatively rare, but certainly possible (Pisano et al., 2011). The general agreement in the distribution of H I column density with the predictions of Popping et al. (2009) suggest that this is not a unique feature so an extended H I disk is a real possibility. The absence of any filamentary features may be due to the physical reasons listed above or, since NGC 2997 is more distant than NGC 6946 and the GBT beamwidth is 32 kpc at D12 Mpc, possibly the result of beam dilution; deeper observations at higher resolution are needed to test these possibilities. The slight excess of in the GBT data relative to the interferometer data reflects the fact that there is very little H I present around NGC 2997. This is not surprising as at these low column densities, most of the hydrogen present will be ionized. In fact, we know from absorption line studies that the covering fraction of H I at 13 is 100% within 200 kpc (Tumlinson et al., 2013). As such, the H I emission at low serves as a tracer of the bulk of the ionized gas, which may represent over 70% of the total hydrogen mass around galaxies (Popping et al., 2009).
The H I filament between NGC 6946 and its companions could be a tidal bridge or a cold flow that is part of the cosmic web. NGC 6946 has a dynamical mass even lower than NGC 2997, so cold mode accretion is certainly feasible. Furthermore, while NGC 6946 is in a loose group, this group is less massive than LGG 180 with M1.61012, although the galaxy density is about 10 times higher, making a tidal origin plausible (Rivers et al., 1999; Karachentsev et al., 2000). Dividing the width of the filament, 22 kpc, by its linewidth, 55 km s-1, yields a dispersion timescale of 400 Myr. This width may be too large, however, if the filament is beam-diluted then it could be as narrow as 2 kpc. In this case, the dispersion timescale would only be 40 Myr. While the latter timescale is very short, the former is comparable to the interaction timescale: the projected on-sky separation of the nearest companions divided by their line-of-sight velocity separation from NGC 6946, 700-800 Myr; particularly accounting for the unknown real, physical separations and velocity differences. The best way to confirm that this H I filament is due to a past encounter between NGC 6946 and its satellites would be to identify an associated stellar stream (e.g. Ibata et al., 2001, 2007; Ferguson et al., 2002). Unfortunately, due to the low Galactic latitude of NGC 6946, 11.6, and high extinction, AV=0.94 mag, identifying such streams will be challenging.
Finally, it is worth noting that both NGC 2997 and NGC 6946 have extensive populations of high velocity clouds, many of which are coincident with the stellar disk and, hence, are likely related to a galactic fountain, but some of which are consistent with ongoing gas accretion (Hess et al., 2009; Boomsma et al., 2008). Aside from the H I plume identified by Boomsma et al. (2008) in the outskirts of NGC 6946, these features have no relationship to the presence or absence of diffuse H I filaments seen with GBT. This suggests that the diffuse H I features and the bulk of the high velocity clouds seen by the interferometer observations have different origins.
5 Conclusions
In this paper, I reported the results from a pilot GBT H I survey of a four square degree region surrounding the nearby galaxies NGC 2997 and NGC 6946 down to a detection limit of 1018cm-2 over a linewidth of 20 km s-1. The goal of this survey was to identify H I filaments associated with predicted cold mode accretion and analogous to the H I features seen around M 31. Such features are large on the sky, and, therefore, invisible to radio interferometers due to the gaps in the uv-coverage of all interferometers. In contrast, single-dish telescopes like the GBT are sensitive to emission on all spatial scales and have excellent surface brightness sensitivity. The observations of NGC 2997 reveal a more extended H I distribution around the galaxy, but no filamentary features. This extended H I may be associated with an extended H I disk, a past tidal interaction or the highest column density parts of a cold, filamentary flow. Observations of NGC 6946 reveal a H I filament that appears to connect it with its neighbors. Morphologically this is similar to a predicted cold flow, but the similarity of the filament’s dispersion timescale with the interaction timescale suggest that it has a tidal origin. While detecting an associated stellar stream would strongly suggest that this H I filament is tidal in origin, the requisite observations do not yet exist.
These observations illustrate the biggest problem in trying to identify cold flows via H I emission, that is there are many plausible origins for features with similar properties. The best way to identify cold flows is statistically via a large survey. Cold flows should preferentially exist around low mass galaxies in low density environments. Tidal debris, on the other hand, should exist preferentially around galaxies in high density environments. Galactic outflows should preferentially exist around galaxies with low masses and large star formation rates. The ideal H I survey would span a wide range of galaxy mass, environment, and star formation rates to discriminate between these different origins. Such a survey is best done with single-dish radio telescopes that are large (so that they have good angular resolution) with low sidelobes (so that there is no confusion with H I emission from the galaxy itself) and are extremely sensitive (so that low column density features can be easily detected). The GBT remains the only telescope in the world that combines all of these features. Pisano et al. (2014, in preparation) will report on the results from just such a GBT survey of the THINGS galaxies (Walter et al., 2008).
References
- Begum & Chengalur (2004) Begum, A., & Chengalur, J. N. 2004, A&A, 424, 509
- Bekki (2008) Bekki, K. 2008, MNRAS, 390, L24
- Birnboim & Dekel (2003) Birnboim, Y., & Dekel, A. 2003, MNRAS, 345, 349
- Boomsma et al. (2008) Boomsma, R., Oosterloo, T. A., Fraternali, F., van der Hulst, J. M., & Sancisi, R. 2008, A&A, 490, 555
- Boothroyd et al. (2011) Boothroyd, A. I., Blagrave, K., Lockman, F. J., et al. 2011, A&A, 536, A81
- Braun & Thilker (2004) Braun, R., & Thilker, D. A. 2004, A&A, 417, 421
- Carignan et al. (1990) Carignan, C., Charbonneau, P., Boulanger, F., & Viallefond, F. 1990, A&A, 234, 43
- Chynoweth et al. (2008) Chynoweth, K. M., Langston, G. I., Yun, M. S., et al. 2008, AJ, 135, 1983
- Corbelli et al. (2010) Corbelli, E., Lorenzoni, S., Walterbos, R., Braun, R., & Thilker, D. 2010, A&A, 511, A89
- Ferguson et al. (2002) Ferguson, A. M. N., Irwin, M. J., Ibata, R. A., Lewis, G. F., & Tanvir, N. R. 2002, AJ, 124, 1452
- Hess et al. (2009) Hess, K. M., Pisano, D. J., Wilcots, E. M., & Chengalur, J. N. 2009, “Anomalous H I in NGC 2997”, ApJ, 699, 76
- Huchtmeier et al. (1997) Huchtmeier, W. K., Karachentsev, I. D., & Karachentseva, V. E. 1997, A&A, 322, 375
- Ibata et al. (2001) Ibata, R., Irwin, M., Lewis, G., Ferguson, A. M. N., & Tanvir, N. 2001, Nature, 412, 49
- Ibata et al. (2007) Ibata, R., Martin, N. F., Irwin, M., Chapman, S., Ferguson, A. M. N., Lewis, G. F., & McConnachie, A. W. 2007, ApJ, 671, 1591
- Karachentsev et al. (2000) Karachentsev, I. D., Sharina, M. E., & Huchtmeier, W. K. 2000, A&A, 362, 544
- Karachentsev et al. (2005) Karachentsev, I. D., Kajsin, S. S., Tsvetanov, Z., & Ford, H. 2005, A&A, 434, 935
- Karachentseva & Karachentsev (1998) Karachentseva, V. E., & Karachentsev, I. D. 1998, A&AS, 127, 409
- Kauffmann et al. (2010) Kauffmann, G., Li, C., & Heckman, T. M. 2010, MNRAS, 409, 491
- Kereš et al. (2005) Kereš, D., Katz, N., Weinberg, D. H., & Davé, R. 2005, MNRAS, 363, 2
- Kereš et al. (2009) Kereš, D., Katz, N., Fardal, M., Davé, R., & Weinberg, D. H. 2009, MNRAS, 395, 160
- Maloney (1993) Maloney, P. 1993, ApJ, 414, 41
- Mangum et al. (2007) Mangum, J. G., Emerson, D. T., & Greisen, E. W. 2007, A&A, 474, 679
- Ott et al. (1994) Ott, M., Witzel, A., Quirrenbach, A., et al. 1994, A&A, 284, 331
- Pisano & Wilcots (2000) Pisano, D. J., & Wilcots, E. M. 2000, MNRAS, 319, 821
- Pisano et al. (2007) Pisano, D. J., Barnes, D. G., Gibson, B. K., Staveley-Smith, L., Freeman, K. C., & Kilborn, V. A. 2007, ApJ, 662, 959
- Pisano et al. (2011) Pisano, D. J., Barnes, D. G., Staveley-Smith, L., Gibson, B. K., Freeman, K. C., & Kilborn, V. A. 2011, ApJS, 197, 28
- Popping et al. (2009) Popping, A., Davé, R., Braun, R., & Oppenheimer, B. D. 2009, A&A, 504, 15
- Putman et al. (2009) Putman, M. E., et al. 2009, ApJ, 703, 1486
- Rivers et al. (1999) Rivers, A. J., Henning, P. A., & Kraan-Korteweg, R. C. 1999, PASA, 16, 48
- Sancisi et al. (2008) Sancisi, R., Fraternali, F., Oosterloo, T., & van der Hulst, T. 2008, A&A Rev., 15, 189
- Sault et al. (1995) Sault, R. J., Teuben, P. J., & Wright, M. C. H. 1995, Astronomical Data Analysis Software and Systems IV, 77, 433
- Tumlinson et al. (2013) Tumlinson, J., Thom, C., Werk, J. K., et al. 2013, ApJ, 777, 59
- Walter et al. (2008) Walter, F., Brinks, E., de Blok, W. J. G., et al. 2008, AJ, 136, 2563
- Williams (2003) Williams, B. F. 2003, AJ, 126, 1312
- Wolfe et al. (2013) Wolfe, S. A., Pisano, D. J., Lockman, F. J., McGaugh, S. S., & Shaya, E. J. 2013, Nature, 497, 224
- Zaritsky et al. (2013) Zaritsky, D., Salo, H., Laurikainen, E., et al. 2013, ApJ, 772, 135
| GBT area | GMRT+ATCA area | area | Predicted Cum. AreaaaFrom Popping et al. (2009). The cumulative area is normalized to 1.00 at 1020cm-2. | |||
|---|---|---|---|---|---|---|
| cm-2 | Normalized | Normalized | ||||
| 1.21018 | 704 | 3.1 | 573 | 2.7 | 1.23 | 2.40 |
| 51018 | 588 | 2.6 | 547 | 2.5 | 1.07 | 1.80 |
| 11019 | 511 | 2.2 | 520 | 2.4 | 0.983 | 1.58 |
| 51019 | 324 | 1.4 | 343 | 1.6 | 0.945 | 1.19 |
| 11020 | 229 | 1.0 | 215 | 1.0 | 1.07 | 1.00 |