X-ray properties of K-selected galaxies at : Investigating trends with stellar mass, redshift and spectral type
Abstract
We examine how the total X-ray luminosity correlates with stellar mass, stellar population, and redshift for a -band limited sample of galaxies at from the NEWFIRM Medium Band Survey in the COSMOS field. The galaxy sample is divided into 32 different galaxy types, based on similarities between the spectral energy distributions. For each galaxy type, we further divide the sample into bins of redshift and stellar mass, and perform an X-ray stacking analysis using the Chandra COSMOS (C-COSMOS) data. We find that full band X-ray luminosity is primarily increasing with stellar mass, and at similar mass and spectral type is higher at larger redshifts. When comparing at the same stellar mass, we find that the X-ray luminosity is slightly higher for younger galaxies (i.e., weaker 4000Å breaks), but the scatter in this relation is large. We compare the observed X-ray luminosities to those expected from low and high mass X-ray binaries (XRBs). For blue galaxies, XRBs can almost fully account for the observed emission, while for older galaxies with larger 4000 Å breaks, active galactic nuclei (AGN) or hot gas dominate the measured X-ray flux. After correcting for XRBs, the X-ray luminosity is still slightly higher in younger galaxies, although this correlation is not significant. AGN appear to be a larger component of galaxy X-ray luminosity at earlier times, as the hardness ratio increases with redshift. Together with the slight increase in X-ray luminosity this may indicate more obscured AGNs or higher accretion rates at earlier times.
Subject headings:
galaxies: evolution; galaxies: stellar content; galaxies: active / galaxies; galaxies / X-rays: galaxies1. Introduction
Supermassive black hole growth and galaxy growth have long been thought to be correlated, as supported by the Magorrian and M relations (Magorrian et al., 1998; Ferrarese & Merritt, 2000; Gebhardt et al., 2000). Both active galactic nuclei (AGN) activity and star formation peak at (e.g., Madau et al. 1998; Merloni et al. 2004), and the processes appear to be correlated in both AGN host and normal galaxy samples (e.g., Canalizo & Stockton 2001; Kauffmann et al. 2003). However, the connection between star formation activity and black hole mass accretion in galaxies is not well-understood.
Several studies suggest that AGN activity is needed to explain the cutoff at the bright end of the galaxy luminosity function and the halting of star formation in the most massive galaxies (Croton et al. 2006 and references therein). This theory is supported by the observation that AGN activity lags star formation by years (Davies et al., 2007; Schawinski et al., 2009; Wild et al., 2010), and that many AGNs lie in the ‘green valley’ (e.g., Schawinski et al. 2010; Xue et al. 2010)– the sparsely populated region between the red sequence and the blue cloud (Faber et al., 2007).
However, Rosario et al. (2013b) find that out to AGNs are preferentially hosted by star-forming, rather than quiescent or quenching galaxies. Additionally, dust attenuation may redden the color of many AGN host galaxies (e.g., Aird et al. 2012, Cardamone et al. 2010,Brammer et al. 2011), implying that star formation quenching by AGNs may not control the transition between blue and red galaxies. Instead, the connection between AGN and star formation activity may simply reflect the fact that both processes require a large gas supply, with possible delays between star formation and AGN activity caused by inefficient black hole fueling. For example, simulations by Hopkins (2011a, b) suggest that star formation peaks as a function of gas density, while torques regulating further inflow are relatively inefficient and limit black hole growth, leaving a reservoir of gas long after the gas supply for star formation is exhausted.
While it is difficult to disentangle the contributions of star formation and AGN activity of high redshift galaxies from optical observations alone, X-ray imaging acts as a better tracer of AGN activity, with unobscured AGNs emitting heavily in both hard and soft bands, and obscured AGN dominated by hard X-ray emission (e.g. Churazov et al. 2002). Galactic X-ray emission also traces stellar activity, through low mass X-ray binaries (LMXBs), whose primarily soft X-ray emission correlates with stellar mass, as well as high mass X-ray binaries (HMXBs) and supernova, whose harder emission is reflective of star formation. Soft X-ray emission from hot gas is also apparent in the halos of massive ellipticals (e.g., Grimm et al. 2003; Gilfanov 2004; Gilfanov et al. 2004; David et al. 2006).
The X-ray galaxy connection has been systematically studied at low redshift, providing a rough census of X-ray luminosity with stellar mass, galaxy type, and redshift (e.g., Symeonidis et al., 2011; Lehmer et al., 2007, 2008). For example, Lehmer et al. (2007) find that the AGN fraction for massive early type galaxies increases with redshift, while the X-ray emission in less massive galaxies evolves very little out to . Late-type galaxies evolve significantly in X-ray luminosity with redshift, and furthermore their X-ray emission shows a strong dependence on stellar mass (Lehmer et al., 2008). At higher redshifts, X-ray galaxy studies have primarily focused on direct X-ray detections (e.g., Silverman et al. (2009); Kocevski et al. (2012); Mullaney et al. (2012); Santini et al. (2012)) or on specific galaxy populations, such as Lyman break galaxies (LBGs, Steidel et al. 1996), submillimeter bright galaxies (SMGs), and distant red galaxies (DRGs, Franx et al. 2003). For example, Laird et al. (2010) find that the X-ray emission is dominated by an AGN in only 15% of the SMGs out to in the Chandra Deep Field North (see also Georgantopoulos et al., 2011), while for LBGs and DRGs the X-ray emission seems almost completely accounted for by star formation (e.g., Reddy & Steidel 2004; Rubin et al. 2004). However, these different selection techniques target galaxies at different redshifts and stellar masses, and even combined are not representative of the full distant galaxy population. Hence, a complete census of the X-ray properties of distant galaxies is still missing.
Using the high-quality near-infrared photometry from the NEWFIRM Medium Band Survey (NMBS,van Dokkum et al. 2009; Whitaker et al. 2011) in combination with Chandra data, it is possible to systemically study the X-ray properties of an observed K-band complete sample of distant galaxies. In this study, we utilize the galaxy from the NMBS and 32 SED templates of Kriek et al. (2011), along with the overlapping C-COSMOS field, to better characterize the star formation-AGN connection out to . With accurate and measurements from Kriek et al. (2011), indicating instantaneous star formation rates and stellar population ages, along with separate hard and soft band X-ray luminosities, we attempt to correlate AGN activity with star formation properties, stellar mass, and redshift.
| SED type | aafootnotemark: | log() | logbbfootnotemark: | logccfootnotemark: | |||
|---|---|---|---|---|---|---|---|
| (Å) | [yr-1] | (mag) | [erg/s] | [erg/s] | |||
| 1 | 121 | 1.95 | 14.4 | -11.79 | 0.4 | ||
| 2 | 291 | 1.94 | 14.4 | -11.79 | 0.2 | ||
| 3 | 436 | 1.81 | 6.2 | -24.93 | 0.5 | ||
| 4 | 211 | 1.77 | 2.1 | -18.35 | 0.3 | ||
| 5 | 95 | 1.70 | 24.6 | -10.59 | 0.7 | ||
| 6 | 22 | 1.67 | 19.1 | -11.67 | 0.1 | ||
| 7 | 72 | 1.66 | 20.5 | -11.29 | 0.2 | ||
| 8 | 64 | 1.66 | 38.7 | -10.49 | 1.2 | ||
| 9 | 94 | 1.65 | 42.7 | -10.59 | 1.1 | ||
| 10 | 60 | 1.62 | 33.1 | -10.58 | 0.5 | ||
| 11 | 95 | 1.58 | 39.1 | -10.4 | 0.7 | ||
| 12 | 46 | 1.58 | 17.7 | -10.58 | 1.4 | ||
| 13 | 114 | 1.45 | 63.3 | -10.71 | 2.4 | ||
| 14 | 71 | 1.45 | 69.4 | -9.66 | 2.6 | ||
| 15 | 64 | 1.40 | 61.7 | -10.34 | 2.8 | ||
| 16 | 155 | 1.40 | 67.4 | -9.92 | 2.1 | ||
| 17 | 103 | 1.40 | 66.2 | -9.66 | 1.9 | ||
| 18 | 95 | 1.38 | 86.0 | -9.34 | 2.3 | ||
| 19 | 33 | 1.37 | 86.1 | -9.66 | 2.6 | ||
| 20 | 34 | 1.37 | 108.0 | -8.81 | 2.6 | ||
| 21 | 139 | 1.35 | 79.5 | -9.15 | 1.9 | ||
| 22 | 82 | 1.34 | 66.9 | -10.24 | 1.7 | ||
| 23 | 51 | 1.33 | 92.4 | -8.69 | 2.2 | ||
| 24 | 26 | 1.30 | 130.7 | -9.25 | 2.1 | ||
| 25 | 159 | 1.30 | 94.1 | -10.71 | 1.4 | ||
| 26 | 80 | 1.30 | 107.1 | -8.81 | 1.9 | ||
| 27 | 108 | 1.27 | 105.8 | -8.78 | 1.6 | ||
| 28 | 144 | 1.25 | 106.2 | -9.92 | 1.2 | ||
| 29 | 64 | 1.22 | 102.8 | -8.61 | 1.4 | ||
| 30 | 142 | 1.21 | 104.0 | -8.65 | 1.2 | ||
| 31 | 101 | 1.18 | 109.7 | -8.65 | 1.0 | ||
| 32 | 50 | 1.13 | 138.5 | -8.51 | 0.9 |
Note. — The 4000Å break () strength, H equivalent width (WH), specific SFRs, dust attenuation () are adopted from Kriek et al. The specific SFR (SSFR) and s are derived by comparing the composited SEDs to the Bruzual & Charlot (2003) stellar population synthesis models using a Calzetti et al. (2000) law, a Salpeter (1955) IMF, and a delayed exponential star formation history. The 4000Å breaks and H equivalent widths are directly measured from the composite SEDs
2. Data and Methods
In this work, we make use of the photometric catalogs from the NMBS in the COSMOS field (van Dokkum et al., 2009; Whitaker et al., 2011). The NMBS uses five custom NIR filters (three J-band and two H-band), covers 0.2 deg2 of the COSMOS field (Scoville et al., 2007), and is complemented by FUV-MIR data sets (e.g., Sanders et al., 2007; Capak et al., 2007; Barmby et al., 2008; Erben et al., 2009; Hildebrandt et al., 2009). The photometric redshifts and stellar population properties are derived using EAZY (Brammer et al., 2008) and FAST (Kriek et al., 2009).
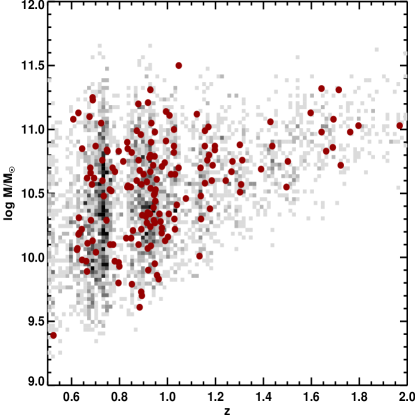
We utilize the NMBS sample of galaxies at of Kriek et al. 2011 (with mass-redshift distribution displayed in Fig. 1), and employ the spectral classification therein. In summary, the galaxies were divided into 32 subsamples based on similarities in their spectral energy distributions (SEDs). First, the rest-frame photometric SEDs of all individual galaxies were compared, and based on the similarities in their full SED shape, it was decided whether or not two galaxies were analogs. Next, the galaxy with most analogs was identified, which together formed the first subsample. After removal of all galaxies of the first subsample, the next galaxy with most analogs was identified. This procedure was repeated until nearly all galaxies were divided. Eventually, some galaxies were re-assigned, if they would have been a better match with a later iteration. Thus, our classification method is model independent.
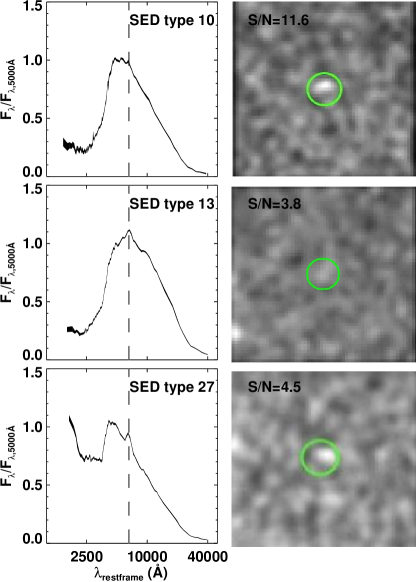
A composite SED is constructed for each subsample by combining the rest-frame photometry of all galaxies in the bin. Each subsample contains 22-436 galaxies for which there is X-ray coverage as well. The final composite SED sample spans almost the entire galaxy population at these redshifts. Each composite SED shows detailed spectral features such as the H+[NII]+[SII] and H+[OIII] emission lines, Balmer or 4000Å breaks, MgII absorption at 2800Å, the continuum break at 2640Å, and the dust absorption feature at 2175Å (see Fig. 4 of Kriek et al. 2011, and three examples in Fig. 2). As the sample is K-band (and not stellar mass) selected, it will be slightly biased toward star-forming galaxies with lower ratios. Furthermore, as our photometric redshift code only uses stellar population templates, we have a bias against AGN-dominated SEDs.
Although measures stellar population age (as stellar opacity increases with age and strengthens absorption lines of ionized metals such as Ca H and K), rather than ongoing star formation activity, Kriek et al. (2011) show a clear correlation between , , and the specific star formation rate (SSFR). Galaxies with shallow breaks have high and are fitted by stellar population models with high SSFRs, while galaxies with strong breaks have low values of and low SSFRs. Basic properties of each SED type are shown in Table 1.
In this paper, we study the X-ray properties of the different SED types. We make use of the C-COSMOS survey (Elvis et al., 2009; Puccetti et al., 2009), which has an effective exposure of 80-160ks, and a sampling of 1”/pixel. Merged images of 0.5-2 keV (soft), 2-7 keV (hard), and 0.5-7 keV (full) are publicly available, along with the point source catalog of Elvis et al. (2009). Each field of the C-COSMOS survey is observed with up to six overlapping pointings, ensuring relatively uniform sensitivity, despite differing point-spread functions (Puccetti et al. 2009).
We obtain 60”x60” C-COSMOS cutouts of each galaxy field from Kriek et al. (2011). As a vast majority of the galaxies are not detected in the X-ray, we opt to stack by SED type, and further subdivide by redshift and/or stellar mass. We note that direct detections are included in the stacks and thus the further analysis. We select source counts within a 5” radius of the NIR detection, and make background estimates by taking 30 random 5” radius apertures in each frame, excluding 5” apertures around the optical source or known X-ray sources (Elvis et al., 2009).
We then de-redshift the source according to its photometric redshift (or spectroscopic redshift when available), using a photon index of , to determine a source luminosity, via the equation
where is the observed frame emission in the bandpass, and is the luminosity distance. We explore alternate photon indices, as the steepness of galaxy X-ray spectra varies according to the strength of the various types of X-ray sources, and find that the observed trends in X-ray luminosity do not change significantly with differing (see 3.2 for further discussion). We then determine the average luminosity of all sources per bin.
To determine the error in each stack, we bootstrap resample the sources, subtracting a random background aperture (of the selected 30) from each frame. The error is the standard deviation of the average stack luminosities of the bootstrap simulations. Stacked detections of less than (as determined by the bootstrapped background estimates) were deemed insignificant. Sample stacks for three SED types of full-band X-ray data are shown in Fig. 2
3. Analysis
In this section, we explore X-ray properties of the galaxy population at . To determine the dependence of X-ray luminosity on galaxy type, we seek to disentangle the effects of redshift and stellar mass. We attempt to remove the effects of mass and redshift by splitting galaxies into bins, and eventually normalizing by stellar mass (§3.1). In §3.2, we look at X-ray hardness as well as expected XRB contribution to galaxy luminosity in an attempt to distinguish the sources of X-ray flux.
3.1. X-ray correlations
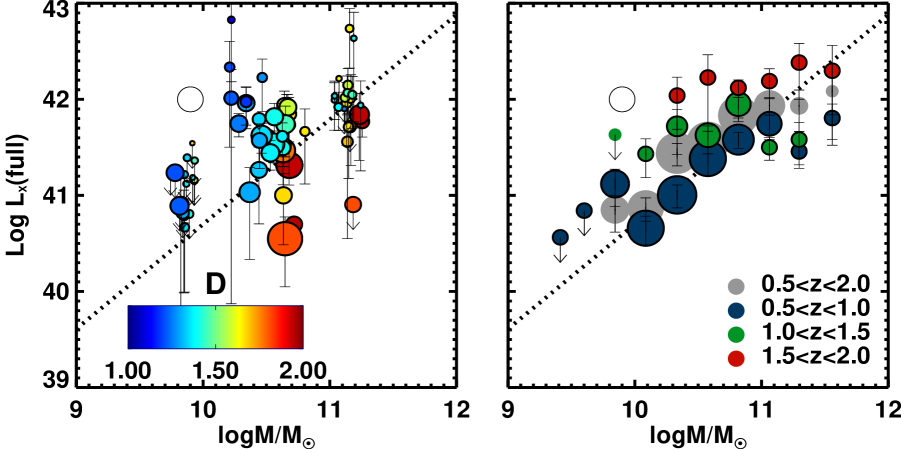
As each SED type probes a different mass distribution, we first explore the X-ray luminosity as a function of stellar mass by splitting each sub sample into three mass bins (, and ) in the left panel of Fig. 3. The X-ray luminosity is correlated with stellar mass, such that more massive galaxies emit at higher rates regardless of stellar age. We determine a least squares fit to the data via resampling, assuming a normal distribution with standard deviation as calculated by the bootstrap errors for each data point. We calculate the line of best fit for each resampling, weighing individual points by the number of galaxies in each stack, and determine the average and standard deviations of the fits to be .
To further examine this relation we stack all galaxies in 10 bins of stellar mass, and show these as the large gray filled circles in the right panel of right panel of Fig. 3, with errors calculated by resampling the galaxies in each bin. We further divide these 10 mass bins into 3 redshift bins (colored), and find that higher redshift galaxies have higher X-ray luminosities at the same mass, when compared to lower redshift galaxies. At there is a clear correlation between the X-ray luminosity and stellar mass, which is broadly consistent with a one-to-one relation. The X-ray luminosity is increasing with redshift, and the trend with mass seems to flatten. As we probe different mass ranges at different redshifts, the increase of X-ray luminosity with redshift further steepens the correlation between X-ray luminosity and stellar mass. Thus, to further examine the trend with redshift and other galaxy properties, we normalize the X-ray luminosity by the stellar mass from here on.
As is roughly constant, we may estimate the typical accretion rate of the galaxy sample. Assuming a black hole in a galaxy of stellar mass , and a bolometric correction of (Ho, 2009), we find the average Eddington ratio of our sample is . We will argue below that accretion is the dominant source of emission.
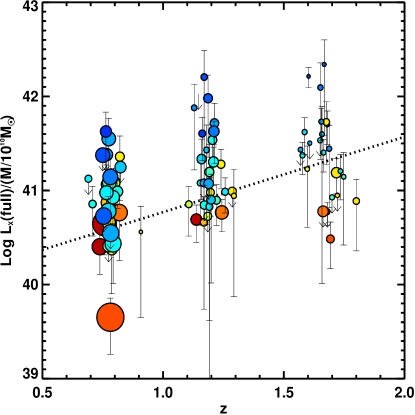
We further split the sample by redshift ( and ; for 9 total bins) and restack using the method described in Section 2, normalizing by stellar mass (such that we measure total(total(stellar mass). Fig. 4 shows (full) / vs. for all bins combined. We find , suggesting that X-ray luminosity is higher at earlier times for galaxies of similar mass. This trend does not change upon making a minimum mass cut at log, the minimum mass detectable at .
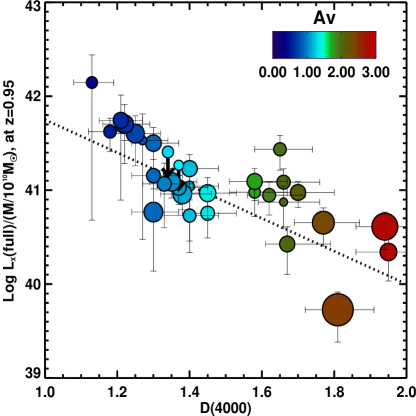
To remove the effects of any redshift correlation, we normalize by the above luminosity-redshift relation (as if all galaxies were at the average redshift, z=0.95) after recombining all mass/redshift bins, and divide total stack luminosity by total stellar mass contained in each stack, to explore trends in independent of galaxy mass and redshift. Fig. 5 shows mass and redshift-normalized X-ray luminosity as a function of stellar age (as measured by the strength of the 4000 Å break), with the colors indicating . We find the following correlation between the normalized X-ray luminosity as a function of stellar population age: , suggesting that there is a moderate correlation between and galaxy X-ray luminosity. This correlation may have caused the flattening or increase of the X-ray luminosity for the lowest mass bins for each redshift interval in Figure 3b, as these bins are dominated by star-forming galaxies with slightly higher X-ray luminosities. It may also explain the flattening at the highest masses, as quiescent galaxies with slightly lower X-ray luminosities are dominating these bins.
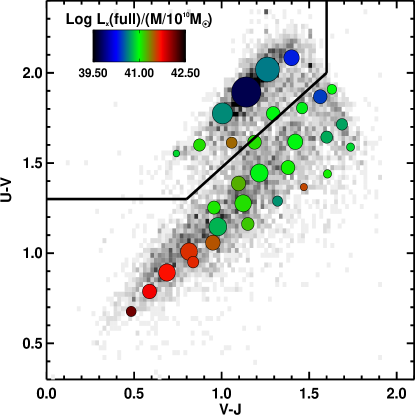
We also explore the X-ray properties of the 32 different galaxy types of Fig. 5 in U-V and V-J color space in Fig. 6, in comparison to the color of all detected NMBS galaxies with (grey scale). This diagram is a powerful diagnostic in distinguishing the blue and red galaxy populations, and separates the red passively-evolving galaxies from the dusty red star-formers; quiescent galaxies are primarily located in the upper left quadrant of this diagram (Labbé et al., 2005; Wuyts et al., 2007; Williams et al., 2009). The X-ray luminosity decreases along the star forming sequence, and the quiescent galaxies have an average X-ray luminosity per unit mass almost a dex lower than that of the bluest galaxies in the sample.
To first order, we observe a linear trend in galaxy X-ray luminosity as a function of stellar mass (Fig. 3). After normalizing by stellar mass, we observe underlying redshift and stellar population age relations, finding that galaxy X-ray luminosity increases at higher redshifts (Fig. 4), and also is lower for older stellar populations (Fig. 5).
3.2. Origin of the X-ray flux
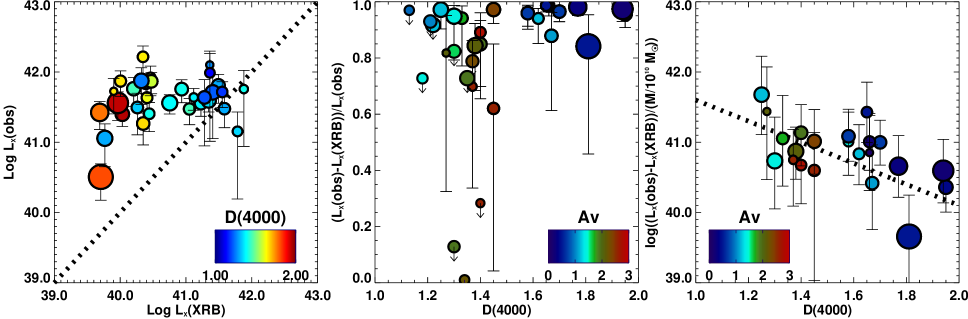
In this section, we attempt to distinguish between the stellar, AGN, and gaseous components of the observed X-ray flux. We start by comparing the measured X-ray flux with the expected X-ray flux from XRBs. To determine the expected X-ray flux from XRBs, we utilize the star formation rates and stellar masses derived in Kriek et al. (2011), and X-ray luminosity relations for high-mass X-ray binaries (HMXBs) and low-mass X-ray binaries (LMXBs). Luminosity, stellar mass, and star formation rate relations are taken from Grimm et al. (2003) and Gilfanov (2004), such that and (see Gilfanov et al. (2004), and Persic & Rephaeli (2007) for further discussion of these relations). We plot the observed X-ray luminosity vs. expected X-ray luminosity from XRBs in the left panel of Figure 7. The blue galaxies are well-described by the X-ray luminosity of XRBs alone. However, for galaxies with strong 4000 Å breaks, the contribution from XRBs cannot account for the full X-ray flux. This implies that a large fraction of their X-ray luminosities comes from AGN and/or hot gas contributions. In the middle panel of Figure 7 we show the relative contribution of X-ray flux from non-stellar sources. This plot illustrates that the non-stellar X-ray sources contribute a significant fraction of the X-ray flux, in particular for galaxies with larger 4000 Å breaks (luminosities of several galaxies with smaller 4000 Å breaks are upper limits). In the right panel of Figure 7 we show the measured X-ray flux corrected for XRBs, normalized by stellar mass, as a function of . Interestingly, we find that . This suggests that the X-ray luminosity difference between red and blue galaxies is almost entirely driven by non-stellar sources. We note that galaxies with higher values of may be dominated by emission from star formation (middle and right panels); however, these measurements are not well-constrained.
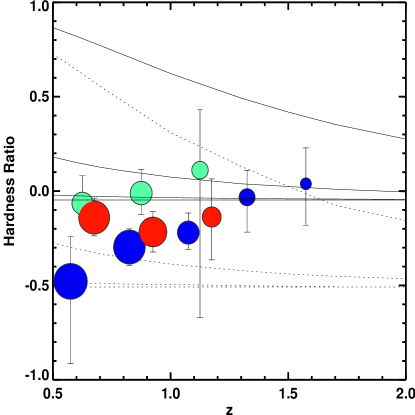
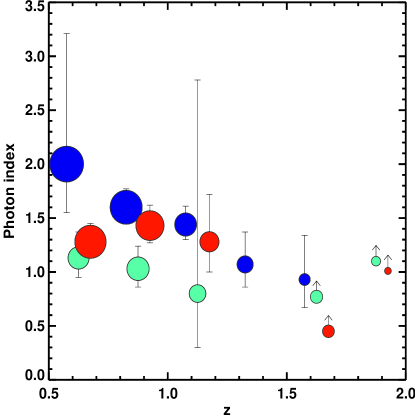
Next we explore the hardness ratio, given by , where H is the number of hard band (2-8 keV) counts and S is the number of soft band (0.5-2 keV) counts (Fig. 8), as a function of and redshift to distinguish probable X-ray sources. We plot lines to determine the hardness ratio that would be observed in a galaxy with the listed obscuring column densities, assuming a photon index of 1.1 (solid) and 2.1 (dashed). We similarly plot the photon index as a function of redshift by combining the galaxies into and bins, and measuring the hard and soft counts, assuming a constant hardness ratio (Fig. 9). We find that the obscuring column density increases as a function of redshift, and may be higher for galaxies with intermediate values of (green). Interestingly, these are galaxies with high values of . This suggests a greater AGN contribution to the average galaxy X-ray luminosity at higher redshifts, consistent with the observed increase in total X-ray luminosity at the same redshifts.
4. Discussion
After correcting for an increase in X-ray luminosity with both stellar mass and redshift, we find a difference of 1 dex between the X-ray luminosities of the highest and lowest SFR galaxies.To separate the effects of black hole accretion and stellar luminosity components, we subtract the expected X-ray binary contribution and normalize by stellar mass, finding that a significant fraction of the X-ray luminosity is from non-stellar sources. This excess is highest for passive red galaxies. We note that both hot gas and black hole accretion may contribute to differences in .
While hot gas likely remains an important part of the X-ray luminosity function out to at least (Tremmel et al., 2013), we note that its contribution to the rest-frame soft band decreases significantly at higher redshifts, as galactic hot gas primarily emits at keV. Additionally, X-ray emission from hot gas is unlikely directly correlated with star formation rate for galaxies of similar masses. The X-ray luminosities of local galaxies can vary by orders of magnitude for galaxies of similar stellar or black hole masses (Fabbiano, 1989; Pellegrini & Ciotti, 1998; Sarazin et al., 2001; Pellegrini, 2010). The cosmological hot gas accretion rate onto halos is predicted to plateau at , however the used models are still highly uncertain (van de Voort 2011a, b)).
We thus attribute the trends in X-ray luminosity to differences in AGN accretion rates. Previous studies have found similar trends in galaxy mass and accretion rates, though we probe lower black hole accretion rates, averaging (assuming the relation, Magorrian et al. (1998)). Both Bongiorno et al. (2012) and Aird et al. (2012) find an increase in AGN luminosity with stellar mass out to and , respectively, for objects several orders of magnitude brighter than those in our sample. Aird et al. (2012) finds that the distribution of Eddington ratios is independent of stellar mass, suggesting that the physical mechanism responsible for fueling AGN is similar at all scales and times. Our results support this picture, with no increase in X-ray luminosity per unit stellar mass from
Making the plausible assumption that the non-stellar X-ray emission is dominated by AGN, our study suggests that black holes have higher accretion rates in star forming galaxies than quiescent galaxies, though there is significant scatter in the relation. This result may seem in contrast to many studies that found a lack of SFR-AGN connection up to (Symeonidis et al., 2011; Cano-Díaz et al., 2012; Farrah et al., 2012; Rosario et al., 2012, 2013a). We note that these studies have not corrected for the mass evolution of their sample, and thus probe different galaxy populations at different redshifts. Mullaney et al. (2012) find that AGN host galaxies have SSFRs lower relative to a normal galaxy sample out to , but do not probe the lowest X-ray luminosity regimes, selecting only sources with . This paper explores a different regime than the high-SFR, high accretion rates of the bright AGNs that are likely associated with mergers (e.g. Santini et al. 2012). Low luminosity AGNs are most likely fueled by minor mergers and disk instabilities, and may accrete at low rates for periods which long outlast any intense periods of induced star formation (Schawinski et al. (2011) and references therein).
While this study probes a large range of galaxy SED types, masses, and redshifts, we note several limitations of this study. First, by stacking galaxies we are observing the average detection within the stack; unusually luminous galaxies could dominate the stacked detection. We compare to the C-COSMOS point source catalog (Puccetti et al., 2009), and find that in our stacked galaxy populations, with the exception of a few high-redshift bins in which one lone X-ray source is detected, non-detections typically provide of the stack luminosity. This suggests that luminosities of individual bright AGNs do not dominate the stacks. This is perhaps unsurprising, as this study automatically eliminates the more unusual SEDs of Type I AGNs by fitting to galaxy spectra when deriving photometric redshifts (a vast majority of low-luminosity AGNs appear obscured, while those at higher luminosity are primarily unobscured; see, e.g., Merloni et al. 2004; Hasinger 2008; Treister et al. 2010). Bias from the removal of Type I AGNs may be most prominent for the high mass galaxy sample, as these galaxies are more frequently AGN hosts and have a higher unobscured fraction (e.g. Georgakakis et al. 2011; Fanidakis et al. 2012; Hopkins et al. 2012). Galaxies with SEDs that do not resemble any galaxy SED template (17% of the sample) average a full-band luminosity of erg/s, significantly higher than most unnormalized SED types, suggesting that AGNs may contribute significantly to the luminosities and SED shapes of these galaxies.
5. Summary
We explore the X-ray properties of galaxies at by stacking the galaxies as a function of SED type (categorized by 32 SED templates in Kriek et al. 2011), while controlling for mass and redshift. We find that is roughly linearly correlated with galaxy mass, and also increases slightly with increasing redshift. After normalizing by galaxy mass and correcting for the redshift correlation, X-ray luminosity decreases with an increase in stellar population ages (as measured by ).
We utilize local XRB luminosity functions to determine the stellar contribution to the galaxy X-ray luminosities. We find that there is a significant luminosity excess for most galaxies, particularly those with high values of , suggesting large X-ray contributions from hot gas and/or black hole accretion.
Consistent with other studies, we find that low luminosity AGNs show at best a mild preference for galaxies with shallower Å breaks and higher SSFRs (e.g., Xue et al. 2010; Georgakakis et al. 2011; Rosario et al. 2011; Hainline et al. 2012; Kocevski et al. 2012). First, there is a large scatter in X-ray luminosity from non-stellar sources for similar galaxy types. Second, there is no strong correlation between the X-ray emission from non-stellar sources and spectral type. However, we observe that obscuration (as determined by hardness ratio) appears to increase with increasing redshift as the photon index decreases. This is consistent with the slight increase in X-ray luminosity per unit stellar mass with redshift, suggesting an increase in AGN accretion rates in these galaxies. We note that we do not probe the highest black hole accretion rates, as our selection methods bias against galaxies for which the continuum emission is not dominated by stellar light.
While it is difficult to differentiate sources of X-ray emission from C-COSMOS data alone, a similar analysis of COSMOS radio data (such as that undertaken by Carilli et al. (2008) of Lyman Break Galaxies in the field), mid-infrared data, and 6-79keV X-ray data from NuSTAR could provide more direct information about the obscured AGN activity in these galaxies, helping to differentiate them from heavily star-forming galaxies that are X-ray hard. In addition, NIR spectra of galaxies can aid in more accurate measurements of AGN demographics using emission line ratios [NII]/H and [OIII]/H. An analogous analysis using the deeper Chandra Deep Field South data could also be performed, helping to constrain the amount of variability within individual galaxy SED types.
We would like to acknowledge the NMBS and the Chandra COSMOS teams for their observations and creation of the catalogs. We would like to thank Ryan Hickox and Jane Rigby for useful discussions. T.J. acknowledges support of the National Science Foundation Graduate Research Fellowship.
References
- Aird et al. (2012) Aird, J., Coil, A. L., Moustakas, J., et al. 2012, ApJ, 746, 90
- Ballantyne (2008) Ballantyne, D. R. 2008, ApJ, 685, 787
- Barmby et al. (2008) Barmby, P., Huang, J.-S., Ashby, M. L. N., et al. 2008, ApJS, 177, 431
- Bongiorno et al. (2012) Bongiorno, A., Merloni, A., Brusa, M., et al. 2012, arXiv:1209.1640
- Bournaud et al. (2011) Bournaud, F., Dekel, A., Teyssier, R., et al. 2011, ApJ, 741, L33
- Brammer et al. (2008) Brammer, G. B., van Dokkum, P. G., & Coppi, P. 2008, ApJ, 686, 1503
- Brammer et al. (2009) Brammer, G. B., Whitaker, K. E., van Dokkum, P. G., et al. 2009, ApJ, 706, L173
- Brammer et al. (2011) Brammer, G. B., Whitaker, K. E., van Dokkum, P. G., et al. 2011, ApJ, 739, 24
- Bruzual A. (1983) Bruzual A., G. 1983, ApJ, 273, 105
- Bruzual & Charlot (2003) Bruzual, G., & Charlot, S. 2003, MNRAS, 344, 1000
- Calzetti et al. (2000) Calzetti, D., Armus, L., Bohlin, R. C., et al. 2000, ApJ, 533, 682
- Canalizo & Stockton (2001) Canalizo, G., & Stockton, A. 2001, ApJ, 555, 719
- Cano-Díaz et al. (2012) Cano-Díaz, M., Maiolino, R., Marconi, A., et al. 2012, A&A, 537, L8
- Capak et al. (2007) Capak, P., Aussel, H., Ajiki, M., et al. 2007, ApJS, 172, 99
- Cardamone et al. (2010) Cardamone, C. N., van Dokkum, P. G., Urry, C. M., et al. 2010, ApJS, 189, 270
- Carilli et al. (2008) Carilli, C. L., Lee, N., Capak, P., et al. 2008, ApJ, 689, 883
- Churazov et al. (2002) Churazov, E., Sunyaev, R., Forman, W., &Boumlhringer, H. 2002, MNRAS, 332, 729
- Croton et al. (2006) Croton, D. J., Springel, V., White, S. D. M., et al. 2006, MNRAS, 365, 11
- David et al. (2006) David, L. P., Jones, C., Forman, W., Vargas, I. M., & Nulsen, P. 2006, ApJ, 653, 207
- Davies et al. (2007) Davies, R. I., Müller Sánchez, F., Genzel, R., et al. 2007, ApJ, 671, 1388
- Diamond-Stanic & Rieke (2012) Diamond-Stanic, A. M., & Rieke, G. H. 2012, ApJ, 746, 168
- Elvis et al. (2009) Elvis, M., Civano, F., Vignali, C., et al. 2009, ApJS, 184, 158
- Erben et al. (2009) Erben, T., Hildebrandt, H., Lerchster, M., et al. 2009, A&A, 493, 1197
- Fabbiano (1989) Fabbiano, G. 1989, ARA&A, 27, 87
- Faber et al. (2007) Faber, S. M., Willmer, C. N. A., Wolf, C., et al. 2007, ApJ, 665, 265
- Fanidakis et al. (2012) Fanidakis, N., Baugh, C. M., Benson, A. J., et al. 2012, MNRAS, 419, 2797
- Farrah et al. (2012) Farrah, D., Urrutia, T., Lacy, M., et al. 2012, ApJ, 745, 178
- Ferrarese & Merritt (2000) Ferrarese, L., & Merritt, D. 2000, ApJ, 539, L9
- Gebhardt et al. (2000) Gebhardt, K., Bender, R., Bower, G., et al. 2000, ApJ, 539, L13
- Georgakakis et al. (2011) Georgakakis, A., Coil, A. L., Willmer, C. N. A., et al. 2011, MNRAS, 418, 2590
- Georgantopoulos et al. (2011) Georgantopoulos, I., Rovilos, E., & Comastri, A. 2011, A&A, 526, A46
- Gilfanov (2004) Gilfanov, M. 2004, MNRAS, 349, 146
- Gilfanov et al. (2004) Gilfanov, M., Grimm, H.-J., & Sunyaev, R. 2004, MNRAS, 347, L57
- Grimm et al. (2003) Grimm, H.-J., Gilfanov, M., & Sunyaev, R. 2003, MNRAS, 339, 793
- Hainline et al. (2012) Hainline, K. N., Shapley, A. E., Greene, J. E., et al. 2012, arXiv:1206.3308
- Hasinger (2008) Hasinger, G. 2008, A&A, 490, 905
- Hildebrandt et al. (2009) Hildebrandt, H., Pielorz, J., Erben, T., et al. 2009, A&A, 498, 725
- Ho (2009) Ho, L. C. 2009, ApJ, 699,
- Hogg (2001) Hogg, D. W. 2001, arXiv:astro-ph/0105280
- Hopkins (2011a) Hopkins, P. F. 2011, arXiv:1101.4230
- Hopkins et al. (2011b) Hopkins, P. F., Hayward, C. C., Narayanan, D., & Hernquist, L. 2011, MNRAS, 2115
- Hopkins et al. (2012) Hopkins, P. F., Hayward, C. C., Narayanan, D., & Hernquist, L. 2012, MNRAS, 420, 320
- Kauffmann et al. (2003) Kauffmann, G., Heckman, T. M., Tremonti, C., et al. 2003, MNRAS, 346, 1055
- Kocevski et al. (2012) Kocevski, D. D., Faber, S. M., Mozena, M., et al. 2012, ApJ, 744, 148
- Kriek et al. (2009) Kriek, M., van Dokkum, P. G., Labbé, I., et al. 2009, ApJ, 700, 221
- Kriek et al. (2010) Kriek, M., Labbé, I., Conroy, C., et al. 2010, ApJ, 722, L64
- Kriek et al. (2011) Kriek, M., van Dokkum, P. G., Whitaker, K. E., et al. 2011, ApJ, 743, 168
- Labbé et al. (2005) Labbé, I., Huang, J., Franx, M., et al. 2005, ApJ, 624, L81
- Laird et al. (2010) Laird, E. S., Nandra, K., Pope, A., & Scott, D. 2010, MNRAS, 401, 2763
- Lehmer et al. (2007) Lehmer, B. D., Brandt, W. N., Alexander, D. M., et al. 2007, ApJ, 657, 681
- Lehmer et al. (2008) Lehmer, B. D., Brandt, W. N., Alexander, D. M., et al. 2008, ApJ, 681, 1163
- Madau et al. (1998) Madau, P., Pozzetti, L., & Dickinson, M. 1998, ApJ, 498, 106
- Magorrian et al. (1998) Magorrian, J., Tremaine, S., Richstone, D., et al. 1998, AJ, 115, 2285
- Marchesini et al. (2010) Marchesini, D., Whitaker, K. E., Brammer, G., et al. 2010, ApJ, 725, 1277
- Merloni et al. (2004) Merloni, A., Rudnick, G., & Di Matteo, T. 2004, MNRAS, 354, L37
- Mullaney et al. (2012) Mullaney, J. R., Pannella, M., Daddi, E., et al. 2012, MNRAS, 419, 95
- Norman et al. (2004) Norman, C., Ptak, A., Hornschemeier, A., et al. 2004, ApJ, 607, 721
- Pellegrini & Ciotti (1998) Pellegrini, S., & Ciotti, L. 1998, A&A, 333, 433
- Pellegrini (2010) Pellegrini, S. 2010, ApJ, 717, 640
- Persic & Rephaeli (2007) Persic, M., & Rephaeli, Y. 2007, A&A, 463, 481
- Puccetti et al. (2009) Puccetti, S., Vignali, C., Cappelluti, N., et al. 2009, ApJS, 185, 586
- Rosario et al. (2011) Rosario, D. J., Mozena, M., Wuyts, S., et al. 2011, arXiv:1110.3816
- Rosario et al. (2012) Rosario, D. J., Santini, P., Lutz, D., et al. 2012, arXiv:1203.6069
- Rosario et al. (2013a) Rosario, D. J., Mozena, M., Wuyts, S., et al. 2013, ApJ, 763, 59
- Rosario et al. (2013b) Rosario, D. J., Santini, P., Lutz, D., et al. 2013, ApJ, 771, 63
- Salpeter (1955) Salpeter, E. E. 1955, ApJ, 121, 161
- Sarazin et al. (2001) Sarazin, C. L., Irwin, J. A., & Bregman, J. N. 2001, ApJ, 556, 533
- Sanders et al. (2007) Sanders, D. B., Salvato, M., Aussel, H., et al. 2007, ApJS, 172, 86
- Santini et al. (2012) Santini, P., Rosario, D., Shao, L., et al. 2012, arXiv:1201.4394
- Schawinski et al. (2009) Schawinski, K., Virani, S., Simmons, B., et al. 2009, ApJ, 692, L19
- Schawinski et al. (2010) Schawinski, K., Urry, C. M., Virani, S., et al. 2010, ApJ, 711, 284
- Schawinski et al. (2011) Schawinski, K., Treister, E., Urry, C. M., et al. 2011, ApJ, 727, L31
- Scoville et al. (2007) Scoville, N., Aussel, H., Brusa, M., et al. 2007, ApJS, 172, 1
- Shapley et al. (2001) Shapley, A., Fabbiano, G., & Eskridge, P. B. 2001, ApJS, 137, 139
- Silverman et al. (2009) Silverman, J. D., Lamareille, F., Maier, C., et al. 2009, ApJ, 696, 396
- Symeonidis et al. (2011) Symeonidis, M., Georgakakis, A., Seymour, N., et al. 2011, MNRAS, 417, 2239
- Tremmel et al. (2013) Tremmel, M., Fragos, T., Lehmer, B. D., et al. 2013, ApJ, 766, 19
- Treister et al. (2010) Treister, E., Natarajan, P., Sanders, D. B., et al. 2010, Science, 328, 600
- van de Voort et al. (2011) van de Voort, F., Schaye, J., Booth, C. M., & Dalla Vecchia, C. 2011, MNRAS, 415, 2782
- van de Voort et al. (2011) van de Voort, F., Schaye, J., Booth, C. M., Haas, M. R., & Dalla Vecchia, C. 2011, MNRAS, 414, 2458
- van Dokkum et al. (2009) van Dokkum, P. G., Labbé, I., Marchesini, D., et al. 2009, PASP, 121, 2
- van Dokkum et al. (2010) van Dokkum, P. G., Whitaker, K. E., Brammer, G., et al. 2010, ApJ, 709, 1018
- van Dokkum et al. (2011) van Dokkum, P. G., Brammer, G., Fumagalli, M., et al. 2011, ApJ, 743, L15
- Watson et al. (2009) Watson, C. R., Kochanek, C. S., Forman, W. R., et al. 2009, ApJ, 696, 2206
- Whitaker et al. (2011) Whitaker, K. E., Labbé, I., van Dokkum, P. G., et al. 2011, ApJ, 735, 86
- Wild et al. (2010) Wild, V., Heckman, T., & Charlot, S. 2010, MNRAS, 405, 933
- Xue et al. (2010) Xue, Y. Q., Brandt, W. N., Luo, B., et al. 2010, ApJ, 720, 368
- Wake et al. (2011) Wake, D. A., Whitaker, K. E., Labbé, I., et al. 2011, ApJ, 728, 46
- Whitaker et al. (2010) Whitaker, K. E., van Dokkum, P. G., Brammer, G., et al. 2010, ApJ, 719, 1715
- Williams et al. (2009) Williams, R. J., Quadri, R. F., Franx, M., van Dokkum, P., f& Labbé, I. 2009, ApJ, 691, 1879
- Wuyts et al. (2007) Wuyts, S., Labbé, I., Franx, M., et al. 2007, ApJ, 655, 51