Discovery of a transparent sightline at kpc from an interacting pair of galaxies
Abstract
We report the discovery of a transparent sightline at projected distances of kpc to an interacting pair of mature galaxies at . The sightline of the UV-bright quasar PG + at passes at kpc from the higher-mass galaxy () and kpc from the lower-mass one (). The two galaxies are separated by kpc in projected distance and in line-of-sight velocity. Deep optical images reveal tidal features indicative of close interactions. Despite the small projected distances, the quasar sightline shows little absorption associated with the galaxy pair with a total H I column density no greater than . This limiting H I column density is already two orders-of-magnitude less than what is expected from previous halo gas studies. In addition, we detect no heavy-element absorption features associated with the galaxy pair with - limits of and . The probability of seeing such little absorption in a sightline passing at a small projected distance from two non-interacting galaxies is %. The absence of strong absorbers near the close galaxy pair suggests that the cool gas reservoirs of the galaxies have been significantly depleted by the galaxy interaction. These observations therefore underscore the potential impact of galaxy interactions on the gaseous halos around galaxies.
keywords:
galaxies: haloes – galaxies: interactions – quasars: absorption lines1 Introduction
The origin of the division of galaxies into the star-forming galaxies in the blue cloud and the more passive ones of the red sequence in color-magnitude diagrams, along with the corresponding division in morphologies, remains one of the most fundamental questions in galaxy evolution (e.g. Hubble, 1936; de Vaucouleurs, 1961; Strateva et al., 2001; Bell et al., 2004; Faber et al., 2007). Galaxies grow by a combination of accreting material from the intergalactic medium (IGM) and mergers (e.g. Genel et al., 2008), but the build-up of the red sequence requires mechanisms that rapidly halt or “quench” star-formation for long time-scales. Possible quenching mechanisms include: shock-heating of accreted gas (e.g. Dekel & Birnboim, 2006a), gas stripping due to interactions with a cluster environment (e.g. Moore et al., 1996, 1998; Tonnesen & Bryan, 2009), and winds driven by starbursts or active galactic nuclei (e.g. Springel et al., 2005). One particularly intriguing picture is one in which galaxy mergers transform spirals into ellipticals (e.g. Larson et al., 1980; Barnes, 1989; Schweizer & Seitzer, 1992; Cox et al., 2006; Hopkins et al., 2009), drive the observed correlations between the passive fraction and galaxy density (e.g. Dressler, 1980; Poggianti et al., 2006), and quench star-formation by stripping gas through galaxy collisions (e.g. Spitzer & Baade, 1951; Toomre & Toomre, 1972; Balogh et al., 2000), or ram-pressure stripping (e.g. Gunn & Gott, 1972; Kenney et al., 2004). Yet despite decades of study, it is not clear whether galaxies are quenched by interaction related processes or intrinsic mechanisms such as a transition from cold-mode to hot-mode accretion.
Proposed quenching mechanisms operate by heating (e.g. Dekel & Birnboim, 2006b), ejecting (e.g. Kereš et al., 2009), or stripping (in cluster environments; e.g. Balogh et al., 2000) the gaseous halos of galaxies, and consequently, the circumgalactic medium (CGM) provides a sensitive laboratory for studying the physical mechanisms that govern galaxy evolution. The diffuse gas of the CGM is generally too low in density to be directly observed in emission with existing facilities, but it can be studied through the use of rest-frame ultraviolet (UV) absorption features in the spectra of background sources. Over the last two decades, a great deal of effort has gone into constraining the properties of the CGM as a function of galaxy mass, luminosity, morphology, and color through observations of absorption features in the spectra of quasars at small projected distances from galaxies (e.g. Bergeron & Boissé 1991; Morris et al. 1993; Lanzetta et al. 1995; Churchill et al. 1996; Chen et al. 1998, 2001a; Tripp et al. 1998; Chen et al. 2001b; Bowen et al. 2002; Simcoe et al. 2006; Stocke et al. 2006; Wakker & Savage 2009; Chen & Mulchaey 2009; Wakker & Savage 2009; Chen et al. 2010; Gauthier et al. 2010, Steidel et al. 2010, Lovegrove & Simcoe 2011; Prochaska et al. 2011; Tumlinson et al. 2011; Thom et al. 2012; Werk et al. 2013). These studies show that the bimodal distribution of galaxies in color-magnitude diagrams is reflected in the gas content of the CGM. Observations of both H I components and heavy-element species such as O VI and Mg II demonstrate that cool ( K) gas is common around passive galaxies but with reduced covering fraction relative to star-forming galaxies (Chen & Mulchaey, 2009; Chen et al., 2010; Gauthier et al., 2010; Tumlinson et al., 2011; Thom et al., 2012). The mechanisms responsible for quenching star-formation in the red sequence must remove or transform the highly ionized gaseous halos of quenched galaxies while maintaining the lower ionization-state gas but at reduced levels.
The CGM is likely to be affected by galaxy interactions such as ram-pressure stripping and tidal forces, and studies of the impact of galaxy environment on the CGM may help constrain the relationship between quenching and environmental factors. Nevertheless, while existing studies of the CGM explore a range of galaxy properties, the influence of group and cluster environments on the CGM remains largely unexplored. Group galaxies exhibit more extended Mg II halos than isolated galaxies (Chen et al., 2010; Bordoloi et al., 2011), and galaxy clusters exhibit an increased incidence of strong Mg II absorbers at Mpc relative to the field (Lopez et al., 2008). At the same time, members of the Virgo cluster show a reduced covering fraction in absorption (Yoon et al., 2012). Additional studies that compare the CGM of cluster, group, and field galaxies are warranted.
In this paper, we report the discovery of a transparent sightline harboring little K gas at a small projected distance to an interacting pair of mature galaxies at . The sightline of the UV-bright quasar PG + at passes at a projected distance of kpc from the galaxy pair (see the right panel of Figure 1), enabling a study of the gas at small projected distances from the interacting pair. The galaxies are separated by kpc in projected distance. We refer to the more luminous pair member as G1 and to the less luminous member as G2 throughout the paper. This discovery represents an extreme example demonstrating the potential impact of galaxy environment on the CGM.
This paper proceeds as follows. In Section 2 we present the imaging and spectroscopy of the galaxy pair as well as the UV and optical spectroscopy of PG +. In Section 3, we discuss the properties of the galaxy pair including: absolute magnitudes, colors, star-formation rates, gas-phase metallicities, and ages of the dominant stellar populations. In Section 4 we review the absorption features revealed in the quasar sightline and place limits on the possible presence of key ions. Finally, in Section 5, we briefly discuss the implications of our study. Throughout the paper, we adopt a cosmology with , , and . We perform K corrections with the IDL kcorrect library described in Blanton & Roweis (2007). All magnitudes reported here are in the AB system.
2 Data
PG + is a UV bright quasar at high redshift (), and consequently it represents a prime target for absorption studies of the IGM. A wealth of imaging and spectroscopic data in the PG + field are available including: (1) optical and near-infrared imaging of the field, (2) optical spectroscopy of the galaxy pair, and (3) optical and UV spectroscopy of the quasar. In this section, we describe each of these three datasets and the related data-reduction and processing steps. The imaging data are summarized in Table 1, and the spectroscopic data are summarized in Table 2.
| Exposure | FWHM | |||
|---|---|---|---|---|
| Instrument | Filter | Time (s) | (′′) | Date |
| VIMOS | 2004 May | |||
| VIMOS | 2004 May | |||
| VIMOS | 2004 May | |||
| VIMOS | 2004 May | |||
| UKIDSS | 2007 Mar | |||
| UKIDSS | 2007 Mar | |||
| UKIDSS | 2007 Mar | |||
| LDSS3 | 2009 Apr |
| Instrument / | Exposure | FWHM | ||
|---|---|---|---|---|
| Target | Disperser | Time (ks) | (Å) | Date |
| PG + | HIRESb | 2010 Mar | ||
| PG + | COS / G130M | 2010 Sep | ||
| PG + | COS / G160M | 2010 Sep | ||
| G | IMACS / l | 2009 May | ||
| G | IMACS / l | 2010 May | ||
| G | IMACS / l | 2010 May |
2.1 Galaxy imaging
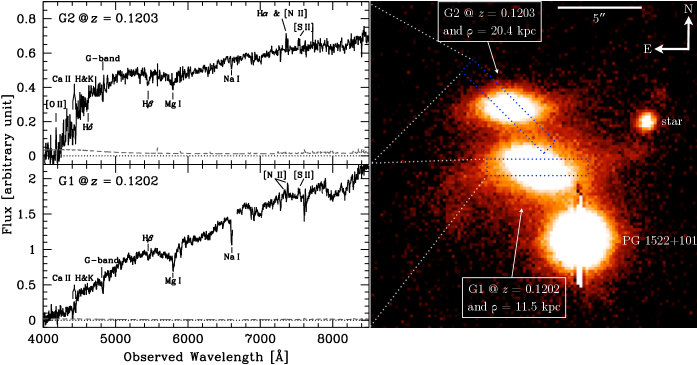
Optical -band images of the field around PG + were obtained using the Low Dispersion Spectrograph 3 (LDSS3) on the Magellan Clay Telescope in April of 2009 as pre-imaging for our blind redshift survey in the fields of UV bright quasars (see Chen & Mulchaey, 2009). The observations consist of a sequence of five exposures of 300 seconds duration each with a full-width at half maximum (FWHM) seeing of . The LDSS3 image of the field was reduced using standard IRAF routines and is displayed in the right panel of Figure 1. The depth of the LDSS3 image reveals the presence of faint tidal features around the galaxy pair.
In addition to our LDSS3 images, multi-band optical and near-infrared images of the field are available in the public European Southern Observatory (ESO) Archive and in the United Kingdom Infrared Deep Sky Survey (UKIDSS; Hewett et al., 2006; Casali et al., 2007; Lawrence et al., 2007; Hambly et al., 2008; Hodgkin et al., 2009). The ESO imaging of the field (PI: Christopher Mullis, PID: 71.A-3030) was acquired serendipitously with the Visible MultiObject Spectrograph (VIMOS; Le Fèvre et al., 2003) in May of 2004 as part of an unrelated program. The VIMOS imaging of the pair includes a single exposure in each of the , , , and filters for , , , and seconds respectively, under seeing conditions ranging from . We reduced the VIMOS imaging with a custom set of software that bias subtracted and flat-fielded the data and in the case of the -band image, removed the fringe pattern. We determined the zero-points of the VIMOS imaging data using field stars observed by the Sloan Digital Sky Survey (SDSS; York et al., 2000) and the SDSS-to-Johnson filter conversion formulae derived by Robert Lupton in 2005 and given in the SDSS Data Release 9 (Ahn et al., 2012) documentation. The UKIDSS imaging of the field includes second exposures in the , , and filters taken under seeing conditions of , , and respectively. We retrieved the UKIDSS images of the field from the public UKIDSS Data Release 8 website and combined them into a single frame covering the full VIMOS field of view in each filter using the SWARP tool (Bertin et al., 2002). We converted the UKIDSS photometric zeropoints to the AB system using the conversions in Hodgkin et al. (2009).
In order to extract galaxy photometry from the VIMOS and UKIDSS data, we registered the images to a common origin and pixel scale using standard IRAF routines. Next, we formed a detection image by summing the background subtracted VIMOS , , and -band images to enable detection of the low surface-brightness extent of the galaxies. We then defined the isophotal apertures ( and square arc seconds in area for G1 and G2) of the two galaxies in the summed detection image and calculated the total flux in these apertures in each bandpass using SExtractor (Bertin & Arnouts, 1996) in double-image mode. Finally, we corrected the galaxy photometry for foreground Milky Way extinction following Schlegel et al. (1998). The observed magnitudes of the two galaxies and other photometric properties are shown in Table 3.
| Apparent, Isophotal Magnitudes | Absolute Magnitudesc | ||||||||||||||
| ID | (′′) | kpc | deg | deg | |||||||||||
| G1 | |||||||||||||||
| G2 | |||||||||||||||
| Notes | |||||||||||||||
| a The azimuthal angle of the major axis of the galaxy from the line connecting the galaxy to the quasar sightline, measured North through East. | |||||||||||||||
| b Inclination angle of the galaxy disk measured from the major-to-minor axis ratio assuming an intrinsic, edge-on major-to-minor axis ratio of . | |||||||||||||||
| c Absolute, rest-frame magnitudes and stellar mass determined using the IDL kcorrect library v4_2 (Blanton & Roweis, 2007) which uses templates created with the | |||||||||||||||
| Bruzual & Charlot (2003) stellar population synthesis code and emission-line models from Kewley et al. (2001). | |||||||||||||||
| absorption lines, (Å) | emission lines, (Å) | ||||||||||
| ID | Ca II | G-band | Fe I | Mg I | Na I | [O I] | |||||
| G1 | |||||||||||
| G2 | |||||||||||
| Notes | |||||||||||
| a H emission-line equivalent width corrected for underlying stellar absorption based on stellar population synthesis models. | |||||||||||
| b Gas-phase Oxygen abundance estimate from the “N2” index, , using the relationship from Pettini & Pagel (2004). | |||||||||||
| For reference, the estimated Oxygen abundance of the Sun is (Allende Prieto et al., 2001). | |||||||||||
| c The star-formation rate measurements for G1 and G2 is derived from H. The H line luminosity is estimated from the absolute, rest-frame -band | |||||||||||
| magnitude and the H equivalent width observed in our IMACS spectra. The H line luminosity is then converted to a star-formation rate using the | |||||||||||
| relation from Kennicutt & Evans (2012). | |||||||||||
2.2 Galaxy spectroscopy
Galaxies G1 and G2 were observed spectroscopically as part of our blind redshift survey in the fields of UV bright quasars with the short camera of the Inamori-Magellan Areal Camera and Spectrograph (IMACS; Dressler et al., 2011) in multi-object mode with the l grating and slitlets. In this configuration, IMACS delivers spectral coverage from to Å with spectral resolution of Å. G1 was observed in May of 2009 for a total of and again in May of 2010 for a total of . G2 was observed for a total of in May of 2010. The IMACS data were reduced using the Carnegie Observatories System for MultiObject Spectroscopy111 http://code.obs.carnegiescience.edu/cosmos (COSMOS) version 2.16 as described in Chen & Mulchaey (2009). The spectra were flux calibrated in a relative sense using a bright star on the multi-object mask, but no absolute flux standard is available. Since G1 and G2 were observed on different masks and were flux calibrated using different stars, the measured spectral slope of the galaxies cannot be compared. The galaxy redshifts are determined by fitting SDSS galaxy eigenspectra (e.g. Yip et al., 2004) and are corrected for the heliocentric motion of the Earth using the IRAF rvcorrect routine. The final redshifts for G1 and G2 are and respectively. Based on a comparison of galaxy redshifts in the PG + field measured by both our survey and the SDSS222 We note that G1 and G2 were not observed spectroscopically by the SDSS., we estimate that the - uncertainty in the redshifts corresponds to . The reduced spectra of galaxies G1 and G2 are shown in the bottom left and top left panels of Figure 1 respectively, and the spectroscopic properties of the two galaxies are shown in Table 4.
2.3 COS and HIRES quasar spectroscopy
High quality UV spectra of PG + were acquired with the Cosmic Origins Spectrograph (COS; Green et al., 2012) aboard the Hubble Space Telescope (HST) as part of a blind survey for IGM absorption (PI: Todd Tripp, PID: ). The HST observations include six exposures totaling with the G130M grating (covering the spectral range Å with a spectral resolution of ) and eight exposures totaling with the G160M grating ( Å , ). We combined the 1D, calibrated COS spectra using a custom software suite first described in Meiring et al. (2011). COS is a photon-counting instrument with very low dark backgrounds and minimal scattered light (see Green et al., 2012). This has two implications: (1) it is straightforward to estimate flux uncertainties based on photon counting statistics, and (2) in pixels with low flux levels (e.g., pixels in the cores of deep absorption lines), total counts in an exposure can be very low resulting in asymmetric (Poissonian) flux uncertainties. We evaluated these uncertainties by coadding exposures and accumulating gross and background counts in each pixel, which were used to determine uncertainties based on Poisson statistics (e.g. Gehrels, 1986). To correct for inaccuracies in the COS wavelength calibration, we aligned the exposures by cross correlating well-detected interstellar or extragalactic absorption lines, and likewise the G130M and G160M segments were aligned by cross correlating lines of comparable strength. COS spectra also exhibit fixed-pattern noise, due to shadows from the photocathode grid wires. We corrected the data for these fixed-pattern features using flatfields derived from high-S/N white dwarf observations (D. Massa, private communication) filtered to remove spurious high-frequency noise. Fixed pattern noise due to the hexagonal pattern in the micro-channel plate cannot be fully removed, but the significance of this fixed pattern noise is reduced by the combination of multiple exposures acquired with different central-wavelength settings.
In addition to the UV COS spectrum, high-resolution optical spectra of the quasar were acquired with the High Resolution Echelle Spectrometer with settings optimized for short-wavelength observations (HIRESb; Vogt et al., 1994) on the Keck I telescope (PI: Jason Prochaska, PID: U066Hb) in March of 2010. The HIRESb observations include two exposures totaling with the slit (covering the spectral range Å with spectral resolution of ). We reduced the HIRES spectrum with standard techniques using the HIRedux package333 http://www.ucolick.org/xavier/HIRedux/index.html bundled in the XIDL library.
3 Galaxy pair properties
Galaxies G1 and G2 are separated from each other by kpc in projected distance and in line-of-sight velocity. The galaxies exhibit low-surface brightness features (see the right panel of Figure 1) characteristic of tidal disruption (though we cannot rule out the possibility of faint spiral arms). These faint features combined with the small projected distance and radial velocity difference indicate that G1 and G2 are strongly interacting.
G1 has a rest-frame -band absolute magnitude , rest-frame optical color , and a best-fit stellar mass444 Best-fit stellar masses are an ancillary product of the kcorrect code. of , while G2 has , , and . Adopting the stellar-to-halo mass relation of Moster et al. (2010) from an abundance matching approach, we estimate that the halo mass of the interacting galaxy pair is with a corresponding virial velocity .
The colors of both galaxies are consistent with those of an evolved stellar population with some trace of ongoing star-formation. We estimate the star-formation rates of G1 and G2 using a combination of our imaging and spectroscopic data. First, we measure the rest-frame, H emission equivalent widths observed in the galaxy spectra. Our IMACS spectrum of G1 shows only weak H emission despite the presence of both [N II] and [S II] emission due to underlying stellar absorption. We correct for the stellar absorption based on the best-fit stellar-population synthesis (SPS) model described below after convolving and rebinning the SPS model spectrum to match the IMACS resolution and wavelength grid. The stellar absorption corrected H emission equivalent width of G1 is Å. Similarly, we measure a stellar absorption corrected equivalent width of Å for G2. Next, we estimate the H line luminosities of G1 and G2 using these equivalent widths and the -band absolute magnitudes of the galaxies. Finally, we convert the H luminosities to star-formation rates using the formula from Kennicutt & Evans (2012). The estimated star-formation rates of G1 and G2 are and respectively.
In addition, we measure the [N II] emission equivalent widths of G1 and G2 in order to estimate the gas-phase Oxygen abundance of the two galaxies using the “N2” index from Pettini & Pagel (2004). Galaxies G1 and G2 exhibit [N II] equivalent widths of and respectively. The corresponding Oxygen abundance estimates for G1 and G2 are and . We note that our IMACS spectra are dominated by the central regions of these two galaxies, and in the presence of metallicity gradients, our gas-phase Oxygen abundances are upper limits. For reference, the estimated Oxygen abundance of the Sun is (Allende Prieto et al., 2001).
The relatively high [N II] to H line ratios observed in G1 and G2 raise the possibility that the galaxies host low-ionization nuclear emission-line regions (LINER) powered by active galactic nuclei (AGN). To address this possibility, we measure - upper limits on the equivalent width of [O I] of Å for G1 and Å for G2. These non-detections of [O I] emission place limits on the [O I] to H emission-line ratios of . This limit indicates that neither galaxy hosts a LINER AGN based on the models of Kewley et al. (2006). In addition, neither galaxy falls in the AGN region of the versus classification system developed by Cid Fernandes et al. (2011) for weak emission-line galaxies. Finally, the images of G1 and G2 show no evidence for nuclear point-sources. We therefore conclude that neither G1 nor G2 hosts an AGN.
We also estimate the ages of the dominant stellar populations of G1 and G2 using a maximum-likelihood analysis that compares Stellar Population Synthesis (SPS) models with the observed properties of the two galaxies. We compute the SPS model spectra using the Bruzual & Charlot (2003) code with updated stellar libraries and evolutionary tracks (Bruzual & Charlot, 2010) and the dust model from Charlot & Fall (2000) which is parameterized by the optical depth applied to stars younger than Myr and a fraction of in the diffuse interstellar medium (and hence applied to both young and old stars). The model spectra span a range in age from to in steps of ; a range in the -folding time from to Gyr in steps of Gyr; a range in metallicity covering and ; and a range in dust properties with ranging from to in steps of and to in steps of .
We compute the likelihood of each SPS model realization by comparing the apparent magnitudes of G1 and G2 and the rest-frame absorption-line equivalent widths of , the G-band, , , and of the two galaxies measured in our IMACS spectra (see Table 4). We include the absorption-line equivalent width measurements in our likelihood analysis in order to help break the age-metallicity degeneracy.
| H I | Si II | C II | Si III | Mg II | Si IV | C IV | O VI | |||
| Notes | ||||||||||
| a Features are contaminated by intervening systems. Limits and measurements are based on a Voigt profile analysis described | ||||||||||
| in Section 4. | ||||||||||
| b Limits are - and calculated over a window. | ||||||||||
The maximum-likelihood age of the dominant stellar population of G1 is and that of G2 is after marginalizing over all other parameters. The stellar mass estimates of the two galaxies from our SPS modeling are consistent with those from kcorrect within uncertainties. The mean values of the other parameters are ; Gyr; ; and for G1, G2. The mean star-formation rates averaged over the last Myr are for both G1 and G2. The specific star-formation rate of G2 is therefore approximately four times that of G1 since G1 is four times more massive. This is consistent with the bluer colors of G2 relative to G1.
No other spectroscopically observed galaxies are known in the proximity of the interacting pair. We carried out a search for galaxies brighter than with SDSS photometric redshifts (Csabai et al., 2007; Carliles et al., 2010) consistent with and within of the quasar sightline. There are three galaxies meeting these criteria at and ( and kpc at ) with apparent -band magnitudes of and and photometric redshifts and . Therefore, G1 and G2 may be part of a small galaxy group.
4 The transparent sightline
The sightline of PG + probes the environment of the interacting galaxy pair at kpc and an angle of degrees from the major axis of G1, and at kpc and an angle of degrees from the major axis of G2. Despite the small impact parameter, the quasar spectrum exhibits surprisingly little absorption associated with the galaxy pair with a total H I column density no greater than and no detected heavy element absorption within the virial velocity, .
In this section, we summarize the H I column density measurement and and limits on the column densities of heavy element ions enabled by the COS and HIRES spectra of PG +.
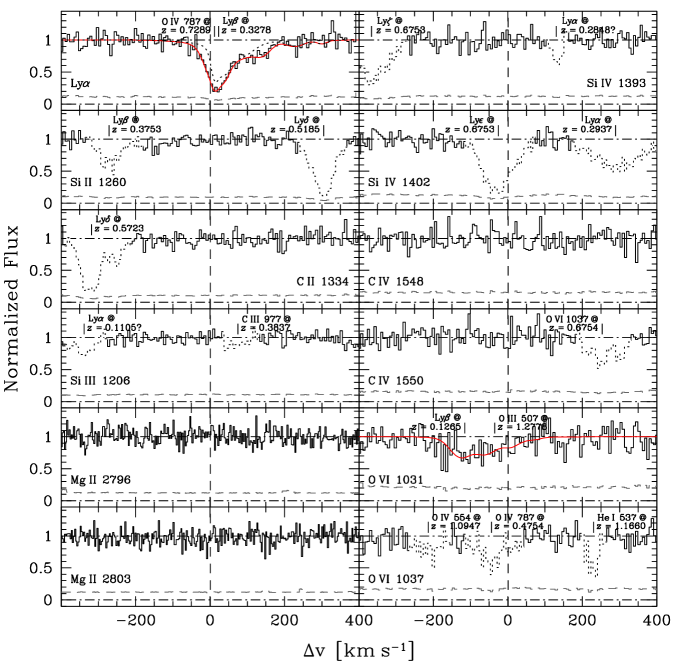
We measure the absorber properties based on a Voigt profile analysis using the VPFIT package (Carswell et al., 1987). In cases of component blending, we employ the minimum number of absorption components required to achieve a reasonable value. The COS line-spread function (LSF) exhibits broad wings which contain up to % of the flux (Ghavamian et al., 2009). In order to properly account for the absorption that falls in the LSF wings, we convolve the Voigt profile models with the empirical, wavelength-dependent COS LSF555http://www.stsci.edu/hst/cos/performance/spectral_resolution/. The continuum normalized COS spectrum and best-fit models are displayed in Figure 2.
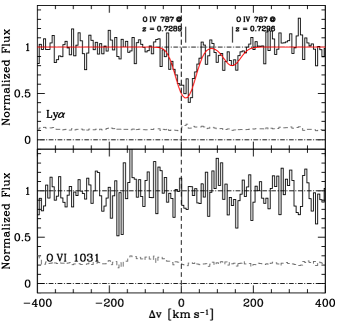
The absorption associated with the galaxy pair (see the top left panel of Figure 2) is contaminated by at , but the strength of the contaminating absorption is constrained by the and features observed in the COS spectrum. In order to remove the contamination, we perform a simultaneous Voigt profile fit to the and transitions, resulting in a model for the corresponding . We then divide the data by the modeled absorption to remove the contamination due to the system (see the top panel of Figure 3).
After removal of the absorption, the data show significant absorption which could be due to associated with the galaxy pair, O IV absorption from a Lyman limit system (LLS) at , or a combination of the two. Lehner et al. 2013 report a metallicity and ionization parameter limit of and based on the H I, C III, and O III column densities detected in the LLS. With metallicity and ionization parameter within this range, we do not expect the O IV associated with the LLS to to significantly contaminate the associated with the galaxy pair. However, O VI is detected in the LLS indicating a multi-phase nature, and the velocity structure seen in the LLS is consistent with the two absorption components seen in the top panel of Figure 3. Consequently, a significant portion of the observed absorption could be due to O IV associated with the LLS. We therefore place a limit on the possible presence of H I associated with the galaxy pair by attributing all of the observed absorption to at . The data are best fit by two Voigt components at and with column densities of and line widths of respectively. The line-widths correspond to an upper limit on the gas temperature of K. We note that the line-width measurements are only valid under the assumption that the observed absorption is largely due to associated with the galaxy pair.
The O VI absorption associated with G1 and G2 (see the second panel from the bottom on the left of Figure 2) is contaminated by at and O III at . In order to remove the contaminating absorption, we perform a Voigt profile analysis of the absorption at and O III absorption at . We use these fits to model the contaminating absorption and divide the data by the model to remove the contamination. The results are shown in the bottom panel of Figure 3). No excess absorption is observed and we place a - limit of on the O VI associated with the galaxy pair.
The other transitions shown in Figure 2 are not significantly contaminated. For these transitions, we calculate column density limits by measuring the - equivalent width limit over a window (significantly broader than the wings of the COS LSF) centered at and convert to the corresponding - limit in column density assuming that the gas is optically thin. We detect no other heavy-element absorption associated with G1 and G2 with column density limits of , , , , , and . The column density limits of the absorption associated with the galaxy pair are summarized in Table 5. We are not able to place a limit on the presence of N V because the doublet is contaminated by a Lyman limit system at .
We performed a series of Cloudy (Version 13; see Ferland et al., 2013) photoionization models in an attempt to constrain the physical conditions of the galaxy halo gas, but the H I, O VI, and other heavy element column density limits are not sufficient to place constraints on the metallicity and ionization state of the gas.
5 Discussion and Conclusions
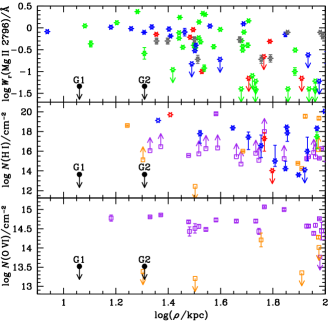
We have identified an interacting pair of galaxies at and kpc from the sightline toward the background quasar PG + at . A search in the photometric redshift catalog of SDSS galaxies shows that the galaxy pair may be part of a small galaxy group (as discussed at the end of Section 3). The quasar sightline reveals surprisingly little absorption associated with the galaxy pair with a total H I column density no greater than and no detected heavy-element absorption. The dearth of absorption is unusual when compared with results from previous absorption-line surveys in the vicinities of field galaxies. In the top panel of Figure 4, we show the relation from Chen et al. (2010) along with the limit on the equivalent width of Mg II associated with G1 and G2. All 15 field galaxies in the Chen et al. (2010) sample at kpc from the background quasar sightline exhibit a strong associated Mg II absorber, indicating a unity gas covering fraction. In contrast, the Mg II equivalent width limit for G1 and G2 falls more than an order-of-magnitude below the mean expected from the Chen et al. (2010) sample.
Similarly, we show the H I column density versus relation from Chen et al. (2001a) and Werk et al. (2013) in the middle panel of Figure 4 along with the H I column density of gas associated with G1 and G2 which falls well below the mean expected from the Chen et al. (2001a) and Werk et al. (2013) samples. We estimate that the probability of seeing such little absorption in a sightline at kpc to two non-interacting galaxies is less than %
In addition, we detect no O VI absorption associated with the galaxy pair indicating an absence of the warm-hot halo gas commonly seen around galaxies with detectable star-formation (e.g. Chen et al., 2001a; Tumlinson et al., 2011). In the bottom panel of Figure 4, we show the O VI column density versus relation from Werk et al. (2013) along with the O VI column density limit of gas associated with G1 and G2. The O VI column density limit falls an order-of-magnitude below the mean expected from galaxies with detectable star-formation in the Werk et al. (2013) sample.
Cool gas is commonly detected in the halos of galaxies out to several hundred kpc in both -cm studies at low redshift (e.g. Oosterloo et al., 2007; Grossi et al., 2009) and in more sensitive absorption-line studies at higher redshift (e.g. Chen et al., 2010; Tumlinson et al., 2011; Thom et al., 2012). At the same time, a reduced H I gas mass is commonly seen in groups of galaxies (e.g. Verdes-Montenegro et al., 2001; Pisano et al., 2011; Catinella et al., 2013). The gaseous halos of the interacting galaxies presented here could have been tidally stripped, expelled, or heated to K by an interaction-triggered feedback mechanism such as a starburst or an active-galactic nucleus (AGN) driven wind. However, there is no observational evidence for a recent burst of star-formation or AGN activity, making more direct stripping or heating by the galaxy interaction a more likely explanation for the dearth of absorption near the galaxy pair. The reservoirs of cool gas in the galaxy halos have been significantly depleted possibly indicating that the galaxies are in the process of interaction-induced quenching. Based on a single sightline alone, however, we cannot rule out the presence of significant cool gas in the galaxy halos since the halos could be characterized by a reduced but non-zero covering fraction. Indeed, our observations cannot rule out the presence of a substantial H I gas disk. For galaxies with stellar masses similar to that of G1, we expect an H I gas disk with mass of based on the stellar to H I mass relation from Catinella et al. (2013). Adopting the H I disk mass to cross-section scaling relation from Rosenberg & Schneider (2003), we infer an expected H I disk radius of kpc. It is therefore possible that G1 possesses an H I disk within the normal mass range but which is not large enough to intercept the sightline of PG +.
The transparent sightline at low impact parameter to two interacting galaxies presented here underscores the potential impact of galaxy interactions on the gaseous halos of galaxies. It suggests that galaxy interactions can significantly reduce the reservoir of cool gas in galaxy halos without a strong feedback mechanism. However, the relationship between galaxy environment and halo gas content remains largely unexplored. We are aware of only two other low impact parameter sightlines probing close and possibly interacting galaxy pairs. One consists of two red () galaxies at separated by kpc and probed by a quasar sightline at projected distances of kpc. Chen et al. (2010) report the detection of an associated Mg II absorption system at with Å for this galaxy pair. The other galaxy pair consists of two star-forming galaxies separated by kpc at and is probed at kpc by the sightline of the UV-bright quasar SDSS J0820+2334 (see Werk et al., 2012). There is a moderate absorber with associated with this galaxy pair () with no detected metal-line absorption.
The observed H I absorption is significantly weaker than what is expected for a sightline at low impact parameter to non-interacting galaxies. There is a strong system with and associated C IV and O VI absorption at , the same velocity as a more luminous, star-forming galaxy at kpc. The presence the more luminous, star-forming galaxy complicates the interpretation of this system. Further exploration of the impact of galaxy environment and interactions on the gaseous content of galaxy halos will likely require a systematic survey of quasar sightlines probing the environments of group galaxies.
Acknowledgements
We are grateful to M. Rauch and W. Sargent for obtaining deep optical images of the PG + field for us. We thank the anonymous referee for highly constructive comments and feedback. We are grateful for the support provided by the staff at the Las Campanas Observatories. This paper includes data gathered with the 6.5 meter Magellan Telescopes located at Las Campanas Observatory, Chile. Some of the data presented herein were obtained at the W. M. Keck Observatory, which is operated as a scientific partnership among the California Institute of Technology, the University of California and the National Aeronautics and Space Administration. The Observatory was made possible by the generous financial support of the W. M. Keck Foundation. SDJ acknowledges support from a National Science Foundation Graduate Research Fellowship. Partial support for this research was provided by NASA through grant HST-GO-11741. This research has made use of the NASA Astrophysics Data System (ADS) and the NASA/IPAC Extragalactic Database (NED) which is operated by the Jet Propulsion Laboratory, California Institute of Technology, under contract with the National Aeronautics and Space Administration.
References
- Ahn et al. (2012) Ahn C. P., Alexandroff R., Allende Prieto C., Anderson S. F., Anderton T., Andrews B. H., Aubourg É., Bailey S., Balbinot E., Barnes R., et al., 2012, ApJS, 203, 21
- Allende Prieto et al. (2001) Allende Prieto C., Lambert D. L., Asplund M., 2001, ApJL, 556, L63
- Balogh et al. (2000) Balogh M. L., Navarro J. F., Morris S. L., 2000, ApJ, 540, 113
- Barnes (1989) Barnes J. E., 1989, Nature, 338, 123
- Bell et al. (2004) Bell E. F., Wolf C., Meisenheimer K., Rix H.-W., Borch A., Dye S., Kleinheinrich M., Wisotzki L., McIntosh D. H., 2004, ApJ, 608, 752
- Bergeron & Boissé (1991) Bergeron J., Boissé P., 1991, AAP, 243, 344
- Bertin & Arnouts (1996) Bertin E., Arnouts S., 1996, AAPS, 117, 393
- Bertin et al. (2002) Bertin E., Mellier Y., Radovich M., Missonnier G., Didelon P., Morin B., 2002, in Astronomical Society of the Pacific Conference Series, Vol. 281, Astronomical Data Analysis Software and Systems XI, Bohlender D. A., Durand D., Handley T. H., eds., p. 228
- Blanton & Roweis (2007) Blanton M. R., Roweis S., 2007, AJ, 133, 734
- Bordoloi et al. (2011) Bordoloi R., Lilly S. J., Knobel C., Bolzonella M., Kampczyk P., Carollo C. M., Iovino A., Zucca E., Contini T., Kneib J.-P., Le Fevre O., Mainieri V., Renzini A., Scodeggio M., Zamorani G., Balestra I., Bardelli S., Bongiorno A., Caputi K., Cucciati O., de la Torre S., de Ravel L., Garilli B., Kovač K., Lamareille F., Le Borgne J.-F., Le Brun V., Maier C., Mignoli M., Pello R., Peng Y., Perez Montero E., Presotto V., Scarlata C., Silverman J., Tanaka M., Tasca L., Tresse L., Vergani D., Barnes L., Cappi A., Cimatti A., Coppa G., Diener C., Franzetti P., Koekemoer A., López-Sanjuan C., McCracken H. J., Moresco M., Nair P., Oesch P., Pozzetti L., Welikala N., 2011, ApJ, 743, 10
- Bowen et al. (2002) Bowen D. V., Pettini M., Blades J. C., 2002, ApJ, 580, 169
- Bruzual & Charlot (2003) Bruzual G., Charlot S., 2003, MNRAS, 344, 1000
- Bruzual & Charlot (2010) Bruzual G. R., Charlot S., eds., 2010, IAU Symposium, Vol. 262, Stellar Populations - Planning for the Next Decade
- Carliles et al. (2010) Carliles S., Budavári T., Heinis S., Priebe C., Szalay A. S., 2010, ApJ, 712, 511
- Carswell et al. (1987) Carswell R. F., Webb J. K., Baldwin J. A., Atwood B., 1987, ApJ, 319, 709
- Casali et al. (2007) Casali M., Adamson A., Alves de Oliveira C., et al., 2007, AAP, 467, 777
- Catinella et al. (2013) Catinella B., Schiminovich D., Cortese L., Fabello S., Hummels C. B., Moran S. M., Lemonias J. J., Cooper A. P., Wu R., Heckman T. M., Wang J., 2013, MNRAS
- Charlot & Fall (2000) Charlot S., Fall S. M., 2000, ApJ, 539, 718
- Chen et al. (2010) Chen H.-W., Helsby J. E., Gauthier J.-R., Shectman S. A., Thompson I. B., Tinker J. L., 2010, ApJ, 714, 1521
- Chen et al. (2001a) Chen H.-W., Lanzetta K. M., Webb J. K., 2001a, ApJ, 556, 158
- Chen et al. (1998) Chen H.-W., Lanzetta K. M., Webb J. K., Barcons X., 1998, ApJ, 498, 77
- Chen et al. (2001b) —, 2001b, ApJ, 559, 654
- Chen & Mulchaey (2009) Chen H.-W., Mulchaey J. S., 2009, ApJ, 701, 1219
- Churchill et al. (1996) Churchill C. W., Steidel C. C., Vogt S. S., 1996, ApJ, 471, 164
- Cid Fernandes et al. (2011) Cid Fernandes R., Stasińska G., Mateus A., Vale Asari N., 2011, MNRAS, 413, 1687
- Cox et al. (2006) Cox T. J., Dutta S. N., Di Matteo T., Hernquist L., Hopkins P. F., Robertson B., Springel V., 2006, ApJ, 650, 791
- Csabai et al. (2007) Csabai I., Dobos L., Trencséni M., Herczegh G., Józsa P., Purger N., Budavári T., Szalay A. S., 2007, Astronomische Nachrichten, 328, 852
- de Vaucouleurs (1961) de Vaucouleurs G., 1961, ApJS, 5, 233
- Dekel & Birnboim (2006a) Dekel A., Birnboim Y., 2006a, MNRAS, 368, 2
- Dekel & Birnboim (2006b) —, 2006b, MNRAS, 368, 2
- Dressler (1980) Dressler A., 1980, ApJ, 236, 351
- Dressler et al. (2011) Dressler A., Bigelow B., Hare T., Sutin B., Thompson I., Burley G., Epps H., Oemler A., Bagish A., Birk C., Clardy K., Gunnels S., Kelson D., Shectman S., Osip D., 2011, PASP, 123, 288
- Faber et al. (2007) Faber S. M., Willmer C. N. A., Wolf C., et al., 2007, ApJ, 665, 265
- Ferland et al. (2013) Ferland G. J., Porter R. L., van Hoof P. A. M., Williams R. J. R., Abel N. P., Lykins M. L., Shaw G., Henney W. J., Stancil P. C., 2013, RMXAA, 49, 137
- Gauthier et al. (2010) Gauthier J.-R., Chen H.-W., Tinker J. L., 2010, ApJ, 716, 1263
- Gehrels (1986) Gehrels N., 1986, ApJ, 303, 336
- Genel et al. (2008) Genel S., Genzel R., Bouché N., Sternberg A., Naab T., Schreiber N. M. F., Shapiro K. L., Tacconi L. J., Lutz D., Cresci G., Buschkamp P., Davies R. I., Hicks E. K. S., 2008, ApJ, 688, 789
- Ghavamian et al. (2009) Ghavamian P., Aloisi A., Lennon D., Hartig G., Kriss G. A., Oliveira C., Massa D., Keyes T., Proffitt C., Delker T., Osterman S., 2009, Preliminary Characterization of the Post- Launch Line Spread Function of COS. Tech. rep.
- Green et al. (2012) Green J. C., Froning C. S., Osterman S., Ebbets D., Heap S. H., Leitherer C., Linsky J. L., Savage B. D., Sembach K., Shull J. M., Siegmund O. H. W., Snow T. P., Spencer J., Stern S. A., Stocke J., Welsh B., Béland S., Burgh E. B., Danforth C., 2012, ApJ, 744, 60
- Grossi et al. (2009) Grossi M., di Serego Alighieri S., Giovanardi C., Gavazzi G., Giovanelli R., Haynes M. P., Kent B. R., Pellegrini S., Stierwalt S., Trinchieri G., 2009, AAP, 498, 407
- Gunn & Gott (1972) Gunn J. E., Gott III J. R., 1972, ApJ, 176, 1
- Hambly et al. (2008) Hambly N. C., Collins R. S., Cross N. J. G., et al., 2008, MNRAS, 384, 637
- Hewett et al. (2006) Hewett P. C., Warren S. J., Leggett S. K., Hodgkin S. T., 2006, MNRAS, 367, 454
- Hodgkin et al. (2009) Hodgkin S. T., Irwin M. J., Hewett P. C., Warren S. J., 2009, MNRAS, 394, 675
- Hopkins et al. (2009) Hopkins P. F., Somerville R. S., Cox T. J., Hernquist L., Jogee S., Kereš D., Ma C.-P., Robertson B., Stewart K., 2009, MNRAS, 397, 802
- Hubble (1936) Hubble E. P., 1936, Realm of the Nebulae
- Kenney et al. (2004) Kenney J. D. P., van Gorkom J. H., Vollmer B., 2004, AJ, 127, 3361
- Kennicutt & Evans (2012) Kennicutt R. C., Evans N. J., 2012, ARAA, 50, 531
- Kereš et al. (2009) Kereš D., Katz N., Davé R., Fardal M., Weinberg D. H., 2009, MNRAS, 396, 2332
- Kewley et al. (2001) Kewley L. J., Dopita M. A., Sutherland R. S., Heisler C. A., Trevena J., 2001, ApJ, 556, 121
- Kewley et al. (2006) Kewley L. J., Groves B., Kauffmann G., Heckman T., 2006, MNRAS, 372, 961
- Lanzetta et al. (1995) Lanzetta K. M., Bowen D. V., Tytler D., Webb J. K., 1995, ApJ, 442, 538
- Larson et al. (1980) Larson R. B., Tinsley B. M., Caldwell C. N., 1980, ApJ, 237, 692
- Lawrence et al. (2007) Lawrence A., Warren S. J., Almaini O., et al., 2007, MNRAS, 379, 1599
- Le Fèvre et al. (2003) Le Fèvre O., Saisse M., Mancini D., Brau-Nogue S., Caputi O., Castinel L., D’Odorico S., Garilli B., Kissler-Patig M., Lucuix C., Mancini G., Pauget A., Sciarretta G., Scodeggio M., Tresse L., Vettolani G., 2003, in Society of Photo-Optical Instrumentation Engineers (SPIE) Conference Series, Vol. 4841, Society of Photo-Optical Instrumentation Engineers (SPIE) Conference Series, Iye M., Moorwood A. F. M., eds., pp. 1670–1681
- Lehner et al. (2013) Lehner N., Howk J. C., Tripp T. M., Tumlinson J., Prochaska J. X., O’Meara J. M., Thom C., Werk J. K., Fox A. J., Ribaudo J., 2013, ApJ, 770, 138
- Lopez et al. (2008) Lopez S., Barrientos L. F., Lira P., Padilla N., Gilbank D. G., Gladders M. D., Maza J., Tejos N., Vidal M., Yee H. K. C., 2008, ApJ, 679, 1144
- Lovegrove & Simcoe (2011) Lovegrove E., Simcoe R. A., 2011, ApJ, 740, 30
- Meiring et al. (2011) Meiring J. D., Tripp T. M., Prochaska J. X., Tumlinson J., Werk J., Jenkins E. B., Thom C., O’Meara J. M., Sembach K. R., 2011, ApJ, 732, 35
- Moore et al. (1996) Moore B., Katz N., Lake G., Dressler A., Oemler A., 1996, Nature, 379, 613
- Moore et al. (1998) Moore B., Lake G., Katz N., 1998, ApJ, 495, 139
- Morris et al. (1993) Morris S. L., Weymann R. J., Dressler A., McCarthy P. J., Smith B. A., Terrile R. J., Giovanelli R., Irwin M., 1993, ApJ, 419, 524
- Moster et al. (2010) Moster B. P., Somerville R. S., Maulbetsch C., van den Bosch F. C., Macciò A. V., Naab T., Oser L., 2010, ApJ, 710, 903
- Oosterloo et al. (2007) Oosterloo T. A., Morganti R., Sadler E. M., van der Hulst T., Serra P., 2007, AAP, 465, 787
- Pettini & Pagel (2004) Pettini M., Pagel B. E. J., 2004, MNRAS, 348, L59
- Pisano et al. (2011) Pisano D. J., Barnes D. G., Staveley-Smith L., Gibson B. K., Kilborn V. A., Freeman K. C., 2011, ApJS, 197, 28
- Poggianti et al. (2006) Poggianti B. M., von der Linden A., De Lucia G., Desai V., Simard L., Halliday C., Aragón-Salamanca A., Bower R., Varela J., Best P., Clowe D. I., Dalcanton J., Jablonka P., Milvang-Jensen B., Pello R., Rudnick G., Saglia R., White S. D. M., Zaritsky D., 2006, ApJ, 642, 188
- Prochaska et al. (2011) Prochaska J. X., Weiner B., Chen H.-W., Mulchaey J., Cooksey K., 2011, ApJ, 740, 91
- Rosenberg & Schneider (2003) Rosenberg J. L., Schneider S. E., 2003, ApJ, 585, 256
- Schlegel et al. (1998) Schlegel D. J., Finkbeiner D. P., Davis M., 1998, ApJ, 500, 525
- Schweizer & Seitzer (1992) Schweizer F., Seitzer P., 1992, AJ, 104, 1039
- Simcoe et al. (2006) Simcoe R. A., Sargent W. L. W., Rauch M., Becker G., 2006, ApJ, 637, 648
- Spitzer & Baade (1951) Spitzer Jr. L., Baade W., 1951, ApJ, 113, 413
- Springel et al. (2005) Springel V., Di Matteo T., Hernquist L., 2005, MNRAS, 361, 776
- Steidel et al. (2010) Steidel C. C., Erb D. K., Shapley A. E., Pettini M., Reddy N., Bogosavljević M., Rudie G. C., Rakic O., 2010, ApJ, 717, 289
- Stocke et al. (2006) Stocke J. T., Penton S. V., Danforth C. W., Shull J. M., Tumlinson J., McLin K. M., 2006, ApJ, 641, 217
- Strateva et al. (2001) Strateva I., Ivezić Ž., Knapp G. R., et al., 2001, AJ, 122, 1861
- Thom et al. (2012) Thom C., Tumlinson J., Werk J. K., Prochaska J. X., Oppenheimer B. D., Peeples M. S., Tripp T. M., Katz N. S., O’Meara J. M., Brady Ford A., Davé R., Sembach K. R., Weinberg D. H., 2012, ApJL, 758, L41
- Tonnesen & Bryan (2009) Tonnesen S., Bryan G. L., 2009, ApJ, 694, 789
- Toomre & Toomre (1972) Toomre A., Toomre J., 1972, ApJ, 178, 623
- Tripp et al. (1998) Tripp T. M., Lu L., Savage B. D., 1998, ApJ, 508, 200
- Tumlinson et al. (2011) Tumlinson J., Thom C., Werk J. K., Prochaska J. X., Tripp T. M., Weinberg D. H., Peeples M. S., O’Meara J. M., Oppenheimer B. D., Meiring J. D., Katz N. S., Davé R., Ford A. B., Sembach K. R., 2011, Science, 334, 948
- Verdes-Montenegro et al. (2001) Verdes-Montenegro L., Yun M. S., Williams B. A., Huchtmeier W. K., Del Olmo A., Perea J., 2001, AAP, 377, 812
- Vogt et al. (1994) Vogt S. S., Allen S. L., Bigelow B. C., et al., 1994, in Society of Photo-Optical Instrumentation Engineers (SPIE) Conference Series, Vol. 2198, Society of Photo-Optical Instrumentation Engineers (SPIE) Conference Series, Crawford D. L., Craine E. R., eds., p. 362
- Wakker & Savage (2009) Wakker B. P., Savage B. D., 2009, ApJS, 182, 378
- Werk et al. (2012) Werk J. K., Prochaska J. X., Thom C., Tumlinson J., Tripp T. M., O’Meara J. M., Meiring J. D., 2012, ApJS, 198, 3
- Werk et al. (2013) Werk J. K., Prochaska J. X., Thom C., Tumlinson J., Tripp T. M., O’Meara J. M., Peeples M. S., 2013, ApJS, 204, 17
- Yip et al. (2004) Yip C. W., Connolly A. J., Szalay A. S., Budavári T., SubbaRao M., Frieman J. A., Nichol R. C., Hopkins A. M., York D. G., Okamura S., Brinkmann J., Csabai I., Thakar A. R., Fukugita M., Ivezić Ž., 2004, AJ, 128, 585
- Yoon et al. (2012) Yoon J. H., Putman M. E., Thom C., Chen H.-W., Bryan G. L., 2012, ApJ, 754, 84
- York et al. (2000) York D. G., Adelman J., Anderson Jr. J. E., et al., 2000, AJ, 120, 1579