Totani et al.Damping Wing Analysis of GRB 130606A \Received2013/12/14\Accepted2014/2/6
Techniques: spectroscopic — Gamma-ray burst: individual: GRB 130606A — dark ages, reionization, first stars
Probing Intergalactic Neutral Hydrogen by the Lyman Alpha Red Damping Wing of Gamma-Ray Burst 130606A Afterglow Spectrum at
Abstract
The unprecedentedly bright optical afterglow of GRB 130606A located by Swift at a redshift close to the reionization era () provides a new opportunity to probe the ionization status of intergalactic medium (IGM). Here we present an analysis of the red Ly damping wing of the afterglow spectrum taken by Subaru/FOCAS during 10.4–13.2 hr after the burst. We find that the minimal model including only the baseline power-law and H\emissiontypeI absorption in the host galaxy does not give a good fit, leaving residuals showing concave curvature in 8400–8900 Å with an amplitude of about 0.6% of the flux. Such a curvature in the short wavelength range cannot be explained either by extinction at the host with standard extinction curves, intrinsic curvature of afterglow spectra, or by the known systematic uncertainties in the observed spectrum. The red damping wing by intervening H\emissiontypeI gas outside the host can reduce the residual by about 3 statistical significance. We find that a damped Ly system is not favored as the origin of this intervening H\emissiontypeI absorption, from the observed Ly and metal absorption features. Therefore absorption by diffuse IGM remains as a plausible explanation. A fit by a simple uniform IGM model requires H\emissiontypeI neutral fraction of 0.1–0.5 depending on the distance to the GRB host, implying high IGM associated with the observed dark Gunn-Peterson (GP) troughs. This gives a new evidence that the reionization is not yet complete at .
1 Introduction
Hydrogen is the dominant component of the baryonic matter in the universe and most of it is in the form of diffuse intergalactic medium (IGM). Observations of the cosmic microwave background radiation proves that it became neutral around 400,000 years after the Big Bang, but the absorption strength by IGM neutral hydrogen in quasar spectra [i.e., the Gunn-Peterson (GP, Gunn & Peterson 1965) test] tells us that IGM in the present universe is highly ionized. It is widely believed that the cosmic reionization occurred around –10 by radiation emitted from stars of the earliest generations, but the detailed history of reionization and early galaxy formation is yet to be observationally revealed. Detecting neutral hydrogen before reionization is an important challenge to understand the first stage of galaxy formation (see, e.g., Fan et al. 2006; Barkana & Loeb 2007; Robertson et al. 2010; Fan 2012 for reviews).
Although IGM hydrogen seems largely ionized at 5.5 from the quasar GP test, the GP optical depth rapidly increases with redshift around 6 indicating a systematic change of the IGM nature that may be related to reionization (Fan 2012). However, completely saturated absorptions (GP troughs) give only a weak lower bound on the neutral fraction of IGM hydrogen, . Furthermore, quasars are strongly biased tracers generally found in the strongest density peaks in large-scale structure, and quasars may have altered the ionization status of surrounding IGM by their strong radiation. Therefore, there is currently no direct evidence that reionization was complete by 5–6 (Mesinger 2010).
It is thus important to search neutral IGM having higher than that probed by the GP test at , and it may be detected by the damping wing feature redward of the resonant Ly wavelength. Gamma-ray burst (GRB) afterglows are expected to be a unique and useful tool for this approach (Miralda-Escude 1998; Lamb & Reichart 2000; Zhang 2007) because of the following reasons. The intrinsic nonthermal synchrotron spectrum before absorption is a simple power-law, and hence a precise analysis on the damping wing shape is possible. GRBs are expected to be less biased than quasars, allowing to probe more normal regions in large scale structure. Finally, their radiation hardly affects the ionization status of surrounding IGM because of much shorter duration than quasars.
However, strong constraints on reionization from GRBs have not yet been obtained, because of the low event rate of sufficiently bright GRBs at high redshifts, and contamination of hydrogen in their host galaxies to the damping wing feature. The only GRB-based constraint on reionization is a weak upper limit of at (Kawai et al. 2006; Totani et al. 2006), where the observed red Ly damping wing can be explained only by neutral hydrogen in its host galaxy with a column density of . GRBs at even higher redshifts have also been detected (Greiner et al. 2009; Patel et al. 2010; Salvaterra et al. 2009; Tanvir et al. 2009; Cucchiara et al. 2011), but their spectra do not have a sufficient signal-to-noise ratio for a precise damping wing analysis.
Recently a new opportunity has been given by GRB 130606A, which was detected by Swift and KONUS-Wind (Ukwatta et al. 2013; Golenetskii et al. 2013). The redshift was determined to be (Castro-Tirado et al. 2013a; Chornock et al. 2013) by its exceptionally bright afterglow among high redshift GRBs, and furthermore, a low H\emissiontypeI column density in the host (, Chornock et al. 2013; Castro-Tirado et al. 2013b) implies that a much better constraint on IGM neutral hydrogen may be obtained than the previous cases. Here we present a damping wing analysis of the unprecedentedly high signal-to-noise optical spectrum of GRB 130606A taken by the Subaru Telescope during 10.4–13.2 hr after the burst, to derive new constraints on the neutral hydrogen fraction of IGM at .
We describe our observation and data reduction in Section 2, and the damping wing analysis is presented in Section 3, showing an evidence for intervening H\emissiontypeI absorption in addition to that in the host galaxy. Various sources of systematic uncertainties are examined in Section 4, and we examine the possibility of an intervening damped Ly system (DLA) as the origin of the intervening H\emissiontypeI gas in Section 5. The summary and conclusions are presented in Section 6 with some discussions. Throughout the paper, H\emissiontypeI column density is given in units of cm-2.
2 Observation and Spectrum Reduction
The afterglow of GRB 130606A was observed on 2013 June 7 (UT) with the optical spectrograph FOCAS (Kashikawa et al. 2002) attached to the Subaru 8.2-m telescope (Iye et al. 2004). After the observation of GRB 050904 afterglow (Kawai et al. 2006) by the same instrument, FOCAS was upgraded with a new red-sensitive CCD in June 2010, resulting in a 30% higher quantum efficiency at 9000 Å and significantly reduced fringing. We obtained three types of spectra using the 300R, VPH650, and VPH900 grisms, covering 5820–10345, 6055–7747, and 7472–10538 Å with the pixel scales of 1.35, 0.61, and 0.74 Å, respectively. The 0.8 arcsec slit width mask was used for all the spectra, and the O58 filter was used for 300R and VPH900, while Y47 for VPH650. The list of each 20-minutes integration during 9.3–16.5 hr after the burst is summarized in Table 1. The atmospheric dispersion corrector was not available at this time, and we set the slit position angle at 90 degree (i.e., east-west direction) so that it is close to the parallactic angle when the airmass is large. It was a photometric condition with good seeing (0.5–0.7 arcsec FWHM in optical), which is smaller than the slit width. Consequently, the spectral resolution is 6.9 and 3.9 Å FWHM for the 300R and VPH900/650 spectra, respectively. The data were reduced using IRAF111IRAF is distributed by the National Optical Astronomy Observatory, which is operated by the Association of Universities for Research in Astronomy (AURA), Inc., under cooperative agreement with the National Science Foundation. for the procedures of overscan and bias subtraction, flat-fielding, wavelength calibration, and sky subtraction. Wavelength calibration was done by using OH night sky emission lines, with the resulting rms calibration error of 0.1–0.2 Å. The spectrum was then converted to the vacuum wavelength.
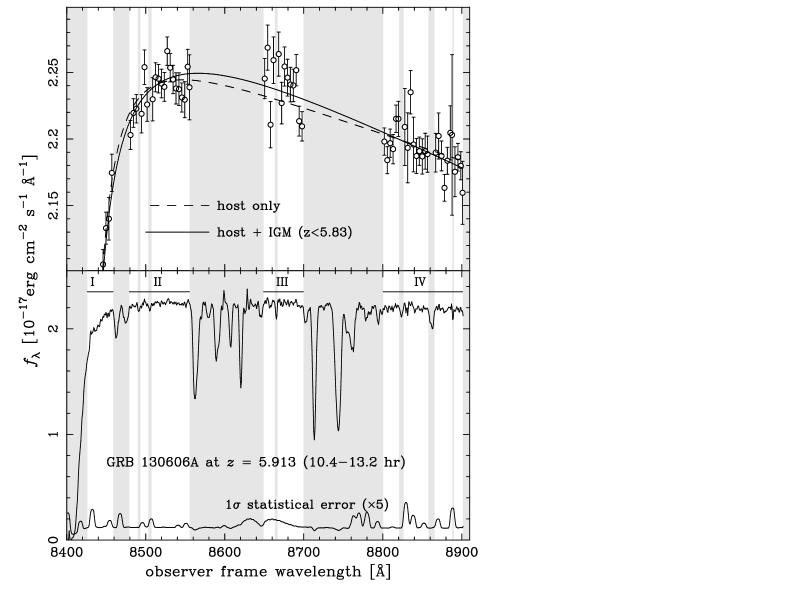
We use the VPH900 spectrum taken during 10.4–13.2 hr after the burst for the main damping wing analysis reported in this work (Fig. 1). The fractional statistical errors of the spectrum are 1% per pixel (0.74 Å), allowing us to examine the spectral shapes on 100 Å scale with a 0.1% level statistical precision. We paid a special attention to the data reduction as follows, since the shape of the damping wing may be affected even by small systematic uncertainties in such a high precision test. In this work we are interested in the narrow wavelength range including the damping wing, and we performed the reduction limited within the range of 8377–8902 Å, to avoid unnecessary systematic bias induced by, e.g., a sensitivity curve fitting in a wider wavelength range. Wavelength longer than 8902 Å was not used because of stronger atmospheric emission/absorption. As for the flux calibration, our primary data is calibrated using the spectral standard star Feige 34 in the CALSPEC database established as the Hubble Space Telescope (HST) calibration system. The Subaru data of Feige 34 obtained in the same night are compared with the CALSPEC template, and the sensitivity curve is constructed by fitting with a quadratic polynomial. The fit is good and we do not find any residual beyond statistical errors. Therefore, a 0.1% level precision test is possible for 100Å-scale spectral shapes within the reduced wavelength range.
| # | mode | June 7 (UT)∗ | Hours after GRB trigger∗ |
|---|---|---|---|
| 1 | 300R | 06:25:59.7 | 9.35574 |
| 2 | 300R | 06:46:30.6 | 9.69767 |
| 3 | 300R | 07:07:01.1 | 10.03946 |
| 4 | VPH900 | 07:28:00.2 | 10.38921 |
| 5 | VPH900 | 07:48:31.8 | 10.73134 |
| 6 | VPH900 | 08:09:00.7 | 11.07269 |
| 7 | VPH900 | 08:32:27.9 | 11.46359 |
| 8 | VPH900 | 08:52:59.0 | 11.80554 |
| 9 | VPH900 | 09:13:29.0 | 12.14722 |
| 10 | VPH900 | 09:36:54.7 | 12.53770 |
| 11 | VPH900 | 09:57:25.7 | 12.87964 |
| 12 | VPH900 | 10:17:55.9 | 13.22135 |
| 13 | VPH650 | 10:47:10.8 | 13.70882 |
| 14 | VPH650 | 11:07:40.6 | 14.05044 |
| 15 | VPH650 | 11:28:11.2 | 14.39228 |
| 16 | VPH650 | 11:52:04.5 | 14.79042 |
| 17 | VPH650 | 12:12:36.0 | 15.13249 |
| 18 | VPH650 | 12:33:06.3 | 15.47425 |
| 19 | VPH650 | 12:56:58.8 | 15.87216 |
| 20 | VPH650 | 13:17:28.5 | 16.21374 |
| 21 | VPH650 | 13:37:58.7 | 16.55546 |
∗ Midpoint of 20-min exposures.
3 Damping Wing Fitting Analysis
3.1 Model Description
The observed spectrum is fitted by models including absorptions by neutral hydrogen along the sightline, imprinted on the baseline power-law with an index (). We consider three components of H\emissiontypeI absorption: H\emissiontypeI in the host galaxy, diffuse H\emissiontypeI in IGM, and an intervening DLA that is often found in high-redshift quasar/GRB spectra.
The host H\emissiontypeI component is assumed to have a single Gaussian radial velocity dispersion with a column density . In our baseline analysis, we fixed the redshift of host H\emissiontypeI as , from the three low-ionization metal lines found in the same VPH900 spectrum used for the damping wing fit. (We found Si\emissiontypeII 1260.42, O\emissiontypeI 1302.17, and C\emissiontypeII 1334.53 and their redshifts are , , and , respectively. The C\emissiontypeII redshift may be affected by a slightly blending nearby line.) The widths of these lines are 5 Å FWHM that is slightly extended beyond the spectral resolution (3.9 Å), indicating a velocity dispersion of 100 km/s FWHM (or 43 km/s in ). Therefore we perform the fit in the limited range of 0–100 km/s, though the fit results are almost insensitive to (see next section).
We consider a component of constant-density diffuse IGM with the damping wing formula of Miralda-Escude (1998) with a neutral fraction extending in a redshift range from to . We adopted the GP optical depth calculated from the latest estimates of cosmological parameters (Komatsu et al. 2011) and the primordial helium abundance (Peimbert et al. 2007). Though the distribution of neutral hydrogen in IGM should be clumpy and inhomogeneous in reality, we test this simple model to get a rough estimate for mean required to explain the observed damping wing. Dark Ly troughs are found at along the sightline to this GRB (Chornock et al. 2013), and hence we set the lower bound of the H\emissiontypeI distribution as , but our results do not significantly change by choosing different values, because the contribution to the damping wing from H\emissiontypeI around is small. For the upper bound, we will test two models; one is assuming , while the other treats as a free parameter.
If we find an evidence for absorption by intervening H\emissiontypeI gas outside the host galaxy, it may be a result of an intervening DLA rather than diffuse IGM. Low-ionization metal absorption lines are generally associated to DLAs, and this would give a constraint on the DLA scenario. For the GRB 130606A spectrum, a metal absorption system at is found by Si\emissiontypeII, O\emissiontypeI, and C\emissiontypeII lines (Chornock et al. 2013), which is a good candidate of the DLA redshift. We will thus perform a fit to the observed damping wing with the DLA component at , with a column density of .
Therefore fits are performed with the free model parameters of , , , , and , while the overall normalization factor of the model is always chosen to fit the data (i.e., marginalized). The theoretical fluxes are calculated for each data point (i.e., pixel) of the VPH900 spectrum, then corrected for the Galactic extinction ( mag, Schlafly & Finkbeiner 2011), and finally convolved with a Gaussian profile of the instrumental wavelength resolution (3.9 Å FWHM).
We do not consider possible extinction by dust in the host, because standard extinction curves have a monotonic wavelength dependence within the short range analyzed here, and adding nonzero extinction is almost perfectly absorbed by an according change of the index , giving a practically identical fit (see Fig. 2 where the absorption profiles of various components are presented). Therefore the index here is not the intrinsic value for the afterglow emission, but should be regarded as an effective value in the analyzed wavelength range including extinction at the host. However, it is also useful to estimate the amount of extinction expected from the hydrogen column density in the host, . Using the mean relations for the Milky Way (MW, Predehl & Schmitt 1995) and the Small Magellanic Cloud (SMC, Gordon et al. 2003), this column density translates into and 0.0048, respectively. The value from the MW relation is likely an overestimate for this GRB, because the optical spectra of this GRB indicate a metallicity lower than 0.3 or 1/7 times the solar abundance (Chornock et al. 2013; Castro-Tirado et al. 2013b). It should also be noted that many GRB afterglows show smaller extinction than those expected from soft X-ray absorption or the - relations (Schady et al. 2010), implying that the above estimate of is likely an overestimate. For reference, = 0.042 and 0.094 are required to represent the reddening of in 8400–8900 Å by the change of , for the MW and SMC extinction curves, respectively.

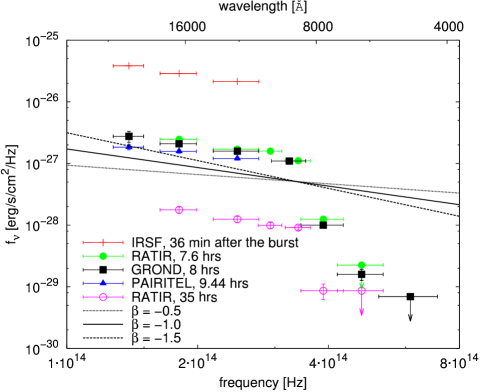
Other independent observational constraints are available for the power-law index from near-infrared photometric observations of the afterglow. In Fig. 3 we plot the reported optical/near-infrared photometric observations (Nagayama et al. 2013; Butler et al. 2013a,b; Morgan et al. 2013; Afonso et al. 2013), showing a constant value of at wavelengths longer than the Lyman break from 36 min to 35 hr after the burst. Using observations at the time close to the Subaru observation, we find from the GROND band data (8 hrs) and from the PAIRITEL band data (9.4 hrs). As mentioned above, extinction at the host should be at most , and the expected change of between the near-infrared bands and our wavelength range should be . The best-fit values obtained by our fits presented below (see Table 2) are roughly consistent with these independent measurements, taking into account the systematic uncertainties about host extinction and in estimating from photometric measurements (e.g., band filters, response function, or zero-point calibration).
3.2 Fitting Procedures and Statistical Significance Estimations
The spectrum has been reduced in the range of 8377–8902 Å, but we further removed the wavelength shorter than 8426 Å from the fitting analysis, because this region is dominated by the host H\emissiontypeI absorption rather than the other interesting components (Fig. 2). This is the region where the damping wing rapidly drops with decreasing wavelength, and a fitting becomes sensitive to the velocity distribution of H\emissiontypeI atoms in the host. Although we included a Gaussian distribution with the parameter in our fit, the realistic distribution is unlikely a pure Gaussian (Wolfe et al. 2005). The fit in this range is also sensitive to the uncertainties about the mean redshift of H\emissiontypeI in the host (i.e., ) and the instrumental spectral resolution. The lower bound of 8246 Å was determined as the shortest wavelength with which the fitting results are mostly insensitive to , as can be seen in Table 2. Discernible absorption features were also removed from the fitting as shown in Fig 1. Then 323 pixels remain for the fitting analysis.
The statistical errors are estimated from the noise spectrum produced by the object+sky electron counts and readout noise, which is random without correlation among different pixels. (Note that the FWHM of spectral resolution is larger than one pixel, but the random statistical errors appear in each pixel in addition to the signal convolved by the spectral resolution.) However, pixel-by-pixel statistical fluctuation of the final spectrum is smaller than the noise estimate, because the fluxes at neighboring pixels are mixed to some extent by the resampling for wavelength calibration in the spectrum reduction. At the same time, correlation between the errors of neighbouring pixels is generated, which may affect a analysis. This problem can be solved by binning the five connecting pixels, and we confirmed that the fit residuals of the best-fit model (the IGM-low model, see below) do not show any correlation between neighbouring bins within the statistical uncertainties. There are 68 bins after the binning, and we can adopt the standard analysis to calculate the best-fit values and the statistical confidence regions of the model parameters.
3.3 Fitting Results
| model | (km/s)‡ | or | |||
|---|---|---|---|---|---|
| host H\emissiontypeI only | 19.866 | 0.0 | - | 87.58 | |
| +IGM () | 19.719 | 100.0 | 0.086 | 78.66 | |
| +IGM () | 19.801 | 100.0 | 0.47 | 76.62 | |
| +DLA () | 19.799 | 100.0 | 20.704 | 77.02 |
∗The fit results for the host-only, IGM-,
IGM-low, and intervening DLA models. The quoted errors
are statistical 1. There are 68 data points used in the
calculation.
†The neutral hydrogen column density in the GRB host
() and that in an intervening
DLA () are in units of cm-2.
‡The survey range of is limited
to 0–100 km/s, motivated from the observed widths of the metal
absorption lines.
We first examine the simplest model including only H\emissiontypeI in the host galaxy (the host-only model hereafter). The best-fit values of the three model parameters (, , and ) and the value are given in Table 2, and the fit residuals of each pixel are shown in the top panel of Fig. 4. The 1 statistical errors for one model parameter in Table 2 were calculated by the standard procedure (Press et al. 2007), i.e., finding the parameter range corresponding to , where is the global minimum and is the minimum as a function of the parameter of interest, , with the other model parameters kept free (i.e., marginalized). For convenience, we define the four wavelength ranges I–IV (indicated in Figs. 1 and 4).
The most significant excess of the residuals of the host-only model is found in the wavelength range III at a level of about 0.6% of the flux. The trends of increasing/decreasing residuals with increasing wavelength in the ranges II/IV seem to be connected to the excess in the range III, showing the overall systematic trend of concave curvature spanning in the entire analysis wavelength range of 8400–8900 Å. We have examined various sources of systematic uncertainties, but the 0.6% level curvature in this narrow wavelength range cannot be explained (see Section 4).
The value of this fit is 87.58, and statistically the chance probability of getting this value is 2.7% (i.e., 2.2 rejection) for the 68 data points and four model parameters (i.e., 64 degrees of freedom). Here we examined this for a consistency check, and later we will find that this model is disfavored by about 3 in comparison with other models. This sigma difference is not surprising, because the total value and difference for different models are independent tests. For example, if a model parameter is wrong in a model fit but the parameter is affecting only a limited number of degrees of freedom, the total value is insensitive and we need to see the difference when the model parameter is changed.
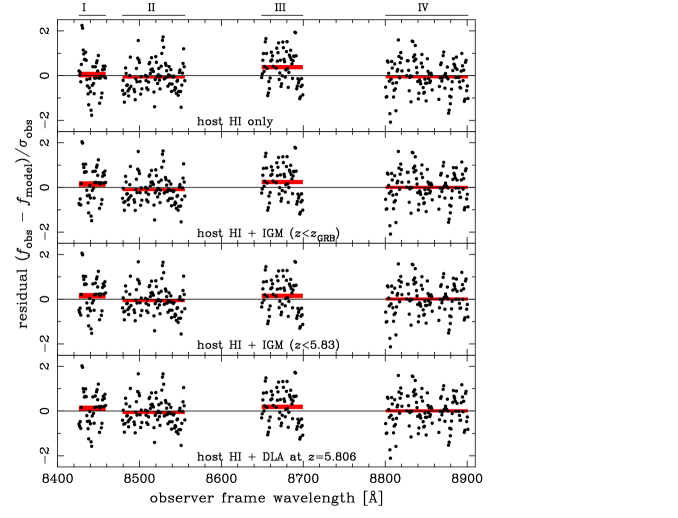
The concave curvature can be resolved by an absorption component that becomes rapidly stronger at shorter wavelengths, and hence the redward damping wing of another neutral hydrogen component on the sightline is a good candidate to improve the fit. Therefore we test the next simplest model with diffuse IGM H\emissiontypeI extending to the same redshift as the GRB host, i.e., (the IGM- model hereafter). The best-fit of this model with the new free parameter is presented in Table 2 and Fig. 4. The best-fit is obtained at , and the relative statistical significance against the host-only model can be estimated again in the standard manner (Press et al. 2007) as follows. Comparing the best-fit values of the host-only and IGM- models in Table 2, there is a reduction of with one new parameter of , where all the other parameters are marginalized. Therefore the latter model is preferred at the statistical significance of from statistics with one degree of freedom.
However, the curvature of residuals is still evident for this model in Fig. 4. This may be further improved by allowing lower values of , because such a model has a weaker wavelength dependence of IGM absorption, and hence the effect can reach to longer wavelength beyond the Ly break, while keeping the absorption around the break relatively weak. Therefore we performed a fit treating as a further free model parameter (the IGM-low model, hereafter), and the dependence of the minimum , best-fit and on is shown in Fig. 5, where the other parameters of and are marginalized by choosing values that minimize for each value of . We find a modest (, 1.4) improvement of the fit by decreasing down to , with a higher value of .

It is interesting to note that this redshift is coincident with the upper border of the region where the darkest GP troughs of Ly, , and are found to this sightline ( 5.67–5.83, Chornock et al. 2013), i.e., the region where we expect the largest amount of IGM neutral hydrogen. The physical proper distance between and the GRB host () is 5.3 Mpc. The best-fit model parameters for are presented in Table 2, and now the systematic curvature has almost disappeared in the fit residuals (Fig. 4). This IGM-low model has two more parameters of and against the host-only model, and is significant by the chance probability of 0.0042 or from the statistics of two degrees of freedom. This result again indicates that the host-only model is disfavored at level. On the other hand, the difference between the two IGM models is not statistically significant (1.4), and hence we cannot strongly reject the IGM- model. The total value of the model with is 76.62, corresponding to a modest chance probability of 10.0% for 62 degrees of freedom.
The best-fit host-only and IGM-low models are shown in Fig. 1 compared with the observed flux. To understand these results qualitatively, we also show the flux attenuation factor by various components of absorption in Fig. 2. The key point is that the IGM absorption signature (especially with smaller ) has a weaker wavelength dependence than that by hydrogen in the host, which is essential to resolve the curvature found in the residual spectrum of the host-only fit.
Another possibility to improve the host-only fit is a DLA rather than diffuse IGM. Therefore we test the intervening DLA model, in which the DLA component at the redshift of the observed metal absorption system () is added to the host-only model, but without including diffuse IGM. The results are presented in Figs. 2, 4, and Table 2. It is found that this model gives a similarly good fit to the IGM-low model, if the H\emissiontypeI column density is , which is about 10 times larger than in the GRB host. We will further examine whether this intervening DLA model is consistent with other spectral features in Section 5.
4 Examinations of Systematic Uncertainties
4.1 Systematics in the Spectrum Reduction
The discrepancy between the host-only model and the observed data is mainly because of the concave curvature of the data compared with the best-fit model curve, extending in the entire wavelength range analyzed (8400-8900 Å) with an amplitude of 0.6% of the continuum flux (Fig. 4). As mentioned above, the sensitivity curve fit to the standard star is accurate by 0.1% level, and the 0.6% level difference of the spectral shape should be detectable.
To further test possible systematic uncertainties in the relative flux calibration, we constructed another sensitivity curve by using another CALSPEC standard star GD 153, which is one of the primary standards of the CALSPEC system and was observed by Subaru one day before the observation of GRB 130606A. The airmass at the time of taking the VPH900 spectrum of GRB 130606A is in between those for the two standard stars (Feige 34 and GD 153). The shapes of the two sensitivity curves are consistent within 0.2% accuracy, indicating that the observed spectral shape is correct at 0.2% level, taking into account the variation of the standard star templates, airmass, and atmospheric/instrumental conditions over the time scale of one day. The primary standards of the CALSPEC calibration system are the model spectra of the three pure hydrogen white dwarfs including GD 153 (Bohlin 2007), and the model spectra have a smooth power-law profile in 8400–8900 Å, showing no complicated absorption structures. Residuals of the HST data from the model spectra indicate that a curvature of 0.6% level in 8400–8900 Å is highly unlikely to be a result of the uncertainty about the CALSPEC template (see Fig. 3 of Bohlin 2007).
In the wavelength range III, a broad enhancement of the spectral noise is seen, which is a feature by the atmospheric O2 emission lines. If the spectrum is systematically biased by this effect, it would have an important effect on our fitting result, because the deviation of the data from the host-only model is the largest in this range. To check this we examined the fit residuals of the Subaru data for the standard star with respect to the sensitivity curve fit, and there is no systematic excess in this region. The noise level is decreasing to larger wavelength within the range III, but the fit residuals of the host-only model in Fig. 4 do not show any systematic wavelength dependence in this range. The concave curvature of the residuals ranging in the wide range of 8400–8900 Å cannot be resolved only by the O2 feature in the range III.
We examined the atmospheric absorptions in 8500–8900 Å using the ATRAN database (http://atran.sofia.usra.edu/), and found that the expected curvature produced by weak atmospheric absorption lines is about 0.1% in this wavelength range. It should be noted that the effect of atmospheric absorption should have been corrected if the effect is the same for the standard star and the GRB afterglow. Although a part of this effect may remain uncorrected by a possible systematic change of atmospheric conditions at the observing times for the star and the afterglow, it is impossible to explain the 0.6% level curvature of the host-only fit residuals.
We also examined the effect of slit/aperture loss of afterglow light. The slit loss of light changes the relative flux of the spectrum by the atmospheric dispersion effect, but we confirmed that this is less than 0.05% within the wavelength range analyzed. We found that the image size along the spatial direction changes with wavelength, which is likely due to wavelength dependent seeing and/or chromatic aberration. Therefore we quantitatively examined the systematic change of the spectrum by aperture loss. (The aperture size for the GRB spectra is smaller than that for the standard star.) We found that this changes the relative flux at 8400 and 8900 Å by 2.6%, but the wavelength dependence is monotonic and well described by a power-law, having an effect of changing by 0.45. The analyzed spectrum has been corrected about this before the model fittings, and hence correction for this effect is not necessary for the values presented in this paper. Since this effect is well described by a power-law, it is unlikely to be the origin of the residuals showing a curvature.
4.2 Systematics in Modelings and Fitting Procedures
We have removed the wavelength regions showing visually discernible absorption features from our analysis, but weaker absorption lines may affect the fit results. Since it is difficult to test the effect of weak lines that cannot be recognized, we instead performed the fittings including the four relatively weak absorption features at 8492, 8505, 8824, and 8889 Å, which were removed in our baseline analysis. Some of these may be statistical fluctuation rather than real lines. The best-fit values for the host-only and IGM- models are now 134.69 and 123.11 for 69 data points, and the preference for the IGM model () is not significantly changed. We also tested possible systematic effects induced by large noise in the regions of atmospheric airglow lines. We repeated the fittings after removing the narrow airglow regions centered at 8435, 8455, 8495, 8505, 8542, 8552, 8830, 8840, 8852, 8870, and 8888 Å. (These regions can be seen as bumps in the error curve shown in Fig. 1.) The values of the two models are 60.17 and 51.73 for 45 data points, and is still significant at 2.9.
We used the central redshift of for the H\emissiontypeI gas in the GRB host, based on the redshifts of the metal absorption lines measured in the same spectrum. The C\emissiontypeII line shows a relatively low redshift of , and the uncertainty about the host redshift can be tested by adopting this value for . We then found the best-fit values of 86.13 and 79.30 for the host-only and IGM- models, respectively, and is still significant at 2.6.
We considered only a single power-law for the intrinsic afterglow spectrum before absorption effects, though afterglows sometimes show concave breaks in their spectral energy distribution (SED), which may explain the curvature found in the residuals of the host-only fit. However, if a spectral break is close to the observed wavelength range, we expect from the afterglow theory a significant time evolution of SED by the passage of the break in an observing band (Zhang 2007). As shown in Fig. 3, the reported near-infrared colors are fairly constant from 36 min to 35 hr after the burst, and no evidence for spectral breaks other than the Ly break is seen. If the 0.6% curvature in 8400–8900 Å is represented by a quadratic term in the versus relation, it would result in a change of by just a 7% change of wavelength . Such a strong break is not expected from the afterglow theory (Zhang 2007), and inconsistent with the agreement of for our fits and near-infrared colors.
Since GRB afterglows are time-variable, we also examined the time variability of the reduced spectrum, by reproducing two spectra using the first and second halves of the integrations (1–4 and 5–9 of Table 1). We confirmed that there is no statistically significant change in the spectra, and the concave curvature of the residuals for the host-only model is seen in both the spectra.
4.3 Comparison with A Previous Study
Chornock et al. (2013) also reported an analysis of the damping wing shape of the same GRB afterglow taken by another telescope, and they found no statistically significant preference for the diffuse IGM component. This result is apparently different from ours, although their upper limit ( at ) is consistent with our best-fit of for the IGM- model. The origin of this difference is difficult to identify, but a clear difference of their analysis from ours is the index of unabsorbed power-law spectrum: , i.e., . Such a small value is significantly different from those measured by near-infrared colors, and it is not supported either from our -free fitting analysis, giving an unacceptably large of . The fit by Chornock et al. indeed shows a concave curvature of the observed spectrum compared with the fitted model (see their Fig. 2), and this curvature and their small (red) value could be a result of a power-law fit in a wavelength region where the IGM/DLA component is not negligible.
5 Examination of the Intervening DLA Scenario
As already presented, the evidence for the intervening H\emissiontypeI absorption presented above can be explained by a DLA associated with the observed metal absorption system at , if the H\emissiontypeI column density is . Here we examine whether this scenario is consistent with other observed features of the GRB 130606A afterglow spectrum.
5.1 Expected Number of DLAs Along the Sightline
The expected number of such a DLA along the line of sight can be estimated as follows. A modest extrapolation of the DLA statistics up to (Wolfe et al. 2005; Songaila & Cowie 2010) suggests the DLA number distribution per unit redshift at for . Assuming the column density distribution as again from the lower- sample, the probability of finding such a DLA in the redshift range between 5.806 and 5.913 is estimated to be . Therefore the chance probability of finding such a DLA is rather small, though it is not negligible.
5.2 Lyman Series Absorption Features
The existence of such a large column DLA at can be further constrained by the spectral profiles around Lyman series absorption at this redshift, because absorption by H\emissiontypeI in the DLA would erase the transmission of light around this redshift. The spectrum around Ly, , and are shown in Fig. 6, with the expected absorption factor by the DLA having . Here, the velocity distribution of H\emissiontypeI in the DLA is modeled as follows. The profiles of the three metal absorption lines (Si\emissiontypeII, O\emissiontypeI, C\emissiontypeII) at this redshift are also shown in Fig. 6, and their widths are consistent with the spectral resolution (3.9 Å FWHM), indicating narrow intrinsic widths. The relative velocity difference of these lines are at most km/s. The metal absorption line profile of typical DLAs is a mixture of multiple components with a velocity width of –7 km/s for one component, and the relative velocity width of different components is widely distributed in 20–200 km/s (Wolfe et al. 2005; Dessauges-Zavadsky et al. 2003). Therefore, as a reasonable model, we adopt km/s for each single component and assumed that these components are uniformly distributed in the relative velocity range of to +20 km/s with respect to .
The light transmission around the Lyman series in Fig. 6 must be consistent with the predicted attenuation factor by the DLA, and the transmissions around Ly and satisfy this requirement, if the spectral resolution is taken into account. However, a large transmission flux centered at 6976.97 Å is found near Ly with an integrated flux of . This transmission profile has a width comparable with the spectral resolution, indicating a narrow intrinsic width. Furthermore, the light attenuation by the assumed DLA becomes rapidly stronger beyond 6977 Å, which also requires that the transmission is coming from a narrow ( 1 Å) wavelength window. This means that the transmission flux density must be Å-1, which should be compared with the unabsorbed continuum flux Å-1 estimated by the continuum flux at 9800 Å and an extrapolation by using the best-fit power-law of the intervening DLA model (Table 2). Here, these flux estimates of the transmission and unabsorbed continuum were made from the 300R spectrum that covers Ly and 9800 Å simultaneously, and hence we do not have to consider the time evolution of the flux.
This result means that the IGM transmission fraction must be larger than 1.6/3.6 = 0.44 at 6977 Å, but this is inconsistent with the transmission allowed by Ly absorption of the DLA that we are now considering, 0.180.05. Hence the particular case that the DLA at is responsible for the unexplained residuals of the host-only model is excluded. We examined possible systematic uncertainties about the relative flux calibration at 6977 and 9800 Å (by aperture loss, atmospheric dispersion, guide error, standard star, and wavelength-dependent seeing), and it should be less than 10%. A change of by 0.1 results in just a 3% change of the unabsorbed flux at the Ly wavelength. It should also be noted that the modeling about velocity distribution of H\emissiontypeI in the DLA hardly affects this argument, because the 6977 Å transmission is far from the resonant Ly wavelength and the attenuation is simply determined by the damping wing.
Therefore, the H\emissiontypeI column density of the system must be lower than the value required to explain the residual of the host-only model. If we assume that the system has a similar metallicity to the GRB host galaxy, a reasonable amount of the H\emissiontypeI column density would be , since the metal-line equivalent widths (Si\emissiontypeII, O\emissiontypeI, and C\emissiontypeII) of the system are about 3–9 times lower than those found in the GRB host galaxy (Chornock et al. 2013). Flux attenuation factors assuming this H\emissiontypeI column density are also plotted in Fig. 6, and in this case Ly absorption at 6977 Å is negligible, thus allowing the existence of the observed transmission there. Such a small H\emissiontypeI column density does not affect the fitting of the Ly damping wing at the GRB redshift.
Finally, we note that the simple diffuse IGM models with uniform is also mathematically excluded by the light transmission at 6977 Å, because of the large predicted Ly GP optical depth of at using the absorption oscillator strength ratio of . However, in reality the neutral fraction cannot be perfectly homogeneous, and many transmission spikes are expected at locally ionized bubbles along the sightlines, as seen in the spectrum of this GRB (Chornock et al. 2013). Therefore, a transmission spike at 6977 Å does not exclude any realistic models of diffuse IGM absorption.

5.3 Metallicities
Finally, even if the large column of is associated with the system, the metallicity of this system must then be extremely low. From the reported equivalent widths of the Si\emissiontypeII, O\emissiontypeI, and C\emissiontypeII lines (Chornock et al. 2013) and this H\emissiontypeI column, we estimate the metallicity of [Si/H], [O/H], and [C/H] to be , , and , respectively, in the optically-thin limit. Here we followed the usual practice for DLA studies and did not apply ionization correction, because these low-ionization atoms are the dominant phase of these elements in interstellar medium. These lines may be saturated, and hence we estimated the metal column density considering the saturation effect, assuming that these lines have a single component of km/s. Then the metallicities are increased to , , and , respectively. (Note that the saturation effect would be weaker than this, if these lines are composed of multiple components.)
The saturation effect is not large for the weak line of Si\emissiontypeII, and [Si/H] of this system must be significantly lower than the lowest value () found for DLAs at lower redshifts up to (Rafelski et al. 2012). In comparison with a theoretical model of Finlator et al. (2013), the saturation-corrected column density of for a DLA having at is outside the - distribution of 99% sightlines. We have already argued that the Ly profile excludes the particular case of the DLA at as an explanation of the residuals found in the host-only fit, and one may consider the possibility of a DLA at a different redshift to save the intervening DLA scenario. However, in this case the DLA metallicity must be further lower than the values estimated above, because there are no detected metal absorption lines.
6 Discussion and Conclusions
We presented an analysis of the redward Ly damping wing found in the optical afterglow spectrum of GRB 130606A at , for the purpose of getting constraints on cosmic reionization. We used the spectrum in the narrow wavelength range of 8400–8900 Å, which was specially reduced for the particular purpose of the damping wing analysis to minimize systematic uncertainties. The minimal model including the unabsorbed baseline power-law and H\emissiontypeI absorption in the host galaxy does not give a good fit, leaving residuals showing a concave curvature whose amplitude is about 0.6% of the flux. Such a curvature in the short wavelength range cannot be explained by extinction at the host galaxy, if we adopt the standard extinction curves, because the standard curves have monotonic wavelength dependence in this wavelength range, and change of extinction is almost perfectly absorbed by according change of the power-law index . We cannot exclude an unknown anomalous behavior of extinction curve in this wavelength range, but if this is the case, it would have interesting implications for the physics of interstellar dust grains in the early universe. We have also examined various sources of systematic uncertainties in the observed spectrum and model fitting procedures (Section 4), but we cannot resolve the residuals of the host-only model.
This motivated us to test intervening H\emissiontypeI absorption components along the line of sight, and we found that both diffuse IGM and a DLA at the redshift of an observed metal absorption system () can reduce the residual, with statistical significances of about 3. This is the first evidence for intervening neutral hydrogen outside the host galaxy, found in the red damping wing of GRB afterglow spectra.
We then examined the consistency of the DLA scenario with other observed features in the spectrum (Section 5). Probability of finding such a DLA along the sightline is rather small (3%). The particular case of the DLA can be excluded from the light transmission profile around Ly. The metallicity argument also severely constrains this scenario. Even if the DLA is associated with the metal absorption system, its silicon abundance must be about 1/2000 times the solar level, which is significantly lower than the lowest known metallicity () of DLAs at and theoretical expectation at . If the DLA is located at a redshift different from 5.806, no detected metal lines require an even lower metallicity. Therefore we conclude that the intervening DLA scenario does not provide a reasonable explanation for the residuals of the host-only model. If the DLA scenario was correct, it would imply a rapid increase of the incidence of extremely low metallicity DLAs around , which would give an interesting constraint on the theory of early galaxy formation.
Hence, there are good reasons to seriously consider the possibility that the observed absorption feature is made by neutral hydrogen in diffuse IGM. If correct, it can be interpreted as the remnant of neutral IGM at the relatively late phase of reionization. The best-fit IGM neutral fraction varies depending on the upper redshift bound, from for to for (the upper bound of the darkest GP troughs to this sightline). These values are interestingly close to unity, but quantitatively should be taken with care, because the adopted IGM model (uniform density and ) is obviously too simple (McQuinn et al. 2008; Mesinger & Furlanetto 2008). Ly transmission spikes are found between the dark GP troughs from to the GRB redshift (Chornock et al. 2013), and cannot be such a high value at the spike regions. On the other hand, theory predicts that reionization proceeds inhomogeneously (e.g., Iliev et al. 2006), and high gas can be hidden in clumpy IGM corresponding to dark GP troughs. A comparison with more realistic theoretical models would place more quantitative constraints on the reionization history.
It should be noted that the red damping wing signature of absorption by intervening neutral hydrogen has also been reported for a quasar at an even higher redshift of (Mortlock et al. 2011; Bolton et al. 2011), whose column density is similar to that found for GRB 130606A. Indirect evidence for the damping wing by highly neutral IGM has also been claimed in quasar spectra at (Schroeder et al. 2013). Since GRBs are less biased tracers and do not alter the surrounding ionization status, it is reasonable to expect a higher in regions around GRB host galaxies than quasars at the same redshift. These quasar results and the new result of GRB 130606A suggest that the cosmic reionization is not yet complete at , and we are now starting to detect the remnant neutral hydrogen from the universe before reionization in various environments.
Our result demonstrates that damping wing analyses of GRB afterglows give useful constraints on reionization. It is sensitive to the IGM neutral fraction of for H\emissiontypeI gas close to the host, or for that separated from the host by or 5 Mpc in proper distance. More high quality spectra of GRB afterglows in the reionization era would give us a more complete picture of reionization history in the near future, which will be made possible by planned 30–40m class telescopes.
The spectrum used in this work was collected at the Subaru Telescope, which is operated by the National Astronomical Observatory of Japan. This work, as well as the upgrade of Subaru/FOCAS in 2010, was financially supported by the MEXT Grant-in-Aid for Scientific Research on Priority Areas (19047003).
References
- [Afonso et al. (2013)] Afonso, P., et al. 2013, GRB Coordinates Network, 14807
- [Barkana et al. (2007)] Barkana, R., & Loeb, A. 2007, Rep. Prog. Phys., 70, 627
- [Boh (2007)] Bohlin, R.C. 2007, in The Future of Photometric, Spectrophotometric and Polarimetric Standardization, ASP Conference Series, Vol. 364, Proceedings of a conference held 8-11 May, 2006 in Blankenberge, Belgium. Edited by C. Sterken. San Francisco: Astronomical Society of the Pacific, 2007., p.315
- [Bol et al. (2011)] Bolton, J. S., et al. 2011, MNRAS, 416, L70
- [Bu et al. (2013a)] Butler, N., et al. 2013a, GRB Coordinates Network, 14799
- [Bu et al. (2013b)] Butler, N., et al. 2013b, GRB Coordinates Network, 14824
- [Ca et al. (2013a)] Castro-Tirado, A. J., et al. 2013a, GRB Coordinates Network, 14796
- [Ca et al. (2013b)] Castro-Tirado, A. J., et al. 2013b, arXiv:1312.5631
- [Ch et al. (2013)] Chornock, R., et al. 2013, ApJ, 774, 26
- [Cu et al. (2011)] Cucchiara, A., et al. 2011, ApJ, 736, 7
- [De et al. (2003)] Dessauges-Zavadsky, M., Proux, C., Kim, T. S., D’Odorico, S., & McMahon, R. G. 2003, MNRAS, 345, 447
- [Fan et al.(2006)] Fan, X., Carilli, C. L., & Keating, B. 2006, ARA&A, 44, 415
- [Fa et al. (2012)] Fan, X. 2012, Research in Astronomy and Astrophysics, 12, 865
- [Finlator et al.(2013)] Finlator, K., et al. 2013, MNRAS, 436, 1818
- [Fi et al. (1999)] Fitzpatrick, E. L. 1999, PASP, 111, 63
- [Golenetskii et al.(2013)] Golenetskii, S., et al. 2013, GRB Coordinates Network, 14808
- [Go et al. (2003)] Gordon, K. D., Clayton, G. C., Misselt, K. A., Landolt, A. U., & Wolff, M. J. 2003, ApJ, 594, 279
- [Gr et al. (2009)] Greiner, J., et al. 2009, ApJ, 693, 1610
- [Gunn & Peterson(1965)] Gunn, J. E., & Peterson, B. A. 1965, ApJ, 142, 1633
- [Il et al. (2006)] Iliev, I. T., et al. 2006, MNRAS, 369, 1625
- [Iy et al. (2004)] Iye, M., et al. 2004, PASJ, 56, 381
- [Ka et al. (2002)] Kashikawa, N., et al. 2002, PASJ, 54, 819
- [Ka et al. (2006)] Kawai, N., et al. 2006, Nature, 440, 184
- [Ko et al. (2011)] Komatsu, E., et al. 2011, ApJS, 192, 18.
- [La et al. (2000)] Lamb, D. Q., & Reichart, D. E. 2000, ApJ, 536, 1
- [Mc et al. (2008)] McQuinn, M., Lidz, A., Zaldarriaga, M., Hernquist, L., & Dutta, S. 2008, MNRAS, 388, 1101
- [Me et al. (2008)] Mesinger, A., & Furlanetto, S. R. 2008, MNRAS, 385, 1348
- [Me et al. (2010)] Mesinger, A. 2010, MNRAS, 407, 1328
- [Mi et al. (1998)] Miralda-Escude, J. 1998, ApJ, 501, 15.
- [Mo et al. (2013)] Morgan, A. 2013, GRB Coordinates Network, 14802
- [Mo et al. (2011)] Mortlock, D. J., et al. 2011, Nature, 474, 616
- [Na et al. (2013)] Nagayama, T., et al. 2013, GRB Coordinates Network, 14784
- [Pa et al. (2010)] Patel, M., Warren, S. J., Mortlock, D. J., & Fynbo, J. P. U. 2010, A&A, 512, L3.
- [Pe et al. (2007)] Peimbert, M., Luridiana, V., & Peimbert, A. 2007, ApJ, 666, 636
- [Pred et al. (1995)] Predehl, P., & Schmitt, J. H. M. M. 1995, A&A, 293, 889
- [Press et al. (2007)] Press, W.H., et al. 2007, Numerical Recipes 3rd Edition: The Art of Scientific Computing (Cambridge)
- [Ra et al. (2012)] Rafelski, M., Wolfe, A. M., Prochaska, J. X., Neeleman, M., & Mendez, A. J. 2012, ApJ, 755, 89
- [Ro et al. (2010)] Robertson, B. E., Ellis, R. S., Dunlop, J. S., McLure, R. J., & Stark, D. P. 2010, Nature, 468, 49
- [Sa et al. (2009)] Salvaterra, R., et al. 2009, Nature, 461, 1258
- [Schady et al.(2010)] Schady, P., et al. 2010, MNRAS, 401, 2773
- [Schlafly & Finkbeiner(2011)] Schlafly, E. F., & Finkbeiner, D. P. 2011, ApJ, 737, 103
- [Schr et al. (2013)] Schroeder, J., Mesinger, A., & Haiman, Z. 2013, MNRAS, 428, 3058
- [So et al. (2010)] Songaila, A., & Cowie, L. L. 2010, ApJ, 721, 1448–1466
- [Ta et al. (2009)] Tanvir, N. R., et al. 2009, Nature, 461, 1254
- [To et al. (2006)] Totani, T., et al. 2006, PASJ, 58, 485
- [Uk et al. (2013)] Ukwatta, T. N., et al. 2013, GRB Coordinates Network, 14781
- [Wo et al. (2005)] Wolfe, A. M., Gawiser, E., & Prochaska, J. X. 2005, ARA&A, 43, 861
- [Zh et al. (2007)] Zhang, B. 2007, Chinese Journal of Astronomy and Astrophysics, 7, 1