Sources of Pressure in Titan’s Plasma Environment
Abstract
In order to analyze varying plasma conditions upstream of Titan, we have combined a physical model of Saturn’s plasmadisk with a geometrical model of the oscillating current sheet. During modeled oscillation phases where Titan is furthest from the current sheet, the main sources of plasma pressure in the near-Titan space are the magnetic pressure and, for disturbed conditions, the hot plasma pressure. When Titan is at the center of the sheet, the main source is the dynamic pressure associated with Saturn’s cold, subcorotating plasma. Total pressure at Titan (dynamic plus thermal plus magnetic) typically increases by a factor of five as the current sheet center is approached. The predicted incident plasma flow direction deviates from the orbital plane of Titan by . These results suggest a correlation between the location of magnetic pressure maxima and the oscillation phase of the plasmasheet.
ACHILLEOS ET AL. \titlerunningheadTITAN PLASMA ENVIRONMENT \authoraddrN. Achilleos, Department of Physics and Astronomy, University College London, Gower Street, London WC1E 6BT, UK. (nicholas.achilleos@ucl.ac.uk)
1 Introduction
Titan is usually embedded within the rotating magnetosphere of Saturn - a configuration which leads to the formation of a ‘flow-induced’ magnetosphere, via the draping of the magnetic field in the subcorotating flow about the moon (Titan’s orbital speed of is small compared to the typical speed of the rotating plasma, ). Recently, [Bertucci et al. [2009]] demonstrated, using Cassini data, that the direction and magnitude of the magnetic field upstream of Titan varies, depending mainly on whether Titan is located above or below Saturn’s magnetospheric current sheet. Titan’s distance from the current sheet is influenced by global magnetospheric oscillations at Saturn, which change the elevation of this structure with respect to the rotational equatorial plane. The sheet geometry was modeled by [Arridge et al. [2011b]] (hereafter A11).
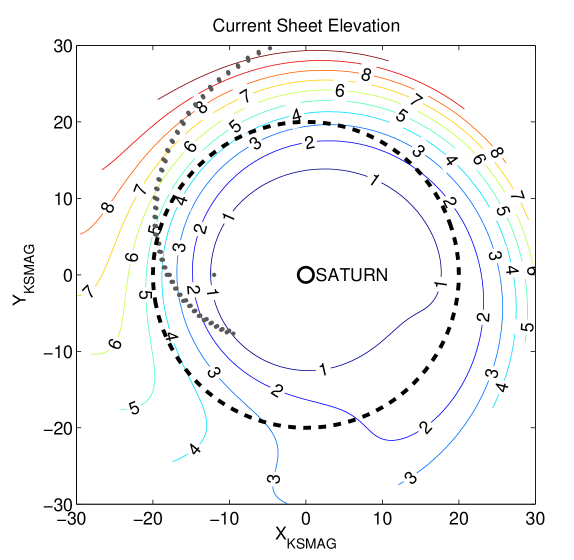
In Figure 1, we plot one example of current sheet elevation, , from this A11 model. For constant radial distance (e.g. along Titan’s orbit), will vary with azimuth - i.e. there is a ‘ripple’ in the sheet surface. For southern summer, is everywhere positive - hence, the azimuthally averaged surface forms a ‘bowl-like’ shape. We have combined the A11 model of sheet geometry with the Saturn plasmadisk model of [Achilleos et al. [2010a]] (hereafter Ach10) in order to predict the variable magnetic and plasma parameters during the T15 encounter of Titan by the Cassini spacecraft (closest approach occurred on July 2, 2006 at 09:21 UTC, at altitude ). This analysis enables us to predict the variations which arise from plasma sheet oscillations. In future, we aim to repeat the analysis for additional Titan encounters, and so provide a theoretical analog of observational classifications of the Titan environment, such as those of [Rymer et al. [2009]] and [Simon et al. [2010]]. We have also chosen T15 for the present analysis because we have obtained relevant plasma moment data which we compare with our model results herein.
In §2, we describe a combined model which employs the A11 current sheet geometry with the Ach10 magnetic field / plasma model. In section §3, we implement this model and compare it to observations of the magnetic field, magnetic pressure and hot plasma pressure for several magnetospheric oscillation periods centered on the T15 Titan flyby (hot plasma pressure refers to H+ and O+ ions with energies (Sergis et al., 2009)). We summarize and give conclusions in §4.
2 Plasmadisk Model Description
For this study, we require a ‘two-component’ model of Saturn’s plasmadisk. The first component is the A11 geometrical model of the current sheet, illustrated in Figure 1. For cylindrical radial distance exceeding , the altitude of the current sheet (with respect to Saturn’s rotational equator) is given by A11:
| (1) |
where the first term represents the axisymmetric bowl and the second term the spatial oscillation, or ripple. Symbols have the following meanings: is cylindrical radial distance with respect to the planet’s rotational / magnetic axis, is the hinging distance which controls the curvature of the bowl, is the subsolar latitude at Saturn, is an effective angle of tilt for the current sheet, is a scaling distance which controls the amplitude of the ripple. represents the following phase angle for describing plasma sheet oscillation, dependent on both position and time:
| (2) |
where SLS3 denotes the longitude of Kurth et al. (2008), based on fitting a low-order polynomial to the non-stationary period of the Saturn Kilometric Radiation (SKR). Since SLS3 was developed, distinct SKR signals have been identified in Saturn’s northern and southern hemisphere (e.g. Lamy (2011)) - the SLS3 phase lies consistently within of that of the southern SKR source (Andrews et al., 2010). denotes a ‘prime meridian’ parameter, fitted by A11 to different passes of Cassini data. is a variable angular velocity corresponding to the SLS3 period. is a ‘wave speed’ parameter which introduces a systematic delay of the oscillation phase with radial distance (see Figure 1). The T15 Titan encounter occurred during Cassini’s Revolution 25. We thus adopt the same sheet parameters as used by A11 for their Rev 25 model fit, namely , , , , .
The second component of our plasmadisk model specifies magnetic field and plasma distributions for an axisymmetric magnetosphere in which magnetic force, centrifugal force and plasma pressure forces are in equilibrium (Ach10). This model also assumes north-south symmetry, with a current sheet lying in the rotational equator. Any plasma parameter is a function of two coordinates, labeled and , the respective cylindrical radial distance and altitude (with respect to the rotational equator) in the ‘Ach10 model space’. In order to combine the Ach10 model with the A11 sheet geometry, we calculate ‘equivalent Ach10 model coordinates’ corresponding to the spacecraft’s actual location:
| (3) |
where is the spacecraft’s actual cylindrical radial distance from the planet’s rotation / dipole axis, and are the respective altitudes of the spacecraft and the A11 current sheet with respect to the rotational equator, is a unit vector pointing in the northern direction of the planet’s axis, and is the unit vector normal to the A11 current sheet at the distance . These expressions assume that the local structure of the plasmadisk (at Cassini) may be approximated by a version of the Ach10 model, whose plane of symmetry has been rotated to match the local tangent plane of the A11 sheet.
3 Comparison of Plasmadisk Models and T15 Observations
In Figure 2, we show the observed and modeled components of the magnetic field in cylindrical coordinates. The two Ach10 model parameters explored, in order to fit the data, are the effective magnetodisk radius and a proxy for the ring current activity which makes use of the global hot plasma pressure, based on multi-orbit statistics of the pressure moments from the Cassini Magnetospheric Imaging Instrument (MIMI) instrument (see Achilleos et al. (2010b); Sergis et al. (2007)). The fit shown is for and average ring current (equivalent to hot plasma pressure at Titan’s orbit). The r.m.s. difference between the data and model (summed over radial and azimuthal components, for the time interval plotted) changes by for corresponding changes and . We show several magnetospheric oscillations. The fits to the amplitude and phase of the (radial) and (azimuthal) fields are reasonable, although: (i) Earlier data show a change in sign, indicative of passage north of the current sheet plane, which is not reproduced with the model; (ii) The fluctuations show a much steeper ‘rising’ part compared to the model, suggesting that the plasmasheet ripple exhibits structure more complex than a sinusoidal form (equation 1). The model is almost in antiphase with the observation, also suggesting additional plasmasheet structure beyond our ‘wavy disk’ model (e.g. a rotating azimuthal anomaly in hot pressure has been proposed by Brandt et al. (2010)).
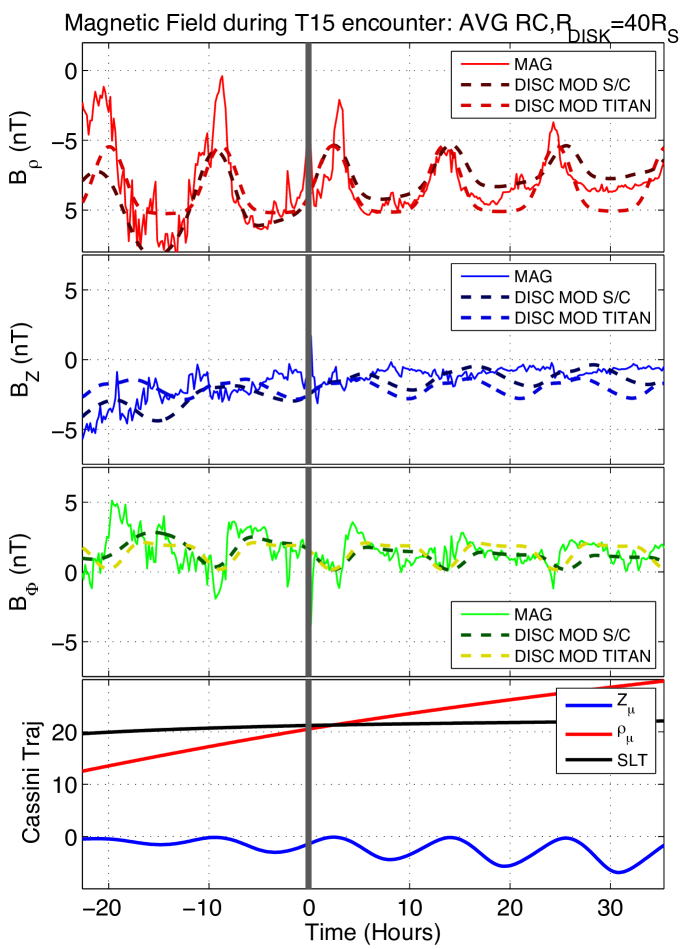
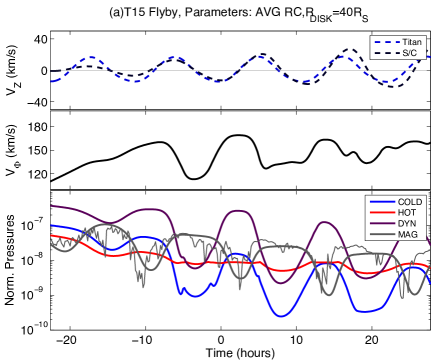
In Figure 3a, we show model plasma parameters corresponding to the field model of Figure 2. The vertical velocity of the plasmasheet is similar for Titan and Cassini reference frames near closest approach, with values up to . Similar vertical velocities were measured by the Cassini plasma spectrometer (CAPS) during the T15 flyby (Sillanpää et al., 2011). The azimuthal velocity of the cold plasma, lying on field lines conjugate with the spacecraft, is shown in the middle panel. The largest northward excursions of the plasmasheet (zero-crossing points which occur after the positive maxima in ) are accompanied by decreases in as the spacecraft moves away from the current sheet, and connects to flux tubes extending to larger radial distances, which rotate more slowly. Note that for the interval shown, combined with the for the Titan frame, indicate that the upstream plasma flow direction is tilted with respect to the rotational equator by angles . The location of maximum magnetic pressure along draped flux tubes would also be expected to deviate from the rotational equator, for appropriate oscillation phases.
The observed magnetic field is dominantly radial outside the current sheet. The maximum value of for the interval shown is , which also equals the maximum ratio for the convective electric field (see Arridge et al. (2011a) for more details).
In the bottom panel of Figure 3a, we show the contributions to plasma pressure from various sources. The maximum pressure during current sheet encounters is provided by the dynamic pressure of the cold, subcorotating plasma (violet curve). In the exterior regions or ‘lobes’ of the sheet, magnetic pressure shows local maxima and is the dominant pressure source for this average-ring-current model. The amplitudes and phasing of the observed fluctuations in magnetic pressure (thin gray curve) are in reasonable agreement with the model - although the narrower observed minima suggest a thinner sheet. The hot plasma pressure (red curve) shows relatively weak fluctuations compared to the other curves, since we assume that the hot population has uniform pressure all the way along the field lines. The blue curve indicates thermal pressure of the cold plasma. The total effective pressure predicted by the model (i.e. dynamic plus thermal plus magnetic) typically increases by a factor of approximately five as the current sheet center is approached. This change is mainly due to the variability in dynamic pressure between the sheet center and lobes (the relative change in pressure becomes if dynamic pressure is excluded).
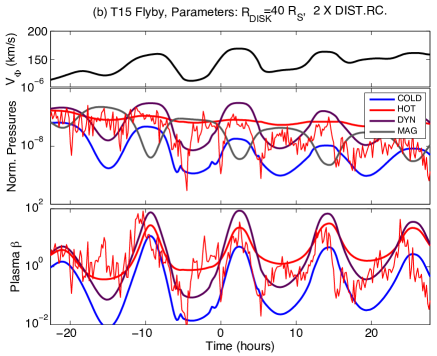
In Figure 3b, we compare observed and modeled hot plasma pressure. The global profile of hot plasma pressure was increased to twice the value for the ‘disturbed ring current’ of A10. Comparing the red curves (middle panel), the observed hot plasma pressure outside the current sheet (local maximum in magnetic pressure) is in agreement with the model. The data show additional variability in hot pressure, due to plasma injections and ion beams, which are not explicitly modeled. This disturbed-ring-current model, in comparison to the average-ring-current case (Figure 3b), shows more comparable values of magnetic and hot pressure in the lobes of the sheet.
The bottom panel of Figure 3b shows model plasma beta parameters, and the observed hot plasma beta from the Cassini data. The model hot plasma beta () varies between , while the observed reaches values as low as . A ‘pseudo’ plasma beta may be defined for the dynamic pressure (Ach10) according to , where subscripts indicate dynamic and magnetic pressures. shows local maximum values comparable to those for . The thermal cold plasma beta, , shows the lowest values, down to of . The ratio has similar minimum values, since the bulk kinetic energy of the cold plasma ions far exceeds their thermal energy.
4 Conclusions
We have calculated a plasmadisk model for conditions at the orbit of Titan during the T15 encounter by Cassini. Our model reproduces some of the large-scale variability in the observed magnetic field, although more complex structure for the ripple in the current sheet is required for better agreement. The model outputs are in reasonable agreement with the Cassini observations of magnetic pressure and hot plasma pressure.
For magnetospheric oscillation phases where Titan is furthest from the current sheet, the field is strongly radial and the dominant source of pressure is the dynamic pressure of the subcorotating, cold plasma. For phases where Titan is near the center of the sheet, the dominant pressure sources are the magnetic and hot plasma pressures (the latter being prevalent for the disturbed ring current of T15). Magnetospheric oscillations also control changes in vertical and azimuthal velocities of the cold plasma for a Titan-based observer. In our model, the incident direction of cold plasma flow may be displaced from Titan’s orbital plane by angles of the order . This result is in good agreement with observations of the plasma flow velocity by Sillanpää et al. (2011).
Finally, the plasmadisk oscillations lead to a wide range of plasma beta regimes in which Titan may be immersed. The hot plasma beta may be as high as for phases when Titan is at the center of the disk. The cold plasma beta is lower by factors of . A ‘pseudo’ plasma beta associated with the cold plasma bulk rotation (dynamic pressure) exceeds even the hot plasma beta near the disk center.
This variability in plasma conditions presents a complex requirement for upstream boundary conditions, such as those used in more sophisticated MHD models of the plasma flow. Our model is also useful for predicting plasma moments, when observations of these are scarce, or when only magnetic observations are available.
Acknowledgements.
We acknowledge the continued collaboration of the Cassini magnetometer (MAG) and plasma (CAPS, MIMI) instrument teams. NA was supported by both a JAXA Visiting Professorship and UK STFC Consolidated Grant ST/J001511/1 (UCL Astrophysics). CB acknowledges the financial support of the Europlanet Visiting Researcher programme.References
- Achilleos et al. [2010a] Achilleos, N., P. Guio, and C. S. Arridge, A model of force balance in Saturn’s magnetodisc, MNRAS, 401, 2349–2371, 10.1111/j.1365-2966.2009.15865.x, 2010a.
- Achilleos et al. [2010b] Achilleos, N., P. Guio, C. S. Arridge, N. Sergis, R. J. Wilson, M. F. Thomsen, and A. J. Coates, Influence of hot plasma pressure on the global structure of Saturn’s magnetodisk, Geophys. Res. Lett., 37, L20201, 10.1029/2010GL045159, 2010b.
- Andrews et al. [2010] Andrews, D. J., A. J. Coates, S. W. H. Cowley, M. K. Dougherty, L. Lamy, G. Provan, and P. Zarka, Magnetospheric period oscillations at Saturn: Comparison of equatorial and high-latitude magnetic field periods with north and south Saturn kilometric radiation periods, Journal of Geophysical Research (Space Physics), 115(A14), A12252, 10.1029/2010JA015666, 2010.
- Arridge et al. [2011a] Arridge, C. S., N. Achilleos, and P. Guio, Electric field variability and classifications of Titan’s magnetoplasma environment, Annales Geophysicae, 29, 1253–1258, 10.5194/angeo-29-1253-2011, 2011a.
- Arridge et al. [2011b] Arridge, C. S., et al., Periodic motion of Saturn’s nightside plasma sheet, J. Geophys. Res., 116(A15), A11205, 10.1029/2011JA016827, 2011b.
- Bertucci et al. [2009] Bertucci, C., B. Sinclair, N. Achilleos, P. Hunt, M. K. Dougherty, and C. S. Arridge, The variability of Titan’s magnetic environment, Planet. Space Sci., 57, 1813–1820, 10.1016/j.pss.2009.02.009, 2009.
- Brandt et al. [2010] Brandt, P. C., et al., Saturn’s periodic magnetic field perturbations caused by a rotating partial ring current, Geophys. Res. Lett., 37, L22103, 10.1029/2010GL045285, 2010.
- Kurth et al. [2008] Kurth, W. S., T. F. Averkamp, et al., An update to a Saturnian longitude system based on kilometric radio emissions, J. Geophys. Res., 113, A05,222, 2008.
- Lamy [2011] Lamy, L., Variability of southern and northern periodicities of Saturn Kilometric Radiation, Planetary, Solar and Heliospheric Radio Emissions (PRE VII), pp. 38–50, 2011.
- Rymer et al. [2009] Rymer, A. M., H. T. Smith, A. Wellbrock, A. J. Coates, and D. T. Young, Discrete classification and electron energy spectra of Titan’s varied magnetospheric environment, Geophys. Res. Lett., 36, L15109, 10.1029/2009GL039427, 2009.
- Sergis et al. [2007] Sergis, N., S. M. Krimigis, D. G. Mitchell, D. C. Hamilton, N. Krupp, B. M. Mauk, E. C. Roelof, and M. Dougherty, Ring current at Saturn: Energetic particle pressure in Saturn’s equatorial magnetosphere measured with Cassini/MIMI, Geophys. Res. Lett., 34, L09,102, 10.1029/2006GL029223, 2007.
- Sergis et al. [2009] Sergis, N., S. M. Krimigis, D. G. Mitchell, D. C. Hamilton, N. Krupp, B. H. Mauk, E. C. Roelof, and M. K. Dougherty, Energetic particle pressure in Saturn’s magnetosphere measured with the Magnetospheric Imaging Instrument on Cassini, J. Geophys. Res., 114(A13), A02,214, 10.1029/2008JA013774, 2009.
- Sillanpää et al. [2011] Sillanpää, I., et al., Cassini Plasma Spectrometer and hybrid model study on Titan’s interaction: Effect of oxygen ions, Journal of Geophysical Research (Space Physics), 116, A07223, 10.1029/2011JA016443, 2011.
- Simon et al. [2010] Simon, S., A. Wennmacher, F. M. Neubauer, C. L. Bertucci, H. Kriegel, J. Saur, C. T. Russell, and M. K. Dougherty, Titan’s highly dynamic magnetic environment: A systematic survey of Cassini magnetometer observations from flybys TA-T62, Planet. Space Sci., 58, 1230–1251, 10.1016/j.pss.2010.04.021, 2010.