Possible chromospheric activity cycles in AD Leo
Abstract
AD Leo (GJ 388) is an active dM3 flare star extensively observed both in the quiescent and flaring states.
Since this active star is near the fully-convective boundary, to study in detail its long-term chromospheric activity could be an appreciable contribution for the dynamo theory. Here, we analyze with the Lomb-Scargle periodogram the Ca II K line-core fluxes derived from CASLEO spectra obtained between 2001 and 2013 and the V magnitude from the ASAS database between 2004 and 2010. From both totally independent time-series, we obtain a possible activity cycle of period years and a less-significant shorter one of years. A tentative interpretation is that a dynamo operating near the surface could be generating the longer cycle, while a second dynamo operating in the deep convection zone could be responsible for the shorter one.
Based on the long duration of our observing program at CASLEO and the fact that we observe simultaneously different spectral features, we also analyze the relation between simultaneous measurements of the Na I index (), H and Ca II K fluxes at different activity levels of AD Leo, including flares.
Object:GJ 388 (catalog ) Facilities: ASAS.
1 Introduction
Activity cycles like the one observed in the Sun have been detected in several late-type stars (e.g. Baliunas et al. 1995; Buccino & Mauas 2008). The usually accepted model to describe the generation and intensification of magnetic fields in these stars is the -dynamo first invoked to explain solar activity (Parker, 1955) and, thoroughly improved and extended from F- to early-M stars (e.g. Robinson & Durney 1982; Saar & Brandenburg 1999; Lorente & Montesinos 2005). These dynamo models are based on the interaction between differential rotation (-effect) and convective turbulence (-effect) in the tachocline.
Cool stars with masses lower than about are believed to be fully-convective (Chabrier & Baraffe, 1997). Therefore, they do not possess a tachocline and could not support an dynamo. Nevertheless, there is plenty of observational evidence that slow late-type rotators like dMe stars are very active and have strong magnetic fields (Hawley 1989; West et al. 2004; Reiners & Basri 2007). Chabrier & Küker (2006) proposed that a pure -dynamo could generate large-scale magnetic fields in fully-convective stars. Moreover, the 3-D dynamo model developed by Browning (2008) for M dwarfs reveals that fully-convective stars can generate kG-strength magnetic fields without the aid of a shearing tachocline.
To determine whether there is an onset of cyclic activity near the convective limit, it is of special interest to study the long-term chromospheric activity in stars of different spectral types, and in particular in middle-M stars. As a contribution to this subject, since 1999 we have developed the HK Project, an observing program dedicated to periodically obtain mid-resolution echelle spectra of southern late-type stars, including fully-convective ones. From our data, we found evidences of cyclic activity for the fully-convective M5.5Ve star Proxima Centauri (Cincunegui et al., 2007b), for the mid-M spectroscopic binary GJ 375 (Díaz et al., 2007b) and the two early-M stars GJ 229 A and GJ 752 A (Buccino et al., 2011). Similarly, Gomes da Silva et al. (2012) studied a sample of stars from the HARPS program and found that the long-term activity of 8 early-M stars can be fitted by a sinusoidal signal.
One of the most observed stars of our sample is AD Leo (GJ 388), which is a M3Ve star (Henry et al., 1994), well-know for its frequent (Pettersen et al., 1984; Crespo-Chacón et al., 2006) and strong flares (e. g. Hawley & Pettersen 1991). Flares in AD Leo have been observed and studied in the optical, EUV and X-ray (e.g. Hawley et al. 1995; Mauas & Falchi 1996; Favata et al. 2000; Hawley et al. 2003; Güdel et al. 2003). Recently, Hunt-Walker et al. (2012) obtained a rotational period days for this star. AD leo is a partially-convective star of mass (Favata et al., 2000). Morin et al. (2008) found that AD Leo hosts a magnetic field with similar properties to several fully-convective stars. Although it has been extensively observed both in the quiescent and flaring states, most analysis of the chromospheric activity in AD Leo are related to its short-term variability. Only Pettersen et al. (1986) reported long-term variations in its flare frequency and suggest a cycle in flaring activity.
This active fast-rotator star is an interesting target to explore the dynamo around the threshold for full convection. Here we present a detailed study of its long-term chromospheric activity. We delineate in §2 the main characteristics of the HK Project and the ASAS program. In section §3 we report our results, we analyze of the CASLEO activity indicators and the long-term magnetic activity derived from CASLEO data and the ASAS database. Finally, we discuss our results in the context of the dynamo theory.
2 Observations
To study the long-term chromospheric activity in late-type stars, in 1999 we started the HK Project. In this program, we systematically obtain mid-resolution echelle spectra () of several late-type stars. Our observations are made at the 2.15 m telescope of the Complejo Astronómico El Leoncito (CASLEO), in San Juan, Argentina. Specific details of the observations and the method used to calibrate the spectra is described in Cincunegui & Mauas (2004).
Our stellar sample was chosen to cover the spectral range from F to M, with different activity levels. In particular, we included a large number of M stars to study the transition to the completely convective regime. Most of the stars are single dwarfs, although we also include several binaries and a few subgiants. At present, we have about 5500 spectra of 150 stars.
The standard activity indicator used in dF to dK stars is the Mount Wilson index, essentially the ratio of the Ca II H and K line-core fluxes to the continuum nearby. However, as explained in detail in Buccino et al. (2011), it is not suitable to study the chromospheric activity on AD Leo. Following our previous works (Díaz et al., 2007b; Buccino et al., 2011), we use as a proxy of stellar activity the Ca II K line-core flux, integrated with a triangular profile of 1.09 Å FWHM centered in 3933.66 Å (Cincunegui et al., 2007a).
We complement our data with photometry from the All Sky Automated Survey111http://www.astrouw.edu.pl/asas/ (ASAS). The ASAS program systematicallyobserves around 107 stars brighter than V=14, simultaneously in the V and I bands. Here we use the V magnitude to analyze the long-term activity of AD Leo.
3 Results
3.1 Chromospheric activity cycles
In Table 1 we show the observation logs of AD Leo at CASLEO. There is a total of 38 individual observations, which have been carried out on 19 nights distributed over 12 years between March 2001 and March 2013. Our observations consist of two successive spectra, to eliminate cosmic rays. Observation times are between 30 and 60 minutes.
Crespo-Chacón et al. (2006) observed a large number of short and weak flares occurring very frequently (flare activity h-1), which can mask the variations of activity due to the cycle. Therefore, before exploring the existence of an activity cycle in this star, we filter out any flares from our observations. We do it by visual inspection of the observations, since during flares the line fluxes in the two succesive spectra are very different. We excluded these flaring spectra, which are indicated in Table 1 with a “”, from the rest of the analysis.
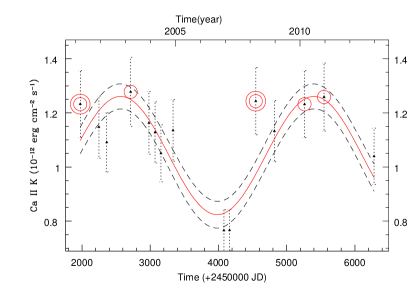
For the non-flaring CASLEO spectra, we calculated a nightly average of the Ca II K fluxes. We plot the resulting time-series of these activity indicators in Fig. 1(a). In this figure we observe that AD Leo reaches the minimum of activity (40% lower than at the maximum) at the year 2007.
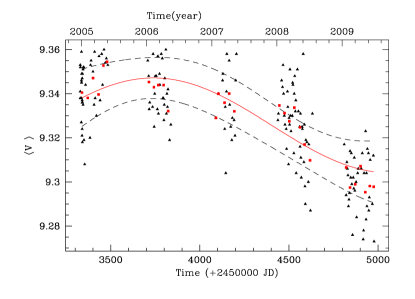
On the other hand, we obtained the V magnitude of AD Leo from the ASAS catalog for the period between 2004 and 2010. We only included the best quality data (see Buccino et al. 2011) and we discarded 14 outlier observations. In Fig. 1(b) we plot the resulting time-series, which consists of 175 points. Typical errors are around 30 mmag. The mean magnitude of the whole dataset is around . We also look for evidence of rotational modulation due to spots and active regions on the stellar surface, probably responsible for the short-scale variations (0.5%). To do so, we analyzed the data of each observing season with the Lomb-Scargle periodogram (Horne & Baliunas, 1986). Nevertheless, we did not detect any significant periodicity in the ASAS seasonal datasets; probably due to the low-precision of the ASAS photometry.
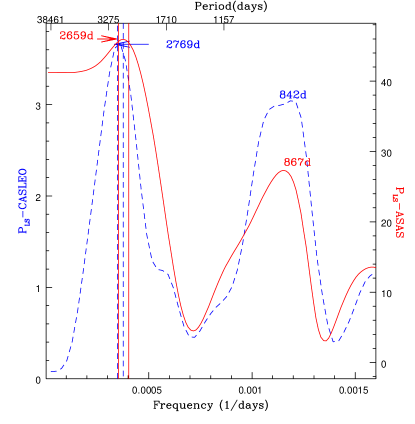
To search for long-term chromospheric activity cycles, we first analyzed both independent datasets with the Lomb-Scargle periodogram. The False Alarm Probability (FAP) of the periods obtained were computed with a Monte Carlo simulation, described in Buccino & Mauas (2009). The periodogram obtained for the CASLEO data is plotted in Fig. 2(a) with a dashed line. It shows a primary periodicity in the Ca II K fluxes with a period days with FAP=8%, and a second, less significant, harmonic component with period days with FAP=30%. To analyze the robustness of our results, we computed the periodograms of the series obtained by eliminating each data point alternatively. In 11 of 14 periodograms we obtained between 2593 and 2982 days with FAPs30% (73% of them were days) and a secondary peak between 843 and 931 days with larger FAPs.
To investigate whether the 842-day period is a subharmonic frequency of the prominent peak, we used the monthly sunspot numbers () taken from the National Geophysical Data Center222 http://www.ngdc.noaa.gov/stp/solar/ssndata.html to take into account that activity does not follow a strictly sinusoidal law. We used between 1751 and 2012 and rescaled the series in time to the period days (7.58 years). We also rescaled the to obtain a time series of the same mean value and standard deviation as our data. To consider data with the same signal-to-noise as ours, we added Gaussian noise with errors of 10% at each point. We took 1000 samples of these data with random starting dates and the same phase intervals that we have in our data and we computed the periodograms. As expected, 55% of the most significant periods detected in each periodogram appart from days in less than 10%. On the other hand, only 0.3% are between 671 and 1007 days (842 days ). Therefore, we can conclude that the peak at days (2.3 years) is not an artifact. We also performed a similar analysis on a sinusoidal function of period 2769 days with 10%-Gaussian noise. While 82% of the periods detected are 2769 days (10%), periods near were not detected. This analysis confirms that this secondary peak is not due to aliasing.
In Fig. 2(a) we show the periodogram for the ASAS time series. We obtained prominent peaks at days (FAP) and days (FAP). Since the ASAS data timespan is only 4.5 years, periods longer than are also potentially significant, as indicated by high periodogram power (Fig. 2(a)). The large number of points of this series are responsible for these extremely low FAPs (see Horne & Baliunas 1986, Eq. 22). To check that these periods are significantly independent of the data dimension, we reduce the number of points by binning the data. We computed the monthly mean V magnitude (i.e. averaging on timescales much longer than ), weighted by the error reported in the ASAS database, and we computed the error of each mean magnitude as the square root of the variance-weighted mean (see Frodesen et al. 1979, Eq. 9.12). For this series we detected a period days, with a FAP=. Since we smoothed the data plotted in Fig. 1(b), the secondary period near 900 days is much less significant (FAP=5%) in this periodogram.
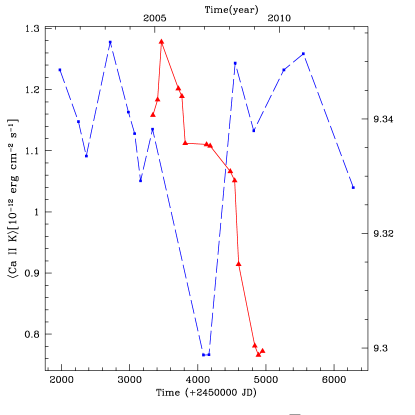
The Ca II K fluxes and the mean quarterly magnitudes are plotted together in Fig. 2(b). Contrary to the Sun, we observe that spots dominate the emission in AD Leo as it becomes fainter when the Ca II emission increases. On the other hand, there is an evident timelag between both chromospheric series. Both datasets coincide within the normalization constant with a correlation coefficient R=0.95, if we shift the photometry by 770 days.
Gray & Baliunas (1995) and Gray et al. (1996a, b) have already observed this timelag between photometric and magnetic variations for stars of different spectral types (G0V-K2V). Gray et al. (1996a) showed that, when different stars are compared, this timelag is anti-correlated with effective temperature. However, the Sun does not fit this relation (Gray & Livingston, 1997). Furthermore, here we find that AD Leo does not follow this trend, similarly to what we found for other M-stars (Díaz et al., 2007b; Buccino et al., 2011). The physical explanation for these timelags remains unknown (Brown et al., 2008).
3.2 H and Na I D lines as activity indicators
Due both to their red color and faint intrinsical luminosity, it is quite difficult to observe the Ca II lines in dM stars with adequate signal-to-noise , specially for programs aiming to follow a large number of stars. Therefore, it would be very convenient to find other activity indicators at longer wavelengths. Since we observe simultaneously a long range of wavelenghts, our data provides an excellent opportunity to study the correlation between different spectral features and activity indexes. Furthermore, the long duration of our observing program, the HK Project, (14 years) allows us to analyze if the relation between these indexes depends on the level of activity of each individual star and, therefore, if it is associated to the distribution of active regions in the stellar atmosphere.
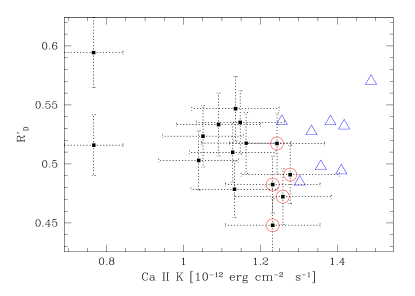
Díaz et al. (2007a) studied the Na I D lines (D Å; D Å) in our stellar sample with CASLEO spectra. They constructed a spectral index () as the ratio between the flux in the D lines and the bolometric flux. They concluded that this index, once corrected for the photospheric contribution, can be used as a chromospheric activity indicator in stars with H in emission. Using high-resolution HARPS spectra, Gomes da Silva et al. (2011) were able to integrate the D line flux in narrower windows, and, in 70% of their sample of M stars, they found a significant correlation with the Ca flux, even at low activity levels. In particular, they always obtained a positive correlation for each individual star.
In Fig. 3(a) we plot simultaneous measurements of the index vs. the Ca II K fluxes derived from CASLEO spectra of AD Leo. For the non-flaring points, both indexes anti-correlate with a Pearson’s correlation coefficient R=-0.63. If we remove the maximum , a possible anticorrelation is still present, but much less significant (R=-0.39). This tendency changes during flares when both activity indicators correlate with R=0.43.
Although in the Sun the correlation between the Ca II K and H line-core fluxes is positive (Livingston et al., 2007), Cincunegui et al. (2007a) reported that this relation is not always valid for other late stars (F7V-M5V). Each star shows a particular behaviour, ranging from anti-correlations to tight correlations with different slopes, including cases where no correlations are found (Cincunegui et al., 2007a). Based on this result, Meunier & Delfosse (2009) studied the H-Ca II relation during the solar cycle and they found that this correlation and the slope were much larger during solar maximum than during minimum. In Buccino et al. (2012), we show simultaneous measurements of the H and Ca II K+H fluxes for three solar analogs of different ages. Although they show a low correlation for the whole series, the correlation is strongly positive during active phases.
In several M stars of our sample we found that H and the Ca II K fluxes were not correlated (Díaz et al., 2007b; Buccino et al., 2011).Walkowicz & Hawley (2009) studied this correlation for several M3 dwarfs, using one spectrum for each star, and found a strong positive correlation between simultaneous measurements of Ca II K and H for the most active stars, with H in emission, including AD Leo. However, they did not analyzed this relation for individual observations of each star.
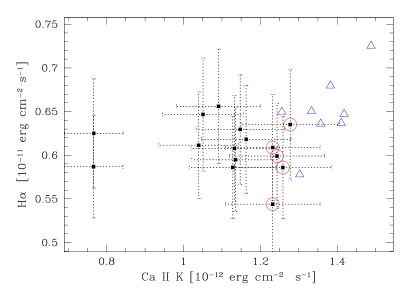
Here, we compute the H flux as the average surface flux in a 1.5 Å square passband centered in 6562.82 Å(Cincunegui et al., 2007a). In Fig. 3(b) we plot the H and Ca II K fluxes for the spectra used in Fig. 1(a). Both fluxes are not correlated (R=-0.145). However, as we found for solar-analogs, those points associated with high activity show a rather strong correlation, with coefficient R=0.64, and are also correlated during flares, with R=0.65. These points are shown as triangles in Fig. 3(b).
4 Discussion
To explore the dynamo near the fully-convective boundary, we studied the long-term activity of the M3Ve dwarf star AD Leo (GJ 388). In particular, we analyzed the Ca II K line-core fluxes measured on our CASLEO spectra obtained since 2001, and the ASAS photometric data. Both in the photometry and in the Ca II fluxes, we obtained a possible activity cycle of 7 years and a less-significant shorter one of 2 years with the Lomb-Scargle periodogram. It should be noted that we detected similar periods in two completely independent datasets. These reinforces the significance of the detection, since the probability of a false detection in both datasets should be computed as the product of both FAPs. The longer cycle coincides whithin the statistical errors whith the periodic variations in the flare frequency (for energies above 1030 ergs) reported by Pettersen et al. (1986). Furthermore, the minimum of the 7-yr cycle reached in 2007 also coincides with a significant decrease in flare activity (Konstantinova-Antova et al., 2008).
Multiple cycles have been already detected in several cool stars (e.g. Saar & Brandenburg 1999; Oláh et al. 2009; Metcalfe et al. 2013). For those stars later than F5 with well-determined rotation and cycle periods, Saar (2011) examined the relation between the cycle () and rotation frequencies (), and found that most cycles fall into three parallel tracks, with , with double cycles falling in different branches. Therefore, both periods are not independent. In fact, given the primary period of AD Leo of around 2800 days and its rotation period of 2.23 days, Saar’s results imply that if this star presents a secondary cycle, its period should be around 800 days, similar to the one we obtain. A possible interpretation for this bimodal relation is that each activity cycle has different physical sources (Böhm-Vitense, 2007). Probably two dynamos may be operating inside the star: one driven by rotational shear in the near-surface layers (longer cycle) and the other in the deep convection zone (shorter cycle). Since AD Leo is a near fully-convective star, unlike the stars considered in Böhm-Vitense (2007), a tachocline dynamo may not be feasible in this star.
Since we have simultaneous observations of different spectral features we can analyze the relation between chromospheric lines formed at different depths along the activity cycle and during flares. In particular, we found evidences of a possible anticorrelation between the Na I index and the Ca II K fluxes. On the other hand, the H and Ca II fluxes show little correlation during the cycle. Since the observed fluxes add the radiation coming from different magnetic structures, like spots and faculae, the resulting fluxes change during the cycle as the filling factors for each of these structures change. Therefore, the correlation between fluxes can depend on each line’s contrasts (see Mauas & Falchi 1996).
In particular, during flares we find a positive correlation between the Ca II, Na I and H fluxes, suggesting that the flare-heating mechanism in operation from mid- to high-chromosphere does not change with flare strength, suggested by Hawley et al. (2003).
M dwarfs are ideal targets to search for terrestrial planets in the habitable zone. However, their activity signatures can hinder the detection of orbiting planets. Our results suggest that the level of activity will be appreciably lower during the next minimum, expected around 2015. This should be the best moment to search for planets orbiting AD Leo.
| Label | xJD | t |
|---|---|---|
| 0301c1 | 1974.57 | 2700 |
| 0301c2 | 1974.61 | 2700 |
| 1201c1 | 2247.82 | 1800 |
| 1201c2 | 2247.84 | 1800 |
| 0302a1 | 2363.61 | 1800 |
| 0302a2 | 2363.63 | 1800 |
| 0303a1 | 2713.63 | 3000 |
| 0303a2 | 2713.66 | 3000 |
| 1203b1 | 2980.82 | 1800 |
| 1203b2 | 2980.84 | 1800 |
| 0304a1 | 3072.62 | 3000 |
| 0304a2 | 3072.66 | 3000 |
| 0604b1 | 3159.47 | 1800 |
| 0604b2 | 3159.49 | 1800 |
| 1104d1 | 3335.82 | 1800 |
| 1104d2 | 3335.84 | 1800 |
| 0305a1 | 3448.64 | 1800 |
| 0305a2 | 3448.67 | 1800 |
| 1206d1 | 4081.83 | 2400 |
| 1206d2 | 2980.86 | 2400 |
| 0307a1 | 4162.69 | 3600 |
| 0307a2 | 4162.73 | 3600 |
| 0308b1 | 4547.64 | 3600 |
| 0308b2 | 4547.68 | 3600 |
| 1208c1 | 4821.77 | 3600 |
| 1208c2 | 4821.82 | 3600 |
| 0309b1 | 4902.63 | 3600 |
| 0310b1 | 5262.58 | 3600 |
| 0310b2 | 5262.62 | 3600 |
| 1210c1 | 5547.77 | 2700 |
| 1210c2 | 5547.81 | 2700 |
| 1212b1 | 6281.82 | 1800 |
| 1212b2 | 6281.84 | 1800 |
| 0313b1 | 6354.64 | 2850 |
| 0313b2 | 6354.67 | 2850 |
Note. — Spectra indicated with are discarded in Fig. 1(a), due to the presence of flares.
References
- Baliunas et al. (1995) Baliunas, S. L., Donahue, R. A., Soon, W. H., Horne, J. H., Frazer, J., Woodard-Eklund, L., Bradford, M., Rao, L. M., Wilson, O. C., Zhang, Q., Bennett, W., Briggs, J., Carroll, S. M., Duncan, D. K., Figueroa, D., Lanning, H. H., Misch, T., Mueller, J., Noyes, R. W., Poppe, D., Porter, A. C., Robinson, C. R., Russell, J., Shelton, J. C., Soyumer, T., Vaughan, A. H., & Whitney, J. H. 1995, ApJ, 438, 269
- Böhm-Vitense (2007) Böhm-Vitense, E. 2007, ApJ, 657, 486
- Brown et al. (2008) Brown, K. I. T., Gray, D. F., & Baliunas, S. L. 2008, ApJ, 679, 1531
- Browning (2008) Browning, M. K. 2008, ApJ, 676, 1262
- Buccino et al. (2011) Buccino, A. P., Díaz, R. F., Luoni, M. L., Abrevaya, X. C., & Mauas, P. J. D. 2011, AJ, 141, 34
- Buccino & Mauas (2008) Buccino, A. P., & Mauas, P. J. D. 2008, A&A, 483, 903
- Buccino & Mauas (2009) —. 2009, A&A, 495, 287
- Buccino et al. (2012) Buccino, A. P., Vieytes, M. C., & Mauas, P. J. D. 2012, in IAU Symposium, Vol. 286, IAU Symposium, ed. C. H. Mandrini & D. F. Webb, 324–327
- Chabrier & Baraffe (1997) Chabrier, G., & Baraffe, I. 1997, A&A, 327, 1039
- Chabrier & Küker (2006) Chabrier, G., & Küker, M. 2006, A&A, 446, 1027
- Cincunegui et al. (2007a) Cincunegui, C., Díaz, R. F., & Mauas, P. J. D. 2007a, A&A, 469, 309
- Cincunegui & Mauas (2004) Cincunegui, C., & Mauas, P. J. D. 2004, A&A, 414, 699
- Cincunegui et al. (2007b) Cincunegui, C. C., Díaz, R. F., & Mauas, P. J. D. 2007b, A&A, 461, 1107
- Crespo-Chacón et al. (2006) Crespo-Chacón, I., Montes, D., García-Alvarez, D., Fernández-Figueroa, M. J., López-Santiago, J., & Foing, B. H. 2006, A&A, 452, 987
- Díaz et al. (2007a) Díaz, R. F., Cincunegui, C., & Mauas, P. J. D. 2007a, MNRAS, 378, 1007
- Díaz et al. (2007b) Díaz, R. F., González, J. F., Cincunegui, C., & Mauas, P. J. D. 2007b, A&A, 474, 345
- Favata et al. (2000) Favata, F., Micela, G., & Reale, F. 2000, A&A, 354, 1021
- Frodesen et al. (1979) Frodesen, G. A., Skjeggestad, O., & Tofte, H. 1979, Probability and Statistics in Particle Physics (Universitetsforlaget)
- Gomes da Silva et al. (2011) Gomes da Silva, J., Santos, N. C., Bonfils, X., Delfosse, X., Forveille, T., & Udry, S. 2011, A&A, 534, A30
- Gomes da Silva et al. (2012) Gomes da Silva, J., Santos, N. C., Bonfils, X., Delfosse, X., Forveille, T., Udry, S., Dumusque, X., & Lovis, C. 2012, A&A, 541, A9
- Gray & Baliunas (1995) Gray, D. F., & Baliunas, S. L. 1995, ApJ, 441, 436
- Gray et al. (1996a) Gray, D. F., Baliunas, S. L., Lockwood, G. W., & Skiff, B. A. 1996a, ApJ, 465, 945
- Gray et al. (1996b) —. 1996b, ApJ, 456, 365
- Gray & Livingston (1997) Gray, D. F., & Livingston, W. C. 1997, ApJ, 474, 802
- Güdel et al. (2003) Güdel, M., Audard, M., Kashyap, V. L., Drake, J. J., & Guinan, E. F. 2003, ApJ, 582, 423
- Hawley (1989) Hawley, S. L. 1989, PhD thesis, AA(Texas Univ., Austin.)
- Hawley et al. (2003) Hawley, S. L., Allred, J. C., Johns-Krull, C. M., Fisher, G. H., Abbett, W. P., Alekseev, I., Avgoloupis, S. I., Deustua, S. E., Gunn, A., Seiradakis, J. H., Sirk, M. M., & Valenti, J. A. 2003, ApJ, 597, 535
- Hawley et al. (1995) Hawley, S. L., Fisher, G. H., Simon, T., Cully, S. L., Deustua, S. E., Jablonski, M., Johns-Krull, C. M., Pettersen, B. R., Smith, V., Spiesman, W. J., & Valenti, J. 1995, ApJ, 453, 464
- Hawley & Pettersen (1991) Hawley, S. L., & Pettersen, B. R. 1991, ApJ, 378, 725
- Henry et al. (1994) Henry, T. J., Kirkpatrick, J. D., & Simons, D. A. 1994, AJ, 108, 1437
- Horne & Baliunas (1986) Horne, J. H., & Baliunas, S. L. 1986, ApJ, 302, 757
- Hunt-Walker et al. (2012) Hunt-Walker, N. M., Hilton, E. J., Kowalski, A. F., Hawley, S. L., & Matthews, J. M. 2012, PASP, 124, 545
- Konstantinova-Antova et al. (2008) Konstantinova-Antova, R., Bogdanovski, R., Antov, A., & Spassov, B. 2008, Romanian Astronomical Journal, 18, 55
- Livingston et al. (2007) Livingston, W., Wallace, L., White, O. R., & Giampapa, M. S. 2007, ApJ, 657, 1137
- Lorente & Montesinos (2005) Lorente, R., & Montesinos, B. 2005, ApJ, 632, 1104
- Mauas & Falchi (1996) Mauas, P. J. D., & Falchi, A. 1996, A&A, 310, 245
- Metcalfe et al. (2013) Metcalfe, T. S., Buccino, A. P., Brown, B. P., Mathur, S., Soderblom, D. R., Henry, T. J., Mauas, P. J. D., Petrucci, R., Hall, J. C., & Basu, S. 2013, ApJ, 763, L26
- Meunier & Delfosse (2009) Meunier, N., & Delfosse, X. 2009, A&A, 501, 1103
- Morin et al. (2008) Morin, J., Donati, J.-F., Petit, P., Delfosse, X., Forveille, T., Albert, L., Aurière, M., Cabanac, R., Dintrans, B., Fares, R., Gastine, T., Jardine, M. M., Lignières, F., Paletou, F., Ramirez Velez, J. C., & Théado, S. 2008, MNRAS, 390, 567
- Oláh et al. (2009) Oláh, K., Kolláth, Z., Granzer, T., Strassmeier, K. G., Lanza, A. F., Järvinen, S., Korhonen, H., Baliunas, S. L., Soon, W., Messina, S., & Cutispoto, G. 2009, A&A, 501, 703
- Parker (1955) Parker, E. N. 1955, ApJ, 122, 293
- Pettersen et al. (1984) Pettersen, B. R., Coleman, L. A., & Evans, D. S. 1984, ApJS, 54, 375
- Pettersen et al. (1986) Pettersen, B. R., Panov, K. P., Ivanova, M. S., & Sandmann, W. H. 1986, A&AS, 66, 235
- Reiners & Basri (2007) Reiners, A., & Basri, G. 2007, ApJ, 656, 1121
- Robinson & Durney (1982) Robinson, R. D., & Durney, B. R. 1982, A&A, 108, 322
- Saar (2011) Saar, S. H. 2011, in IAU Symposium, Vol. 273, IAU Symposium, ed. D. Prasad Choudhary & K. G. Strassmeier, 61–67
- Saar & Brandenburg (1999) Saar, S. H., & Brandenburg, A. 1999, ApJ, 524, 295
- Walkowicz & Hawley (2009) Walkowicz, L. M., & Hawley, S. L. 2009, AJ, 137, 3297
- West et al. (2004) West, A. A., Hawley, S. L., Walkowicz, L. M., Covey, K. R., Silvestri, N. M., Raymond, S. N., Harris, H. C., Munn, J. A., McGehee, P. M., Ivezić, Ž., & Brinkmann, J. 2004, AJ, 128, 426