Phosphorus in the Young Supernova Remnant Cassiopeia A
Phosphorus (31P), which is essential for life, is thought to be synthesized in massive stars and dispersed into interstellar space when these stars explode as supernovae (SNe). Here we report on near-infrared spectroscopic observations of the young SN remnant Cassiopeia A, which show that the abundance ratio of phosphorus to the major nucleosynthetic product iron (56Fe) in SN material is up to 100 times the average ratio of the Milky Way, confirming that phosphorus is produced in SNe. The observed range is compatible with predictions from SN nucleosynthetic models but not with the scenario in which the chemical elements in the inner SN layers are completely mixed by hydrodynamic instabilities during the explosion.
Phosphorus (P) is an indispensable ingredient for life together with carbon, hydrogen, nitrogen, oxygen, and sulfur (S). In our solar system, its abundance relative to hydrogen is by number, which is 50 to 1900 times less than those of the other life-keeping elements (?). The abundance of P in the diffuse interstellar medium and stars in our galaxy’s disk is comparable with that of the solar system or the cosmic abundance, with some dependence on metallicity (?, ?). P is believed to be mainly formed in massive [] stars by neutron capture on silicon (Si) in hydrostatic neon-burning shells in the pre-SN stage and also in explosive carbon and neon burning layers during SN explosion (?, ?).
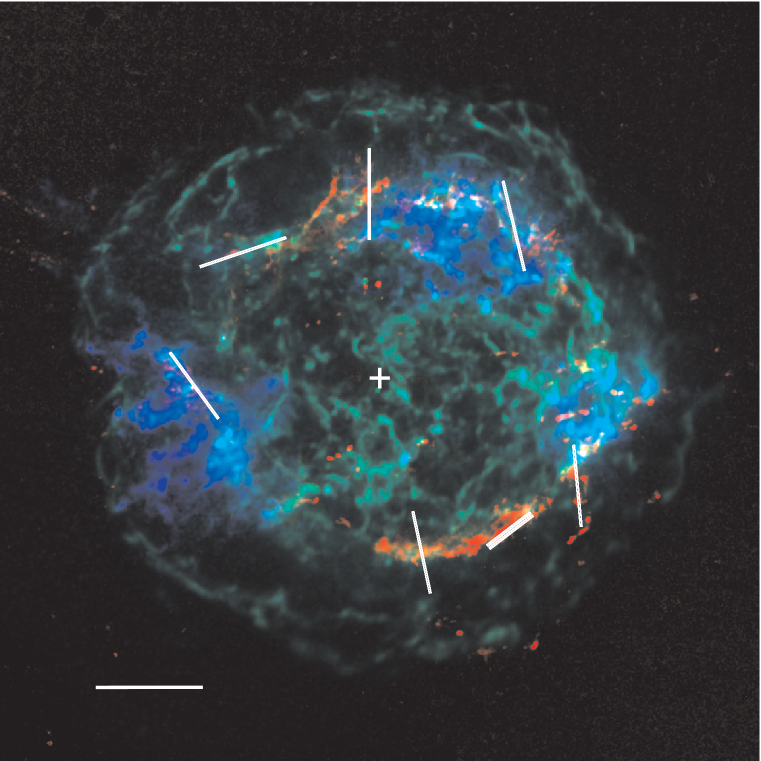
Freshly synthesized P should thus be found in young core-collapse SN remnants (SNRs) resulting from the explosion of massive stars. Cassiopeia A (Cas A) is the youngest confirmed core-collapse SNR in our galaxy; it has been extensively studied in all wavebands (Fig. 1). It is located at a distance of 3.4 kpc (?) and thought to be the remnant of a SN event in C.E. (?). The spectrum of the light echo from the SN event indicated a SN of Type IIb that had a small hydrogen envelope at the time of explosion (?). The total estimated mass of the SN ejecta is 2 to 4 , and the inferred initial mass of the progenitor star ranges from 15 to 25 (?, ?). Emission from P II was previously detected from Cas A (?), but no analysis of the emission line has been done.
We conducted near-infrared (NIR) spectroscopic observations of the main SN ejecta shell using the TripleSpec spectrograph mounted on the Palomar 5-m Hale telescope in 2008 (Fig. 1) (?). TripleSpec provides continuous wavelength coverage from 0.94 to 2.46 m at medium spectral resolving power of . By analyzing the spectra, we identified 63 knots of emission and, for each knot, measured the radial velocities and fluxes of emission lines, including [P II] lines (?).
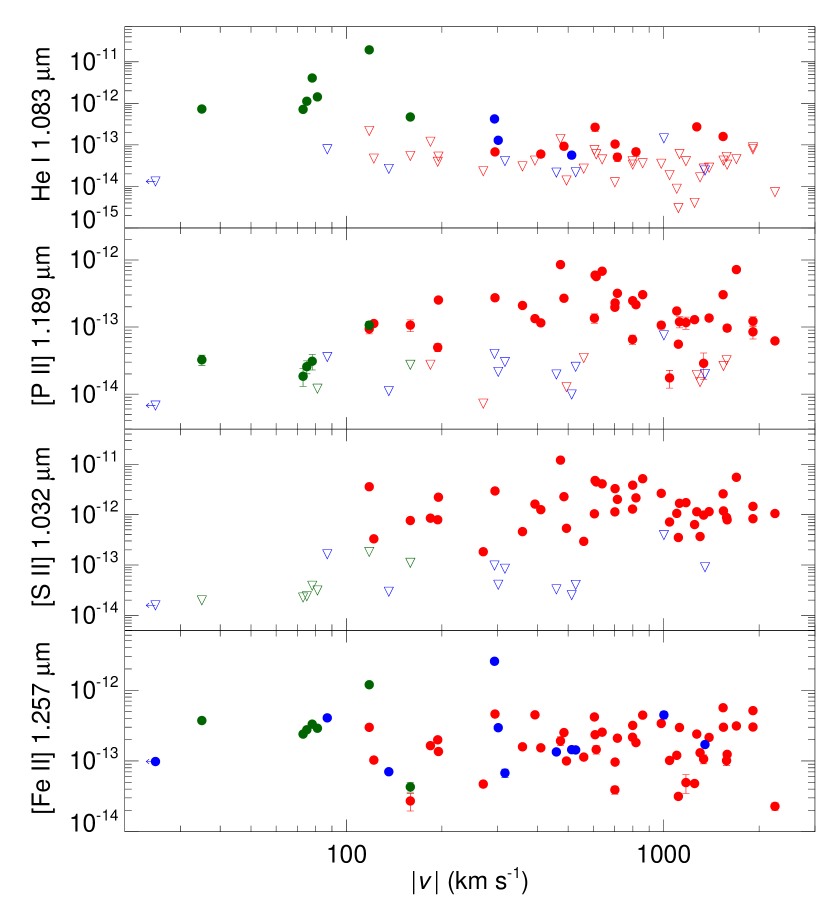
The knots show distinct spectroscopic and kinematic properties depending on their origins (Fig. 2). The knots with strong [S II] lines (Fig. 2, red symbols) have high ( km s-1) radial velocities, and most of them have strong [P II] lines too, suggesting that the production of P is tightly correlated with the production of S. Some knots without apparent [S II] lines have low radial velocities ( km s-1) and strong He I lines (FIg. 2, green symbols). Their properties match those of “quasi-stationary flocculi”, the material lost from the hydrogen envelope of the progenitor during its red-supergiant phase as slow wind (?, ?). The rest of the knots without [S II] lines (Fig. 2, blue symbols) have little He I emission, and most of them have high radial velocities. They have [Fe II] lines as strong as those from the other knots. These knots are probably pure iron (Fe) material from complete Si-burning in the innermost region of the SN, corresponding to the pure Fe ejecta detected in x-rays (?). They are found mainly in the southern bright [Fe II] filament, where the x-ray–emitting Fe ejecta is not prominent (Fig. 1).
The P/Fe abundance ratio of the knots can be derived from the flux ratio of [P II] 1.189 m and [Fe II] 1.257 m lines (). These two lines have comparable excitation energies and critical densities, which together with the fact that the ionization energies of P and Fe are comparable (10.49 and 7.90 eV) greatly simplifies the abundance analysis (?). (This is not the case for [S II] lines that have considerably higher excitation energies.) We assume that the line-emitting region is at K and has an uniform density, with equal fractions of singly ionized ions. This simple model yields P/Fe abundances accurate to within % mostly for both SN and circumstellar knots (?). The observed ratios (Fig. 3) imply that the P-to-Fe abundance ratio by number, , of the SN ejecta knots is up to 100 times higher than the cosmic abundance (?), whereas the knots of the circumstellar medium have ratios close to the cosmic abundance. The enhanced P abundance over Fe in these SN ejecta knots is direct evidence for the in situ production of P in Cas A.
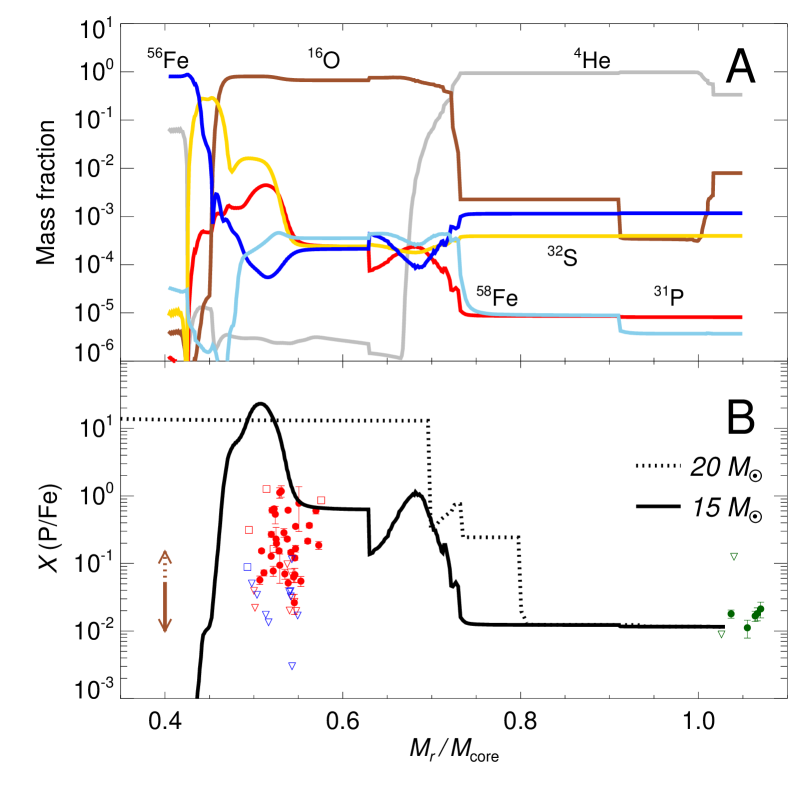
The observed range of is compatible with the local nucleosynthetic yield of P in SN models. The internal chemical composition and the resulting profile of a spherically symmetric SN model for progenitor mass of 15 M⊙ is shown in Fig. 4 (?). In the oxygen-rich layer, P is enhanced, whereas Fe is slightly depleted because of neutron capture. (56Fe and 58Fe are the two major Fe isotopes in the oxygen-rich layer.) This makes higher by two orders of magnitude than that of the outer He-rich layer, which is essentially equal to the cosmic abundance. The extended P enhancement in to 0.73 is the result of hydrostatic burning in pre-SN, whereas the bump at is due to explosive burning during the explosion. The knots that we observed are probably from somewhere in the oxygen-rich layer. It is, however, difficult to precisely determine the knots’ original positions in the progenitor star from the comparison of the measured P/Fe ratio with the model prediction because the local are very much model-dependent (Fig. 4B) and subject to further modifications owing to the Rayleigh-Taylor instability during the explosion (?). We instead assumed that the knots have been expanding freely, with an expansion rate of km s-1 pc-1 (?). We then converted the obtained space velocities to mass coordinates using the ejecta velocity profile of a 15 SN IIb model (?) scaled to the chemical structure of the model in Fig. 4 (?). The resulting mass coordinates have considerable uncertainties because of model-dependency but provide rough locations of the knots (Fig. 4B).
of the [P II] line–emitting ejecta knots fall into the range of the oxygen-rich layer in the model, whereas the of the “pure” Fe knots are often less than the cosmic abundance (Fig. 4B). The fact that the circumstellar knots have close to the cosmic abundance––gives confidence in the derived in the core. The extended range over nearly two orders of magnitude may be explained by the hydrodynamic chemical mixing during the SN explosion. But, our result does not support a complete mixing of the core below the He-rich layer because in such a case, will be much lower as marked by the brown arrow in Fig. 4B; the available yields in the literature imply =0.01 to 0.05 for a SN of 15 to 25 (?, ?, ?, ?), which is represented by the solid part of the arrow, or 0.01 to 0.15 when the unusually high P yield of the 20 model of (?) is included. The detection of P-depleted, pure Fe material probably produced in the innermost, complete Si-burning layer also indicates that these dense SN ejecta materials largely retain their original abundance.
The high ratio, in principle, could also result from the depletion of Fe in the gas phase if Fe atoms are locked in dust grains. In Cas A, a substantial amount ( ) of newly formed dust grains in the SN ejecta has been indeed detected (?, ?, ?). But, they are most likely silicate dust, with only 1% of Fe in the form of FeS (?). Also, the fact that [P II] lines in the SN ejecta are much stronger than in the circumstellar knots (Fig. 2) is best explained by the enhanced abundance of P rather than by the depletion of Fe onto dust.
References and Notes
- 1. M. Asplund, N. Grevesse, A. J. Sauval & P. Scott, Annu. Rev. Astron. Astrophys., 47, 481 (2009)
- 2. V. Lebouteiller, Kuassivi & R. Ferlet, Astron. Astrophys., 443, 509 (2005)
- 3. E. Caffau, P. Bonifacio, R. Faraggiana & M. Steffen, Astron. Astrophys., 532, A98 (2011)
- 4. S. E. Woosley & T. A. Weaver, Astrophys. J. Suppl. S., 101, 181 (1995)
- 5. Another type of stellar explosions (Type Ia supernovae) are also thought to contribute but to a much lesser extent (?, ?).
- 6. J. E. Reed, J. J. Hester, A. C. Fabian & P. F. Winkler, Astrophys. J., 440, 706 (1995)
- 7. R. A. Fesen, M. C. Hammell, J. Morse et al., Astrophys. J., 645, 283 (2006)
- 8. O. Krause, S. M. Birkmann, T. Usuda et al., Science, 320, 1195 (2008)
- 9. U. Hwang & J. M. Laming, Astrophys. J., 746, 130 (2012)
- 10. P. A. Young, C. L. Fryer, A. Hungerford et al., Astrophys. J., 640, 891 (2006)
- 11. C. L. Gerardy & R. A. Fesen, Astron. J., 121, 2781 (2001)
- 12. Materials and methods are available as supplementary materials on Science Online.
- 13. S. van den Bergh, Astrophys. J., 165, 457 (1971)
- 14. J.-J. Lee, S. Park, J. P. Hughes & P. O. Slane, arXiv:1304.3973 (2013)
- 15. E. Oliva, A. Marconi, R. Maiolino et al., Astron. Astrophys., 369, L5 (2001)
- 16. T. Rauscher, A. Heger, R. D. Hoffman & S. E. Woosley, Astrophys. J., 576, 323 (2002)
- 17. K. Kifonidis, T. Plewa, H.-T. Janka & E. Müller, Astron. Astrophys., 408, 621 (2003)
- 18. T. DeLaney, L. Rudnick, M. D. Stage et al., Astrophys. J., 725, 2038 (2010)
- 19. S. E. Woosley, R. G. Eastman, T. A. Weaver, & P. A. Pinto, Astrophys. J., 429, 300 (1994)
- 20. C. Kobayashi, H. Umeda, K. Nomoto, K. et al., Astrophys. J., 653, 1145 (2006)
- 21. A. Chieffi & M. Limongi, Astrophys. J., 764, 21 (2013)
- 22. J. Rho, T. Kozasa, W. T. Reach et al., Astrophys. J., 673, 271 (2008)
- 23. B. Sibthorpe, P. A. R. Ade, J. J. Bock et al. Astrophys. J., 719, 1553 (2010)
- 24. M. J. Barlow, O. Krause, B. M. Swinyard et al. Astron. Astrophys., 518, L138 (2010)
- 25. T. Nozawa, T. Kozasa, N. Tominaga et al., Astrophys. J., 713, 356 (2010)
- 26. G. Cescutti, F. Matteucci, E. Caffau & P. François, Astron. Astrophys., 540, A33 (2012)
- 27. C. West & A. Heger, Astrophys. J., 774, 75 (2013)
- 28. J. R. Thorstensen, R. A. Fesen & S. van den Bergh, Astron. J., 122, 297 (2001)
-
Acknowledgements:
This work was supported by Basic Science Research (NRF-2011-0007223) and International Cooperation in Science abd Technology (NRF-2010-616-C00020) programs through the National Research Foundation of Korea (NRF) funded by the Ministry of Education, Science and Technology, and also by the Korean Federation of Science and Technology Societies (KOFST). D.-S. M. acknowledges support from the the Natural Science and Engineering Research Council of Canada. We thank M. Muno for his help in observations and J.-J. Lee for providing the Chandra 1Ms x-ray images.
Supplementary Materials
www.sciencemag.org/cgi/content/full/science.1243823/DC1
Materials and Methods
Figs. S1 to S4
Tables S1 to S2
References (29–49)