Supplemental Material for:
First Principles Study of Bismuth Films at Transition Metal Grain Boundaries
Qin Gao and Michael Widom
Department of Physics, Carnegie Mellon University, Pittsburgh, Pennsylvania 15213, USA
I Bi bilayer on Fe 5(012) GB
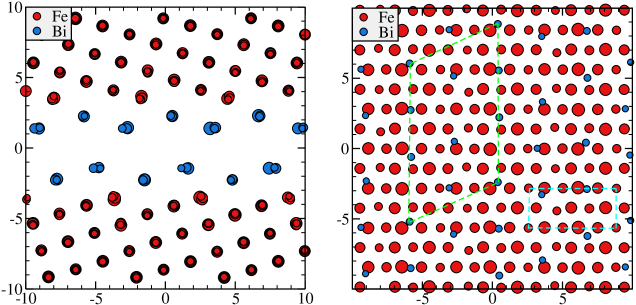
We calculated Bi bilayer enthalpy on Fe 5(012), a high energy GB which is created by cleaving the BCC bulk along the (012) plane and rotating one grain around [001] by 53.1o and rejoining the two parts. Our calculated GB energy is 98 meV/Å2, close to the GB energy 104 meV/Å2 of the lowest energy structure in the literature Ossowski et al. (2010). We first studied Bi monolayers on Fe (012) surfaces and then calculated bilayer films on the GB with the stable surface structure at two sides of the GB plane. We used 10 layers of Fe at each side of the Bi film. The relaxed structure is shown in Fig. S1. The lowest H/A is +17 meV/Å2 for bilayer films, which is large and positive indicating that the Bi bilayer is not stable even on this high energy GB.
Figure S1: (Color online) Side view (left) of relaxed Bi bilayer at Fe 5(012) GB and top view (right) of Bi monolayer on one side of the GB plane. The cyan cell is the Fe GB unit cell, the green cell is the Bi segregated GB unit cell. Atom size indicates depth (large below small). Length units are in Å.
Table S1: GB energies, units are meV/Å2. The energy conversion factor is 1 meV/Å0.016 J/m2. Values from other studies are in parentheses. Note the Co 3(111) GB energy is negative because the K state is HCP rather than the high-T FCC that we choose to compare with.
Surface
/A
(111)
0.118
-0.090
0.056
(001)
0.137
-0.122
0.030
(120)
0.150
-0.133
0.034
Table S2: Calculated input quantities for the enthalpy model (Eq. 3). Predicted values for GB with the same surface plane (i.e. ) at two sides. The energy units are eV/Å2. The Bi monolayer structure on Ni(100) surface is the () structure as observed in experiment Panja et al. (2000).
GB
/A
/A
Reduction
3(111)
0.003
0.053
0.045
0.235
0.009
96.2%
7(111)
0.029
0.027
0.023
0.209
0.009
95.7%
5(100)
0.064
-0.034
-0.037
0.208
0.007
96.6%
5(120)
0.077
-0.043
-0.054
0.220
0.010
95.5%
(111)/(100)
0.055
-0.012
-0.004
0.207
0.004
98.0%
Table S3: Model and calculated Ni GB energies and Bi bilayer enthalpies of formation at different Ni GBs. Work of separation for bare and Bi bilayer segregated GBs is shown on right. The energy units are eV/Å2. The 7(111) GB is made by twisting the one side of bulk Ni by 21.8o around the [111] axis with (111) as GB plane. The resulting GB cell is [3-112] as defined in Bollmann et al. (2011) on which Bi favors 3 atoms per layer. The 5(100) GB is made by twisting one side of bulk Ni by 36.9o around the [001] axis with (001) as GB plane.
Co(nonmag)
Co(mag)
Ni(nonmag)
Ni(mag)
Cu
Esurf (eV/Å2)
0.193
0.164
0.152
0.150
0.100
H (eV/Å2)
-0.160
-0.118
-0.152
-0.133
-0.070
iCOHP(Bi-TM)
-1.75
-1.63
-1.77
-1.75
-1.33
iCOHP(TM-TM)a
-1.38
-1.32
-1.13
-1.13
-0.43
iCOHP(TM-TM)b
-1.17
-1.16
-0.85
-0.83
-0.66
Table S4: The (012) surface energy, Bi monolayer enthalpies of formation, integrated COHP (iCOHP) energies of Bi-TM bond, TM-TM bond near to Bi(a) and TM-TM bond away from impurities(b). The energy units are eV/bond for the iCOHP energies.
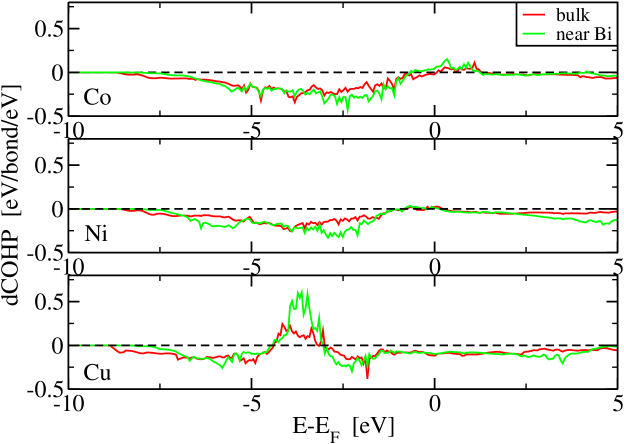
Figure S2: (Color online) Differential COHP of Metal-Metal interaction in the bulk and near to Bi. Negative is bonding while positive is antibonding. The Ni and Co results are the summation of two spin components. The dashed green line is the x axis. The zero in x axis is the Fermi energy.