On the long nulls of PSRs J17382330 and J1752+2359
Abstract
This paper compares and contrasts the emission of two high nulling fraction pulsars, PSRs J17382330 and J1752+2359. In both pulsars the emission bursts appear in a quasi-periodic fashion with typical separations of several hundred pulses, and in J17382330 there is evidence of two underlying periodicities with memory persisting for at least 11 bursts. By contrast, in J1752+2359 the pattern coherence is rapidly lost and the burst/null lengths appear to be selected randomly from their respective quasi-normal distributions. The typical emission bursts of J17382330 exhibit a steady exponential decay of on-pulse energy accompanied by a flickering emission characterized by short frequent nulls towards their end. In the bursts of J1752+2359 the flickering is absent, the decay more pronounced and the energy released during each bright phase is approximately constant. Unlike J17382330, the average profiles for the first and the last pulses of J1752+2359 bursts differ slightly from the pulsar’s overall profile, hinting at differences between the two pulsars in their transitions from null to burst state (and vice-versa). During its long null phases, J1752+2359 is found to emit random weak inter-burst pulses (IBPs) whose profile peak is somewhat offset with respect to the overall average profile. Such pulses have no equivalent in J17382330 or in any known pulsar hitherto. They may pervade the entire emission of this pulsar and have a separate physical origin to normal pulses. On the basis of our comparison we conclude that a pulsar’s nulling fraction, even when high, remains a poor guide to its detailed subpulse behaviour, as previously found for pulsars with small nulling fractions. Gajjar et al. (2012).
keywords:
Stars:neutron – Pulsars:general; PSR J17382330 and PSR J1752+23591 Introduction
Pulse nulling, the cessation of pulse emission from a single pulse to several thousands of pulses and which is found in about 100 pulsars, has defied satisfactory explanation since its discovery Backer (1970) more than four decades ago. Nulling pulsars exhibit a variety of nulling fractions (NF)111the fraction of pulses for which no detectable radio emission is seen and one might hope that this apparently fundamental parameter could be used to characterise further aspects of the pulsar’s behaviour. However, a recent study dashed this hope and concluded that pulsars with similar low NFs ( 1 %) are not necessarily similar in their nulling pattern222the arrangements of null and burst pulses in a single pulse sequence Gajjar et al. (2012). In this paper we set out to see if this result still holds even for pulsars with large NF ( 80 %). We compare and contrast two high-NF pulsars and assess to what extent their nulling patterns follow a common statistical rule.
The first of our pulsars, PSR J1752+2359, was discovered in a high Galactic latitude survey with the Arecibo telescope Foster et al. (1995). Subsequent timing observations indicated interesting single pulse behaviour, with bursts of up to 100 pulses separated by nulls of about 500 pulses Lewandowski et al. (2004), giving an NF of about 80 %. This study also noted an intriguing exponential decrease in the pulse energy during a burst, a feature previously seen in only a few nulling pulsars Rankin & Wright (2008); Bhattacharyya et al. (2010); Li et al. (2012). The second, PSR J17382330, was discovered in the Parkes multi-beam pulsar survey Lorimer et al. (2006). A study of this pulsar at 325-MHz gave a lower limit of 69 % to its NF Gajjar et al. (2012), and – not unlike J1752+2359 – an intermittent pattern of quasi-periodic bursts interspersed with long nulls was reported. Table 1 compares the basic parameters for the two studied pulsars. Note that J17382330 is approximately five times slower and three times younger than J1752+2359.
In previous studies of these pulsars the typical duration for single pulse observations was 1-2 hours. Such short observations, particularly for pulsars with periods around 1 s, do not yield sufficient nulls and bursts for a satisfactory comparison of their statistical properties. In this study much longer observations were undertaken to obtain a large sample of nulls and bursts in each pulsar.
| PSRs | |||||||||
| P | DM | Age | Bs | Date | Telescope | Resolution | Length | ||
| (sec) | (pccm-3) | (MYr) | (1012G) | (degrees/sample) | (Pulses) | ||||
| J17382330 | 1.98 | 99.3 | 3.6 | 4.16 | 2010 Oct 24 | GMRT | 0.18 | 8463 | |
| J1752+2359 | 0.41 | 36.0 | 10.1 | 0.52 | 2010 Sep 3 | GMRT | 0.87 | 67601 | |
| 2006 Feb 12 | Arecibo | 0.36 | 4891 |
The observations and analyses are described in Section 2. The nulling patterns and their quasi-periodicities are discussed in Sections 3 and 4. The variations in burst pulse energy and the modelling thereof is described in Section 5. The emission behaviour during null-to-burst transitions and vice-versa are discussed in Section 6. Unusual emission behaviour present in the null sequences of PSR J1752+2359 is analysed in Section 7. Section 8 discusses the polarization profiles of PSR J1752+2359. The results of this study and their implications are summarized in Sections 9 and 10, respectively. In addition, Appendix A examines the possible presence of giant pulses in PSR J1752+2359. Supporting material on the pair correlation function and modelling used in the paper is provided in Appendices B and C.
2 Observations and analysis


The observations of both pulsars were carried out with the Giant Meterwave Radio Telescope (GMRT) at 325-MHz. We also analysed a small section of observations (only for J1752+2359) observed at 327-MHz with the 305 m Arecibo Telescope in Puerto Rico (Rankin, private communication). The details regarding the date, the sampling resolution and the total number of observed pulses are listed in Table 1.
The GMRT consists of 30 dish antennas, each 45 m in diameter Swarup et al. (1991). We used the GMRT in a single beam phased array mode by only including the short spacing ( 4 km) antennas to minimize the fluctuations in their phase differences due to the ionosphere. All central square antennas (14 antennas) in addition to the first two antennas from each arm (6 antennas) were used. Few antennas needed to be dropped from the configuration due to bad bandshapes and/or radio frequency interference (RFI). Thus, signals from typically 16 to 19 short spacing antennas were added in phase during the observations of both pulsars. Both pulsars were observed for around 8 hours. Radio waves were received by the front-end system and then transferred to the central electronics building using an optical fibre link. At the central electronics building, signals were processed by the GMRT software backend, which is a real-time correlator for 32 antennas2 polarizations with 33.3-MHz bandwidth Roy et al. (2010). Voltages from each antenna were added after phase compensation to form a coherent sum, which was squared to obtain the total intensities. The data were recorded in this mode with an effective integration time of around 1 ms for both pulsars. Phase equalisation was carried out every 1.5 to 2 hours during the observations due to short instrumental phase stability time scales at lower frequencies. Hence, 8 hour long observations for each pulsar were broken up into 4 to 5 different sessions and data were recorded separately for each session. Data were then converted to SIGPROC333http://sigproc.sourceforge.net filterbank format for off-line processing.
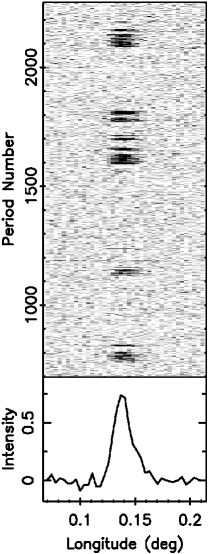
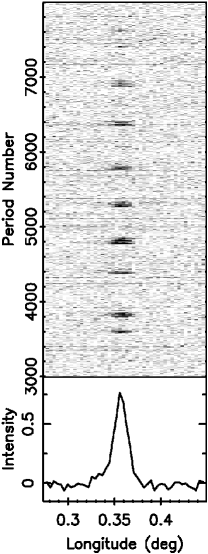
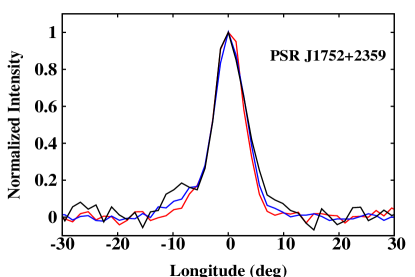
During the off-line analysis a few channels briefly showed the presence of narrow-band RFI. To keep a similar sensitivity level during each individual session, we flagged all the RFI affected channels from the entire observing session. Remaining channels were dedispersed using the respective nominal DM (given in Table 1) for both pulsars. The dedispersed time series were folded to 256 longitude bins for every single period for both pulsars using the rotation period obtained from the polycos444http://www.atnf.csiro.au/people/pulsar/tempo/. These single pulse datasets were used for rest of the analysis. Small sections of the observed single pulses in grey-scale intensities are shown in Fig. 1 for both pulsars. The on-pulse and the off-pulse energy histograms are shown in Fig. 2. Note that no giant pulses are seen for J1752+2359 in our observations at 325-MHz, contrary to reported giant pulses with energies of about 200 times the mean pulse energy at 111-MHz Ershov & Kuzmin (2005). A discussion of this result can be found in Appendix A.
For PSR J1752+2359 around 30 minutes of archival full polar observations at 327-MHz from the Arecibo telescope was also analysed to confirm the presence of weak burst pulses during the null states and to compare linear and circular polarization profiles. Details regarding the data reduction and the polarization calibration are similar to those discussed by Rankin et al. (2013).
3 Null-burst statistics


The single pulse sequences of Fig. 1 show the burst pulses of both pulsars clustering together in groups, which we will refer to as the bright phases interspersed with long null phases (the inter-burst or off-phases), giving a quasi-periodic effect.
However, behind this general similarity we find a number of important differences between the two pulsars, and these can be seen in the burst and null length histograms of each pulsar (Fig. 3). In J17382330, the lengths of the bursts (see Fig. 3a) are much shorter than those typical of J1752+2359 (shown in Fig. 3c) because in its bright phases the bursts of the former are equally mixed with short nulls, as can be seen from the inset of short nulls in Fig. 3b. Together this results in bright phases of up to 60 pulses in length, with the nulls predominating towards the end (see Section 5). The high NF of this pulsar then arises through the presence of a long tail of long nulls in the histogram of Fig. 3b. All the designated null pulses of this pulsar, whether occurring within or between bright phases, were integrated and found to show no profile of significance.
By contrast, in J1752+2359 the bright phases consist of sustained non-null pulses (see Fig. 3c), typically of 70-80 pulses. What is unusual about this pulsar is the very large number of isolated burst pulses which occur in the inter-burst phases. These are not evident in Fig. 1 and can only be found by a careful inspection of the sequences. We designate them as inter-burst pulses (IBPs) and show in Section 7 that they appear at random during the inter-burst phases, and maybe throughout the entire emission of J1752+2359. As a result, the apparently long nulls of this pulsar become subdivided in a random way giving rise to the exponential distribution strikingly visible in the null length histogram (NLH; see Fig. 3d). No such effect is seen in J17382330.
One consequence of the burst-null mix in the bright phases of J17382330 and the IBPs in J1752+2359 is that the conventional burst and null length histograms of both pulsars in Fig. 3 show no evidence of the quasi-periodic behaviour of the bright and off-phases despite it being very clear in the pulse sequences shown in Fig. 1. To overcome this, we carried out a visual inspection of the single pulses of both pulsars and identified appropriate bright phases and their separation (the separation being defined as the number of pulses between the first pulses of two consecutive bright phases).
In the case of J17382330, 21 bright phases were identified and a histogram of these is shown in Fig. 4a. This distribution shows a peak at around 50 to 70 pulsar periods with a spread of around 40 pulsar periods, a result which might be expected from combining the short bursts and nulls of Figs. 3a and 3b. Likewise, a histogram of the separations between the first pulse of two successive bright phases is shown in Fig. 4b. This has a surprising bimodal character with peaks around 170 and 500 pulses. Lengths of around 500 pulses cannot be formed by combining a typical bright phase length from Fig. 4a and the longest null length from Fig. 3b, where the maximum is 400 pulses. We can therefore deduce that the longest inter-burst phases must be interrupted at some point by very short (and maybe weak) bursts which were rejected as burst pulses. This explains the longer off-phase stretches seen in this pulsar’s sequence of Fig. 1 and foreshadows our discussion of this pulsar’s quasi-periodic patterns in Section 4.
For J1752+2359, the identification of bright phases was a more difficult task, since it had to take into account the intrusion of inter-burst pulses (IBPs) in the off-pulse phases and the fact that the precise closure of a fading bright phase was sometimes difficult to fix (see Section 5). We were able to identify around 123 bright phases from a visual check of the single pulse sequences in the 8-hour observations. The bright phase lengths of Fig. 4c show much the same distribution as the burst lengths of Fig. 3c (apart from the single-pulse bursts). We find a prominent peak at around 60 pulsar periods with a spread of around 40 pulsar periods. The distributions of bright phase lengths of J17382330 and J1752+2359 are similar, but note that the former has a smaller number of bright phases. The bright phase separations of J1752+2359 also formed a broad distribution around a central peak. We measured 120 examples and the histogram is shown in Fig. 4d. The peak is at about 570 pulses with separations ranging from 150 to 1200 pulsar periods. The wide range of separations indicates that the nulling pattern is not strictly periodic, as can be seen in Fig. 1, and is discussed in the next Section.


4 Quasi-periodic patterns
In the previous section we elucidated the basic statistics of the null-burst distributions in both pulsars. Both have bright phases whose lengths are approximately normally (or possibly lognormally) distributed over lengths with a similar number of pulses (Figs. 4a and 4b), but their respective separations follow very different statistics (Figs. 4b and 4d). In the case of J17382330 the separations of the bright phases have a bimodal distribution, suggesting that the pulsar must sometimes ‘skip’ a burst (Fig.4b), giving an exceptionally long off-phase. In J1752+2359, the burst separations cover a very wide range from 100 up to 1000 pulses (Fig. 4d). These features are apparent in Fig. 1, with the sequence of J17382330 including a very long off-phase, and that of J1752+2359 producing a quasi-periodic effect despite the varying separations.
To probe deeper into the nature of “quasi-periodicity” in our two pulsars, we require a suitable tool. Power spectra are a common device [e.g. Herfindal & Rankin (2007)], but in pulsars whose burst pulses form clusters such spectra are very much dominated by red noise due to the observed jitter in cluster separation. In the present context, a more useful procedure is to form a Pair Correlation Function (PCF) for each pulsar. This is simply a histogram of all burst-to-burst separations, whether successive or not, and can be utilized to find the coherence time over which any quasi-periodicity is maintained. A formal description of PCFs can be found in Appendix B.
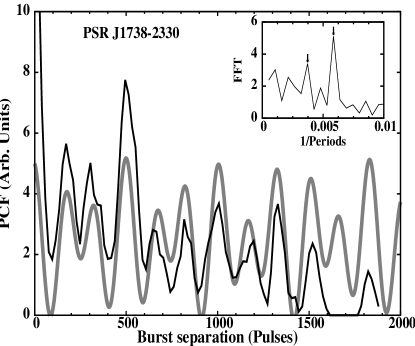
The PCF for J17382330 in Fig. 5a is formed from adding the burst-to-burst separation histograms from all observed pulse sequences, where each sequence is approximately 2000 pulses long. The pulse clustering is very clear and reveals a dramatic periodicity of about 170 pulses between each pulse of a cluster and the pulses in other clusters. If all bright bursts were equal in length then the height of the peaks would be equal for nearby separations and slowly decline for large separations (see Appendix B), but we see a striking drop in the level of these peaks for the two closest bursts to a given burst, followed by a strong third peak. More distant peaks also have irregular levels, but a general periodicity of about 170 pulses is maintained. In essence, it is the structure revealed by this PCF which underlies the bimodal distribution of the burst phase separations shown in Fig. 4b with its second peak at about 500 pulses.
To understand our result we formed the Fourier spectrum (FFT) of the PCF, which is shown in the inset diagram of Fig. 5a. This indicates two separate periodicities corresponding to approximately 170 pulses and 270 pulses, with the former dominating. The weighted sum of two sine-waves with these periodicities is overlaid on the PCF and demonstrates a good match with the PCF peaks. The 170 pulse and 270 pulse periodicities in the PCF are approximately the third and the second harmonics respectively of pulse periodicity reported by Gajjar et al. (2012). The peaks produced by the dominant periodicity of 170 pulses are diminished for two successive peaks and then enhanced for the third by the weaker but significant harmonically-related periodicity of 270 pulses. The weaker periodicity is not precisely harmonically related to 170 and thereby produces a progressive difference in the peak levels. What is very remarkable is that this reproduces very closely the relative magnitude of the peaks throughout the combined 2000 pulse separation of Fig. 5a. This suggests an emission pattern which maintains coherence over at least 2000 pulses. However, we must caution that these results may or may not persist on timescales longer than our observations.
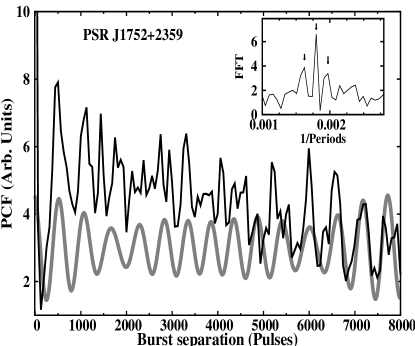
The PCF for J1752+2359 (Fig. 5b) has its first peak at around 500 pulsar periods. This is more pronounced than that of J17382330 but much broader in terms of pulses and it clearly corresponds to the peak found in the bright phase separations (Fig. 4d). A second peak occurs at 1150 pulses, which is little late to be simply periodic with the first peak, and later peaks show very little evidence of long-term coherence. We obtained the Fourier spectra of the PCF, which is shown in the inset diagram in Fig. 5b, indicating three periodic features at 540, 595 and 490 pulses, with the first dominating. The weighted sum of the three sine-waves is overlaid on the PCF but, in contrast to J17382330, the generated wave loses coherence beyond 1500 pulses as only the first two peaks are matched. Thus in J1752+2359, three sine waves are needed to yield just the two leading peaks of the PCF, in stark contrast to J17382330, where two sine waves were enough to match the entire observation. This suggests that the decomposition into sine waves has little physical significance in this pulsar.
It is indeed apparent in Figs. 1 and 4d that the bursts of J1752+2359 appear with a wide variety of unpredictable separations. Thus the superficial impression of quasi-periodicity is only maintained by the fact that that the separation of successive pulses is rarely less than 500 pulses, as is indicated by the PCF. At two and three burst separations, there seems little evidence of memory operating between bursts and even less of an underlying periodicity.
5 Pulse energy modulation in bright phases


PSR J17382330 exhibits bright phase structures of various lengths, consisting of short burst bunches interspersed with short nulls, as was first reported by Gajjar et al. (2012). The onset of a bright phase is relatively sudden for J17382330 with a strong burst pulse, which is followed by a change in the emission throughout the bright phase duration. This change is manifested by either a reduction in the intensity of single pulses or by an increase in the number and/or length of short null states, as can be seen in the three examples displayed in Fig. 6a. At the end of every bright phase, the pulsed emission clearly goes below the detection threshold and produces long null phase or off-phase. We extracted 120 pulses starting with the first identified burst pulse and averaged these over several bright phases to obtain averaged bright phase profile. A few bright phases in our observations were separated by less than 120 pulses from the next consecutive bright phase, hence they were not included in this analysis. The on-pulse energy averaged over 12 bright phases is shown in Fig. 7a, where a decline in the pulse intensity towards the end of the averaged bright phase is evident.


The onset of the bright phase in PSR J1752+2359 is more gradual, spanning typically 5 to 10 pulses. The decline in the intensity from its peak is also more striking, as was also reported by Lewandowski et al. (2004). Fig. 6b shows three examples of the decline in on-pulse energy during a bright phase in this pulsar. Note the absence of convincing null pulses during the decline. The on-pulse energy for 120 pulses, averaged from an equal number of bright phases (i.e. 12) as that for J17382330, is shown in Fig. 7b to illustrate the similarity of average bright phase on-pulse energy variations in the two pulsars.
This variation in the bright phase on-pulse energy is well modelled by a functional form given in equation 1 [also reported by Lewandowski et al. (2004)].
| (1) |
The average length of a bright phase can be derived from a least-squares fit to this functional form, as discussed in Appendix C. These were 864 pulses and 883 pulses for J17382330 and J1752+2359, respectively and are consistent with the histograms of bright phase lengths discussed in Section 3 (Figs. 4a and 4c, which were obtained from the visual inspection). The length of the individual bright phase for J1752+2359 was obtained in a similar manner. Out of 123 observed bright phases in J1752+2359, only 83, with higher signal-to-noise ratio (S/N) burst pulses, were fitted to obtain their lengths. We obtained the reduced in the range of around 0.6 to 2.2 for these fits. The average length of the bright phases from these measurements is 7720 pulses.

In the case of J1752+2359, we were able to investigate the nature of bright phases further due to their sufficient number in our 8 hours GMRT observations as well as in high S/N 30 minute observations with the Arecibo telescope. The on-pulse intensities of around 83 observed bright phases were fitted to the model given by equation 1 and their respective and were obtained. The log-log plot in Fig. 8 clearly displays a power law dependence of with . The fitted line in the Fig. 8 gives the power law index of around 0.740.04 incorporating the errors on both axes. The Kendalls tau rank order correlation between and is around 0.67 with a very small probability () of random chance. Thus in J1752+2359 bright phases with large peak intensities decay faster.
We also investigated the relationship between the separation between consecutive bright phases with the parameters of bright phase preceding and succeeding the null phase/off-phase under consideration. We plotted the and the of a bright phase as a function of the length of the off-phase preceding and succeeding it (not shown here). The lengths of the long off-phases were estimated as the number of pulses between the last and the first pulse of two consecutive bright phases (for example number of pulses between pulse numbers 2885 and 3421 in Fig. 11). We did not find any correlation as the parameters showed similar scatter for all lengths. Hence, bright phase parameters are independent of the length of the off-phase occurring before and after it.
The strong anti-correlation between and suggests that the area under the on-pulse energy envelope for a bright phase for J1752+2359 is constant. This area and its error can be estimated for the assumed model (equation 1), as discussed in Appendix C. These were calculated for the 83 observed bright phases and were the same, within errors, for all of them. This indeed confirms that the total intensity of bright phase is the same irrespective of its length or peak intensity and consequently, the total energy released during a bright phase is likely to be approximately constant.
6 First and Last bright phase pulse
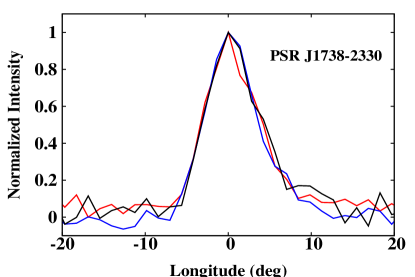
Compared with J1752+2359, J17382330 emits relatively strong individual pulses with high S/N during the entire span of its bright phases (as can be seen from Fig. 6a). Although the intensity of the J17382330’s pulses during a bright phase shows a decline towards its end, the energy of the last pulses are sufficiently above the detection threshold to identify them clearly. The first and the last pulse of 18 bright phases were combined to form the first-bright-phase-pulse profile and the last-bright-phase-pulse profile. Fig. 9a shows these profiles for J17382330 along with its average pulse profile. All these profiles look similar. A KS-test comparison, carried out between the first-bright-phase-pulse profile and the average pulse profile, indicates similar distributions with 94% probability. Similarly, a KS-test comparison between the last-bright-phase-pulse profile and the average pulse profile also suggests similar distributions with even higher probability of 99%. These results suggest that J17382330 switches back into the bright phase mode from the off-phase (and vice-versa) without any significant change in the emission. However, these results should be treated with caution due to the small number of pulses available in forming first-bright-phase-pulse profile and last-bright-phase-pulse profile.
For J1752+2359, only 114 out of 123 observed bright phases were used to obtain the first-bright-phase-pulse as the remaining were affected by RFI. The red solid line in Fig. 9b shows this profile. While the profiles look similar, a KS-test comparison between the first-bright-phase-pulse profile and the average pulse profile rejects the null hypothesis of similar distributions with 99% probability. The last pulse for most of the bright phases of J1752+2359 is very difficult to identify due to the decline in the pulse energy during this phase. Instead, a range of last pulses (10 to 20 pulses) were used for each bright phase to form the last-bright-phase-pulse profile. The length of each bright phase was determined with its associated error from the least-square-fit as explained in Appendix C. To obtain the last-bright-phase-pulse profile, we averaged a range of pulses within the error bars around the expected last pulse, obtained by adding the estimated length for every bright phase to the pulse number of its first pulse. The last-bright-phase-pulse profile averaged from 114 bright phases were compared with the average pulse profile using the KS-test, which rejected the null hypotheses of similar distributions with 99.9% probability. Fig. 9b shows the last-bright-phase-pulse profile with a significant ( 3 times off-pulse root-mean-square) component preceding the pulse and shoulder emission after the pulse. Neither of these features is present in its average profile.
7 Emission in the off-phase of PSR J1752+2359

In Section 3 we noted that, unlike J17382330, J1752+2359 exhibited intermittent single pulse bursts during the off-phase. Weak emission during an apparent null phase is not unknown Esamdin et al. (2005) and may question whether weak pulses are sometimes confused ‘true’ nulls. We therefore investigated this by forming the off-phase pulse profile by averaging all pulses between the bright phases. Those parts of the observations (about 15%), affected by the RFI, were excluded from this analysis. All the pulses in identified bright phases, amounting to around 9000 pulses, were separated from the remaining single pulse observations . The profile obtained from these pulses (i.e. bright phase pulse profile) is shown in Fig. 10a. The remaining 41,500 pulses, which occurred between the bright phases, were integrated to form the off-phase pulse profile. Surprisingly, the null-pulse profile showed weak emission with a significance of around 20 standard deviations () (Fig. 10b). It is therefore important to clarify whether this emission originates from bright but rare single pulses and/or from underlying weak emission.
In many nulling pulsars, the burst pulses are strong enough to create a bimodal intensity distribution and can then be separated by putting a threshold between the two peaks in the histogram Gajjar et al. (2012); Herfindal & Rankin (2007). PSR J1752+2359 does not show such a bimodal distribution due to the presence of many weak energy pulses (Fig. 2b). Hence, the use of any threshold will lead to a wrong identification of weaker burst pulses as nulls and result in a weak emission profile during the off-phase, as seen in Fig. 10b. This could be due to (a) weak emission throughout the off phase, (b) emission from weak burst pulses in the diminishing tail of a bright phase, or (c) emission from a few wrongly identified individual burst pulses during the off-phase.
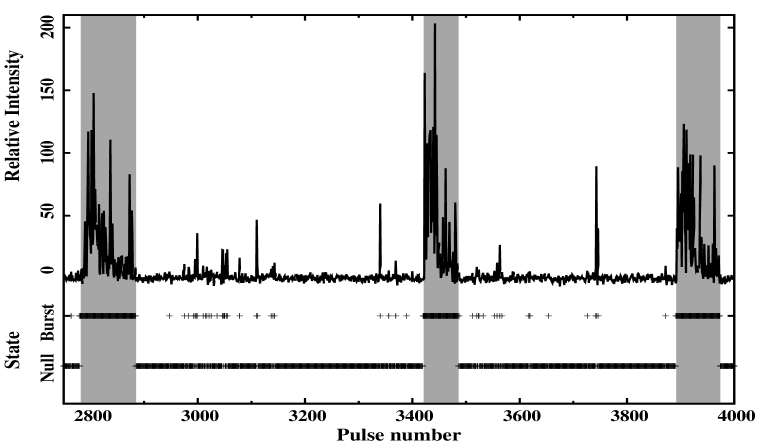
To distinguish between the above possibilities, we used higher S/N observations for this pulsar obtained from the Arecibo telescope. Fig. 11 shows a section of the observations from the Arecibo observation. The pulse energy plot clearly shows three bright phases with about 60 isolated single burst pulses occurring during the off-phase between them. This strongly supports our earlier suspicion that weak emission, seen during the off-phase in this pulsar, is due to these isolated burst pulses (i.e. pulses outside the bright phases or IBPs).
To investigate this further with GMRT observations, all pulses remaining after separating the bright phases were arranged in ascending order of their on-pulse energy. A threshold was moved from the high energy end towards the low energy end till the pulses below the threshold did not show an average profile with a significant (above 3) component. All the pulses below this threshold were tagged as null pulses. They were again visually checked for wrongly identified nulls due to presence of low level RFI. The average profile, obtained from all the pulses tagged as null after this procedure, is shown in Fig. 10c, indicating that tagged pulses are all nulled pulses, ruling out the possibility of weak emission throughout the null.
This method of identifying the IBPs was also used on the Arecibo observation. The null or the burst state for each individual pulse was identified and is shown in Fig. 11 in the bottom panel. It can be seen from this figure that IBPs are not localised near either the start or the end of a bright phase, but are distributed randomly inside the long off phase. In fact, these pulses may not be confined to off-phases and may occur at random through all phases since within a burst phase the their numbers would be small and not detectable. To the best of our knowledge, the presence of such pulses has not been reported in a pulsar before.
A random occurrence of IBPs implies that the rate of IBPs should remain constant. The Arecibo observation were short and hence statistical analysis of the IBP rate was not possible. Using GMRT observations we identified around 2700 such pulses, using the variable threshold method described above. As discussed in Section 5, the length of every bright phase was derived after fits to equation 1. An acceptable fit could not be obtained for a few bright phases due to either low pulse energy or due the presence of strong RFI. We only considered those off-phases bounded at both ends by bright phases, with acceptable fits. A few such off-phases were also affected by RFI and hence not included. The number of identified IBPs were counted for each off-phase and the IBP rate estimated using about 53 such off phases of various lengths. Fig. 12 shows a histogram of the number of IBPs for a given off-phase between two consecutive bright phases. The error bars on them were obtained from Poisson statistics. Fig. 12 clearly demonstrates that the number of IBPs are linearly correlated with the corresponding off-phase lengths. Hence, the IBP rate is independent of the length of a given null phase and could remain fixed throughout the entire emission of the pulsar.

8 Comparison of polarization profiles

We analysed the full polar observations from the Arecibo telescope, observed with 25-MHz bandwidth at 327-MHz. The bright phase pulses and the IBPs were separated from the observed single pulse observations and separate polarization profiles were obtained for both. Fig. 13 shows the total intensity profiles along with the linear and the circular polarization profiles for the bright phase pulses and the IBPs. The position angle swing was also measured for longitude bins where the observed linear polarization was more than 3 times the off-pulse rms in the linear polarization profile.
Fig. 13 shows striking differences between the intensity and polarization profiles of the bright phase pulses and the IBPs. The total intensity profile of the IBPs is clearly shifted to earlier phase with respect to that of bright phase. A KS-test comparison between these two profiles rejected the null hypothesis of similar distributions with 99.9% probability. The average intensity of the IBPs is around 5 to 7 times weaker than the average bright phase pulses. A Gaussian function was fitted on both the profiles to estimate the position of their peaks. The offset between the peaks in the total intensity profiles for bright phase pulses and the IBPs was estimated to be around 0.60.1∘. The linear polarization profile for the bright phase pulses is wider than that for IBPs and shows strong linear polarization of around 20% as compared to about 16% for IBPs. The shift in the position of peak intensity between these two profiles is not very significant. The circular polarization profile of the IBPs is offset from that of the bright phase pulses by 0.540.07∘. However, in contrast to the overall reduction in the pulse energy during the IBPs, the IBP circular polarization fraction shows a small increase compared to that for the bright phase pulses (circular polarization of 35% and 32%, respectively) as is also evident from Fig. 13.
9 Summary of results
| PSR J17382330 | PSR J1752+2359 | |
|---|---|---|
| Null Fraction (NF) | 85.1(2.3)% | 89% |
| Quasi-periodicities | 170 and 270 pulses | 540 (490,595) pulses |
| Coherence of quasi-periodicities | 2000 pulses (11 peaks) | 1000 pulses (2 peaks) |
| Variation in on-pulse energy during bright phase | Exponential decline with flickering nulls | Steady exponential decline |
| Length of bright phase | 86 4 pulses | 88 3 pulses |
| Separation between bright phases | 170 and 500 pulses | 570 pulses |
| Inter-burst pulses (IBPs) | No (?) | Yes; with a fixed random rate |
| First and last bright phase pulses | Similar to each other and to average profile | Distinct from each other and from average profile |
As we have stressed from the start, the superficial similarity in the emission patterns of J17382330 and J1752+2359 hides many differences. PSR J17382330 is the younger pulsar but with a stronger magnetic field, which has enabled it to spin down to a period five times longer than the older, but weaker, PSR J1752+2359 (see Table 1). Nevertheless, both have arrived at a point where their nulling fractions are greater than 80% and their bursts of emission are of similar length (measured in pulses) separated by long null sequences which give the overall appearance of being quasi-periodic (Fig. 1, Table 2).
However, detailed examination of the patterns of emission bursts reveals significant differences. Firstly, the burst separations of the younger pulsar J17382330 turn out to be underpinned by periodic behaviour. A histogram of the burst pulse separations (PCF in Fig. 5) could be modelled by the superposition of two near-harmonically related sine-waves and matched to the observations for at least 2000 pulses (i.e 11 burst phases). This is strong evidence of long-term memory in this pulsar. However, although the coherence of the sine waves is not lost, individual burst phases often fail to materialise except in some vestigial form. This can be seen as the effect of the stronger sine periodicity sometimes countered by the effect of the weaker near-harmonic (2:3) periodicity.
By contrast, in J1752+2359 there is no evidence of long-term periodicity. This pulsar requires a complex wave superposition to reproduce just the first two burst phase intervals in its pulse-separation histogram (Fig. 5b). Beyond about 1000 pulses, coherence is lost rapidly and there is no memory of any periodicity. The impression of quasi-periodicity is maintained since the burst separations usually range between 300 and 600 pulses (Fig. 4d).
Additionally, J1752+2359 has a striking feature not present in the younger pulsar – and hitherto not reported in any pulsar. In the long null intervals between the bursts of J1752+2359 the nulls are interrupted at random by burst pulses which are mostly single and relatively weak in intensity (IBPs). These pulses have a profile significantly shifted with respect to the main profile and different polarisation properties (Fig. 13), hinting at a different physical origin. They may well occur continuously through both burst and off-phases, providing a diffuse background to the pulsar’s more structured emission of bright and off-phases.
The bright phases of the pulsars, although similar in duration when measured in pulses, have different substructures. In J17382330, the bursts start suddenly and as they progress, they are increasingly punctuated by nulls until the off-phase begins (Fig. 6a). Thus the onset and the end of the bright phases are clearly marked, and profiles obtained by integrating first and last burst pulses are effectively identical to the pulsar’s overall profile (Fig. 9a). In J1752+2359, the bursts take longer to reach their peak emission, followed by an exponential decline in intensity. The bright phase fades with weak emission and it is often difficult to pinpoint its true end (Fig. 6b). There is evidence that an additional small leading component appears in the emission profile as the phase closes (Fig. 9b).
In both pulsars the progression of the intensity of their burst phases can, when averaged, be fitted by the same functional form (equation 1, see Fig. 7). In the case of J1752+2359, we find that individual bright phases with a higher peak intensity tend to be shorter in length with a significant anti-correlation (0.7) between these two parameters (Fig. 8), implying that the output in energy integrated over a bright phase is constant, at least at the observing frequency. Furthermore, the bright phase parameters are independent of the length of the off-phase before and after the bright phase.
10 Discussion and Conclusions
It has long been known that no strong correlations exist between NF and other pulsar parameters such as period or period derivative Ritchings (1976); Rankin (1986); Biggs (1992); Wang et al. (2007). This is also true here since, despite their similar NFs, the positions of PSRs J17382330 and J1752+2359 in the diagram could hardly be further apart. Furthermore, in this same diagram both are far from the so-called “death line” – contradicting a simple view that pulsars die through progressive increase in NF Ritchings (1976). However, what high NF pulsars do seem to have in common is that their individual null pulses do not appear at random with a single fixed probability. In fact, their few non-null pulses have a tendency to cluster in what we have called “bright phases”, even when these phases are separated by hours or even days Kramer et al. (2006); Li et al. (2012).
The simplest way of generating clusters of bright emission is to assume a two-state probability model, such that the probability of a null during a bright phase is fixed but lower than that during an off-phase Gajjar et al. (2012); Cordes (2013). This represents an elementary Markov (Poisson point) process and results in separate exponential distributions for the null and burst lengths, so that short nulls/bursts are very common and long nulls/bursts much less likely. This model has been plausibly applied to the null and burst statistics of several pulsars with low to medium NFs [see Figure 3 of Gajjar et al. (2012) and Figure 1 of Cordes (2013)]. In all these models burst/null clustering occurs and their power spectra show broad red features, but they do not generate quasi-periodic features.
However, in the case of the two pulsars described in this paper we have become convinced that neither of them has null/burst distributions which are exponential in form. This is most evident in the burst distribution of J1752+2359 (Fig. 3c), which appears to be bimodal, and when the IBPs are disregarded (as in Fig. 4c) a simple Gaussian-like distribution becomes clear. The same is true of the pulsar’s apparently exponential null distribution in Fig. 3d, which, on neglect of the IBPs, is transformed into a single hump in Fig. 4d. In J17382330, the burst/null distributions of Figs. 3a and 3b are superficially exponential, but we know them to partly consist of short bursts and nulls which arise exclusively during the bright phases, again meaning that the distribution is bimodal. When these short nulls/bursts are disregarded, as in Figs. 4a and 4b, a single-hump distribution is evident (in fact a double hump in the case of Fig. 4b for reasons given in Section 3). This line of reasoning is similar to that of Kloumann & Rankin (2010) in their study of the high NF pulsar B1944+17. They suggest that the shortest nulls of that pulsar are “pseudo-nulls”, which in fact integrate to a weak profile, leaving a hump-like distribution for the remaining nulls.
We are therefore forced to abandon the simple (Poisson point) assumption of a separate but fixed null probability for each of the two phases. Instead, we see that the probability of the length of time the two pulsars spend in their bright and off-phases is dependent on its respective Gaussian-like distribution. It is this which gives the pulse sequences their quasi-periodic character, as typical bright phase and off-phase alternate with lengths scattered around the means of their distributions.
Within this picture, the burst phases will not occur in precisely periodic sequences, but can be expected to gradually lose coherence as their separation varies randomly about a mean. This can be seen very clearly in the PCF of J1752+2359 (Fig. 5b), where coherence is lost after only two peaks. In J17382330, the typical burst phase separations are less and their distribution narrower (Fig. 4b), so we might expect coherence to persist for more peaks, as is indeed the case (Fig. 5a). However, the degree of coherence in this pulsar’s PCF is exceptionally high and we have been able to reproduce it well by combining just two near-harmonic underlying periodicities. This hints at the presence, at least in this pulsar, of forcing periodicities with suitable phase shifts Cordes (2013). How this is achieved physically is a matter of speculation. For example, these periodicities may arise from an external body Cordes & Shannon (2008) or neutron star oscillations Clemens & Rosen (2004) or near-chaotic switches in the magnetosphere’s non-linear system Timokhin (2010).
In both pulsars the bright phases themselves show clear evolution and therefore have some kind of internal memory (Figs. 6 and 7). Both diminish in intensity and J17382330 has an increasing number of null pulses as the burst proceeds. A decline of energy during a burst has been noted in several other pulsars. Recently, Li et al. (2012) have found that PSR J15025653 has long nulls interspersed with weakening bursts (their Figure 2) whose peak drifts as the burst develops. A similar phenomenon appears to occur in PSR J1819+1305 Rankin & Wright (2008) and Bhattacharyya et al. (2010) have also reported a gradual fall in pulse intensity before the onset of null states for PSR B081841. In other studies, Young et al. (2012) report intermittent long off-phases in PSR B0823+26 and their Figure 1 clearly shows a decline in intensity before null onset. In all cases it seems that the off-phases do not come out of the blue, so that the burst phase may represent a reset or relaxation of the magnetospheric conditions. It is clear that a change-of-state occurs when the pulsars move to the off-phase, quite possibly involving a global magnetospheric change Contopoulos et al. (1999); Contopoulos (2005); Timokhin (2010).
The appearance of random isolated pulses (IBPs) during the off-phase of J1752+2359, exhibiting a different integrated profile to the burst profile, has not been reported in other long-null pulsars. Its random nature is reminiscent of RRATs and the bright single pulses which appear in the weak mode of PSR B082634 Esamdin et al. (2005) or the RRAT phase of PSR J094139 Burke-Spolaor & Bailes (2010). We cannot know if this emission represents an additional property of the stable but intermittent off-phase magnetospheric state or whether it is a permanent background phenomenon such as accretion Wright (1979), which has a separate physical origin.
The differences in the statistics and the structure of the bright phases of PSRs J17382330 and J1752+2359 do not necessarily imply that the two pulsars produce nulls in a fundamentally different way. It is possible that through having a stronger surface magnetic field and a wider light cylinder J17382330 is somehow able to maintain near-periodic coherence for longer than J1752+2359 (considerably longer if measured in clock time rather than pulse numbers), and possible differences in the unknown inclinations of the pulsars’ dipole axes to their rotation axes may play a role Cordes & Shannon (2008). Our results suggest that pursuing in detail the “quasi-periodic” behaviour of any pulsar may well yield valuable physical clues to the nature of its magnetosphere and environment.
An earlier study of pulsars with low NFs Gajjar et al. (2012) found that the NF percentage was not predictive of a pulsar’s subpulse behaviour. Our detailed study of PSRs J17382330 and J1752+2359 has shown that pulsars with very similar, but high, NFs can also have subtle but important differences in emission.
11 Acknowledgements
We would like to thank the staff of the GMRT and NCRA for providing valuable support in carrying out this project. The authors also thank Joanna M. Rankin for sharing the calibrated polarization observations for PSR J1752+2359 with us. VG would like to thank Dipanjan Mitra for valuable discussion regarding the Arecibo data analysis and nulling in general. The authors are grateful to the referee for a critical review of the paper and suggesting several improvements in the manuscript. BCJ thanks A. Timokhin for very useful discussions on different magnetospheric states. GW thanks the University of Sussex for a Visiting Research Fellowship.
References
- Backer (1970) Backer D. C., 1970, Nat., 228, 42
- Bhattacharyya et al. (2010) Bhattacharyya B., Gupta Y., Gil J., 2010, MNRAS, 408, 407
- Biggs (1992) Biggs J. D., 1992, ApJ, 394, 574
- Burke-Spolaor & Bailes (2010) Burke-Spolaor S., Bailes M., 2010, MNRAS, 402, 855
- Clemens & Rosen (2004) Clemens J. C., Rosen R., 2004, ApJ, 609, 340
- Contopoulos (2005) Contopoulos I., 2005, A&A, 442, 579
- Contopoulos et al. (1999) Contopoulos I., Kazanas D., Fendt C., 1999, ApJ, 511, 351
- Cordes (2013) Cordes J. M., 2013, ApJ, 775, 47
- Cordes & Shannon (2008) Cordes J. M., Shannon R. M., 2008, ApJ, 682, 1152
- Ershov & Kuzmin (2005) Ershov A. A., Kuzmin A. D., 2005, 443, 593
- Esamdin et al. (2005) Esamdin A., Lyne A. G., Graham-Smith F., Kramer M., Manchester R. N., Wu X., 2005, MNRAS, 356, 59
- Foster et al. (1995) Foster R. S., Cadwell B. J., Wolszczan A., Anderson S. B., 1995, ApJ, 454, 826
- Gajjar et al. (2012) Gajjar V., Joshi B. C., Kramer M., 2012, MNRAS, 424, 1197
- Herfindal & Rankin (2007) Herfindal J. L., Rankin J. M., 2007, MNRAS, 380, 430
- Joshi et al. (2004) Joshi B. C., Kramer M., Lyne A. G., McLaughlin M. A., Stairs I. H., 2004, in F. Camilo & B. M. Gaensler ed., Young Neutron Stars and Their Environments Vol. 218 of IAU Symposium, Giant Pulses in Millisecond Pulsars. pp 319–+
- Kinkhabwala & Thorsett (2000) Kinkhabwala A., Thorsett S. E., 2000, ApJ, 535, 365
- Kramer et al. (2006) Kramer M., Lyne A. G., O’Brien J. T., Jordan C. A., Lorimer D. R., 2006, Science, 312, 549
- Lewandowski et al. (2004) Lewandowski W., Wolszczan A., Feiler G., Konacki M., Soltysi’nski T., 2004, ApJ, 600, 905
- Li et al. (2012) Li J., Esamdin A., Manchester R. N., Qian M. F., Niu H. B., 2012, MNRAS, 425, 1294
- Lorimer et al. (2006) Lorimer D. R., Faulkner A., Lyne A. G., Manchester R. N., Kramer M., McLaughlin M. A., Hobbs G., Possenti A., Stairs I. H., Camilo F., Burgay M., D’Amico N., Corongui A., Crawford F., 2006, MNRAS
- Manchester et al. (2005) Manchester R. N., Hobbs G. B., Teoh A., Hobbs M., 2005, 129, 1993
- Pimbley & Lu (1985) Pimbley J. M., Lu T. M., 1985, J. Appl. Phys, 57, 1121
- Rankin (1986) Rankin J. M., 1986, ApJ, 301, 901
- Rankin & Wright (2008) Rankin J. M., Wright G. A. E., 2008, MNRAS, 385, 1923
- Rankin et al. (2013) Rankin J. M., Wright G. A. E., Brown A. M., 2013, MNRAS, 433, 445
- Ritchings (1976) Ritchings R. T., 1976, MNRAS, 176, 249
- Roy et al. (2010) Roy J., Gupta Y., Pen U.-L., Peterson J. B., Kudale S., Kodilkar J., 2010, Experimental Astronomy, 28, 25
- Staelin & Reifenstein (1968) Staelin D. H., Reifenstein III E. C., 1968, 162, 1481
- Swarup et al. (1991) Swarup G., Ananthakrishnan S., Kapahi V. K., Rao A. P., Subrahmanya C. R., Kulkarni V. K., 1991, Current Science, 60, 95
- Timokhin (2010) Timokhin A. N., 2010, MNRAS, 408, L41
- Wang et al. (2007) Wang N., Manchester R. N., Johnston S., 2007, MNRAS, 377, 1383
- Wright (1979) Wright G. A. E., 1979, Nature, 280, 40
- Young et al. (2012) Young N. J., Stappers B. W., Weltevrede P., Lyne A. G., Kramer M., 2012, MNRAS, 427, 114
Appendix A No Giant pulses from PSR J1752+2359
PSR J1752+2359 is one of the few pulsars which shows giant pulses (GPs) at 111-MHz. The energy of these GPs was reported to be 200 times the energy of the mean pulse Ershov & Kuzmin (2005). Our observations show only a gradual distribution up to 20 times the mean pulse energy (Fig. 2a). We separated all single pulses with S/N greater than 5 and estimated the mean pulse energy from these well defined burst pulses. The distribution of on-pulse energies of all burst pulses, scaled by this mean pulse energy is shown in Fig. 14, indicating that these are distributed only up to 5 times the mean pulse energy, which is significantly lower than that reported by Ershov & Kuzmin (2005) at 111-MHz. In the earlier studies of GPs Staelin & Reifenstein (1968); Kinkhabwala & Thorsett (2000); Joshi et al. (2004) it was reported that (a) GPs have significantly smaller pulse widths compared to average pulses and (b) GPs tend to occur mostly at the edge of the average pulse profile. We separated the strongest pulses to compare their widths with that of the average pulses and no significant difference was found. While the profile for IBPs is slightly narrower and shifted towards the leading edge, their intensities are 5 to 7 times weaker than the average bright phase pulses. If the IBPs have different spectral behaviour compared to bright phase pulses, then it is likely that they may give rise to GPs at 111-MHz. However, this needs to be tested with simultaneous observations at both frequencies. Hence, it can be concluded from our observations that J1752+2359 does not show GPs at 325-MHz.

Appendix B The Pair Correlation Function
The Pair Correlation Function (PCF) is a probability density function (also known as the radial distribution function or pair separation function) for the clustering of certain objects or events in space and/or time coordinates Pimbley & Lu (1985) and is useful for measuring the degree of packing. We have used a one-dimensional PCF, which identifies the clustering of events (the bursts pulses of a bright phase in our case), in the time series data. A brief description is provided here as this seems to be the first time such a technique is applied the clustering of burst pulses in pulsar astronomy.
The PCF for a series M pulses with N burst pulses can be derived as follows. The pulse index of these burst pulses are
| (2) |
Then, PCF is defined as
| (3) |
where G is a scaling parameter and is the Kronecker delta function. A normalized binning of PCF, g(p), provides the probability of occurrence of certain separations between burst pulses. If a pulsar exhibits bunching of burst pulses and periodic occurrence of these bunches, the PCF shows prominent peaks around repeatedly occurring separations and their harmonics. A simple way to detect such periodicities is to obtain the Fourier spectra of the PCF.
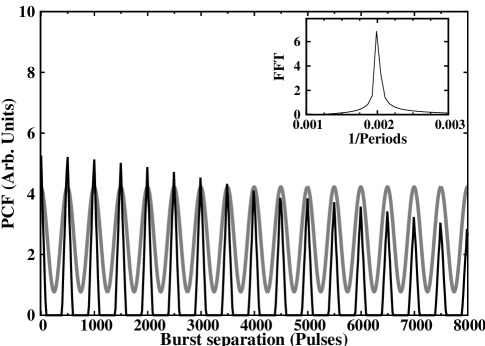
Fig. 15 shows an example of the PCF obtained for 8000 pulses of a pulsar nulling with a precise periodicity. The pulsar was simulated by repeated occurrence of 100 burst pulses separated by 400 null pulses, so the NF was 80 %. The periodicity is clearly visible both in the PCF and in the Fourier spectra in the inset figure. The peaks in PCF are at 500 pulses, broadened by the 100 pulse spread.
The PCF measures not only the periodicity of the clustering but also how long its coherence persists. If coherence in the bunching is lost, the PCF would not show peaks beyond a particular length. This makes it superior to a simple Fourier analysis of the pulse energy modulation since a PCF emphasises short-lived periodic features as well as providing information regarding the coherence length. An additional advantage over conventional Fourier analysis is that observations from different sessions can be combined. The maximum coherence length measurable in this case will come from the session with the longest pulse sequence among all the observing sessions. Hence, the PCF is a useful technique to scrutinize periodic pulse energy fluctuations.
Appendix C Modelling of on-pulse energy variations in bright phases
Our analysis of J1752+2359 clearly shows that on-pulse energy for most of the individual bright phases follows the model given by equation 4. PSR J17382330 also has a similar average on-pulse energy variation for its bright phases.
| (4) |
Here, is a scaling parameter and is the decay time-scale. The values for and were obtained by a least-square-fit of function 4 to the on-pulse energy in a bright phase with errors on each energy measurement given by off pulse rms. The length of a given bright phase was defined as the difference between the two points where crosses of 10% of the . It can be shown that is given by . So the points where the attains 10% of the peak value (i.e. ) are given by
| (5) |
attains these values on both sides of the peak position and these points can be determined by solution of equation 5, obtained using numerical methods and the difference between these two points was defined as the length of a given bright phase (i.e. = ). It can be seen from equation 5 that values of and do not depend upon . To quantify the dependence of the bright phase length on , we solved equation 5 for a range of values. We found that the length of a given bright phase is related to as
| (6) |
The error on L is given by
| (7) |
The area for the on-pulse energy variation in a bright phase is given by
| (8) |
and the error in the obtained area is given by
| (9) |