The dynamic X-ray nebula powered by the pulsar B1259–63
Abstract
We present observations of the eccentric -ray binary B1259–63/LS 2883 with the Chandra X-ray Observatory. The images reveal a variable, extended (about , or times the binary orbit size) structure, which appears to be moving away from the binary with the velocity of 0.05 of the speed of light. The observed emission is interpreted as synchrotron radiation from relativistic particles supplied by the pulsar. However, the fast motion through the circumbinary medium would require the emitting cloud to be loaded with a large amount of baryonic matter. Alternatively, the extended emission can be interpreted as a variable extrabinary shock in the pulsar wind outflow launched near binary apastron. The resolved variable X-ray nebula provides an opportunity to probe pulsar winds and their interaction with stellar winds in a previously inaccessible way.
Subject headings:
pulsars: individual (B1259–63); outflows1. Introduction
Recent advances in -ray instrumentation have led to the discovery of GeV and TeV emission from a handful of high-mass X-ray binaries. Most of these binaries appear to be either wind accreting or colliding wind binaries in which a compact object (a neutron star or a black hole) is orbiting an early-B or late-O type massive companion (Dubus, 2013). However, for most of these high-mass -ray binaries (HMGBs) the energy release mechanism and the type of compact object are unknown. It is possible that systems with a young pulsar orbiting a massive star may dominate the population of HMGBs (Dubus, 2013). In these HMGBs most of the high energy emission is believed to be produced at the shock located between the pulsar wind and the massive-star wind. Although the spatially-integrated multiwavelength spectra and variability have been the subject of multiple studies (Dubus, 2006; Dubus et al., 2008; Zdziarski et al., 2010; Zabalza et al., 2013; Bednarek & Sitarek, 2013), they only provide indirect diagnostics of the complex wind interaction. Theoretical models suggest that the shocked flow can be accelerated to relativistic velocities, forming a spiral which might then be disrupted by instabilities (Dubus, 2006; Bogovalov et al., 2008; Bosch-Ramon & Barkov, 2011; Bosch-Ramon et al., 2012). These predictions are yet to be verified observationally because it is challenging to achieve the high angular resolution required to directly resolve the structure of the interacting winds in these systems. Some recent intriguing evidence of extended emission comes from VLBI observations which indicate variable, subarcsecond-scale structures in a few known HMGBs (Moldón et al., 2013, 2012).
The only HMGB in which the compact source has been detected as a radio pulsar (Johnston et al., 1992) is B1259–63/LS 2883 (hereafter B1259). The radio pulsations are seen during a large fraction of the 3.4 yr orbital period, but they disappear for about four weeks (Johnston et al., 2005) when the pulsar is moving through the dense wind of its massive companion around periastron. It is possible that other HMGBs, whose orbits are more compact, also host young pulsars which cannot be seen in the radio because the radio emission is blocked by the dense stellar wind. Studying the high-energy emission from B1259 allows one to probe the properties of both the massive-star and pulsar winds and study the mechanisms of their interaction. In particular, the pulsar wind properties can be studied in a regime inaccessible in observations of isolated pulsars. In this paper we report the discovery of variable extended X-ray emission around B1259 and discuss the implications for colliding wind models of such binaries for the theory of pulsar winds and for the nature of high-energy emission in HMGBs.
The radio pulsar PSR B1259–63 has the following properties: period ms, characteristic age kyr, spin-down power erg s-1, magnetic field G, and distance kpc (Johnston et al., 1992). The orbit of the B1259 binary is highly eccentric (), with semimajor axis AU, period d, and inclination (Negueruela et al., 2011; Shannon et al., 2013). The massive companion, a fast-rotating late O-type star with a luminosity (Negueruela et al., 2011), has an equatorial excretion disk and is a source of a strong stellar wind. The disk is thought to be inclined to the orbital plane at an angle of (Melatos et al., 1995). X-ray and radio data suggest that the pulsar passes through the disk during time intervals of days before periastron and days after periastron (Chernyakova et al., 2006).
It has been known from multiple observations that the X-ray flux and spectrum of B1259 vary with the orbital phase (Chernyakova et al., 2009), but no X-ray pulsations with the pulsar’s period have been detected (Chernyakova et al., 2006). This and the relatively high X-ray luminosity of B1259, compared to isolated pulsars with similar parameters, suggest that the observed X-ray emission is mainly caused by the collision of the pulsar wind with the massive companion wind, which produces a shock whose properties are modulated with the orbital period in this highly eccentric binary. Although most of the X-ray emission is likely generated within the binary and in its immediate vicinity, the shocked matter blown out from the binary can be visible at larger distances in high-resolution observations.
Extended radio emission of 10–50 mas (–120 AU) size has been detected near periastron of B1259 and interpreted as synchrotron radiation of shocked pulsar wind ejected from the binary (Moldón et al., 2011). Such a size is too small to be resolved in X-ray observations, which can, however, probe the blown-out matter at larger distances.
The only previous high-resolution X-ray image of B1259–63 was obtained in a 28 ks Chandra X-ray Observatory (CXO) observation carried out on 2009 May 14, when the pulsar was very close to apastron. Very faint, amorphous, asymmetric extended emission (up to south-southwest from the pulsar position) was detected at a confidence level (Pavlov et al., 2011). This emission was tentatively interpreted as a pulsar wind nebula (PWN) confined by a shock between the two winds and ultimately blown out from the binary by the wind of the massive companion. Here we report the results of two deeper CXO observations.
2. Observations and Data reduction
We observed B1259 with the Advanced CCD Imaging Spectrometer (ACIS) on board CXO on 2009 May 14, 2011 December 17, and 2013 May 19 (see Table 1 for ObsIDs and MJD dates). As the first observation was already analyzed and the results were published (Pavlov et al., 2011), we only refer to it as needed to supplement our analysis and discussion of the results of the last two observations. Details of the binary phases and exposure times are listed in Table 1.
The target was imaged on the front-illuminated ACIS-I3 chip, in timed exposure mode. We used ‘very faint’ (VFAINT) telemetry format to reduce the detector background and optimize the sensitivity for the faint extended emission. A 1/8 subarray was used to reduce the Frame Time to 0.4 s and mitigate the effect of pile-up. The highest count rate (see Table 1) corresponds to the pile-up fraction of %111See http://cxc.harvard.edu/proposer/POG/html/chap6.html and hence can be neglected.
For our analysis we downloaded the pipeline-produced Level 2 event files, which have been cleaned of various artifacts. No episodes of anomalously high background rates occurred in the observations. No randomization was applied to the event positions in the Level 2 event files we used. To further improve the accuracy of the event positioning, the Energy-Dependent Subpixel Event Repositioning (EDSER) procedure was applied during the pipeline processing222See http://cxc.harvard.edu/ciao4.4/why/acissubpix.html . Below we consider only events with energies 0.5–8 keV in order to minimize the background contribution.
The detector responses for spectral analysis were produced with CIAO tools, following the standard procedure and using the calibration database CALDB 4.4.1. Spectral fitting was done for 0.5–8 keV with CIAO’s Sherpa modeling and fitting package.
| ObsID | MJD | aafootnotemark: | bbfootnotemark: | Exp.ccfootnotemark: | Ctsddfootnotemark: | eefootnotemark: | fffootnotemark: | ggfootnotemark: | hhfootnotemark: | dof | ||
|---|---|---|---|---|---|---|---|---|---|---|---|---|
| deg | days | ks | cgs | cgs | cm-2 | arcsec2 | ||||||
| 10089 | 54965 | 182 | 667 | 25.6 | 1825 | 139(5) | 158(6) | 1.5(7) | 1.51(10) | 2.3(3) | 2.5 | 20.9/30 |
| 61 | 2.8(13) | 3.1(13) | 1.5∗ | 1.3(5) | 0.039(16) | 22.1 | 3.1/9 | |||||
| 14205 | 55912 | 169 | 370 | 56.3 | 6551 | 249(4) | 296(5) | 2.9(3) | 1.39(5) | 3.8(2) | 2.5 | 76.6/87 |
| 343 | 7.5(8) | 9.1(9) | 2.9∗ | 1.49(17) | 0.13(2) | 22.1 | 21.2/16 | |||||
| 14206 | 56431 | 192 | 886 | 56.3 | 4162 | 137(5) | 176(7) | 3.1(3) | 1.68(6) | 3.07(2) | 2.5 | 146/169 |
| 144 | 3.3(5) | 3.9(6) | 3.1∗ | 1.4(3) | 0.051(14) | 12.8 | 7.1/13 |
3. Data Analysis
3.1. Image Analysis
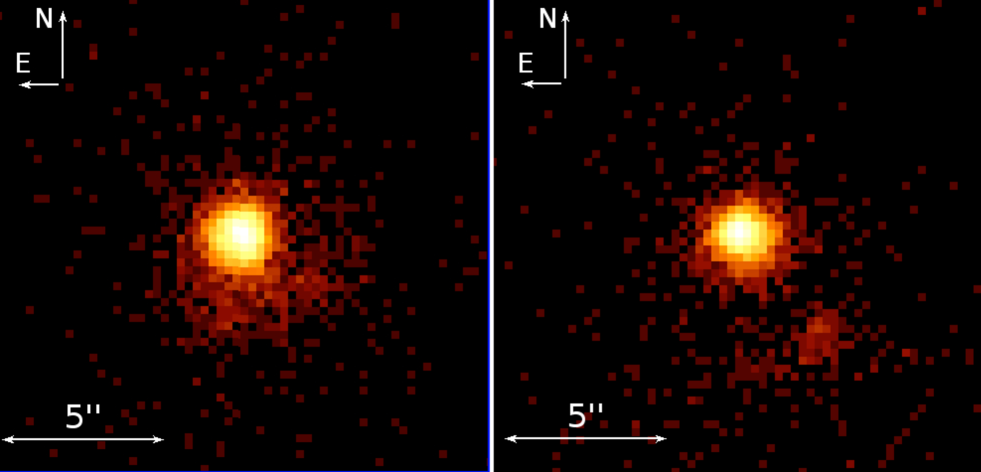
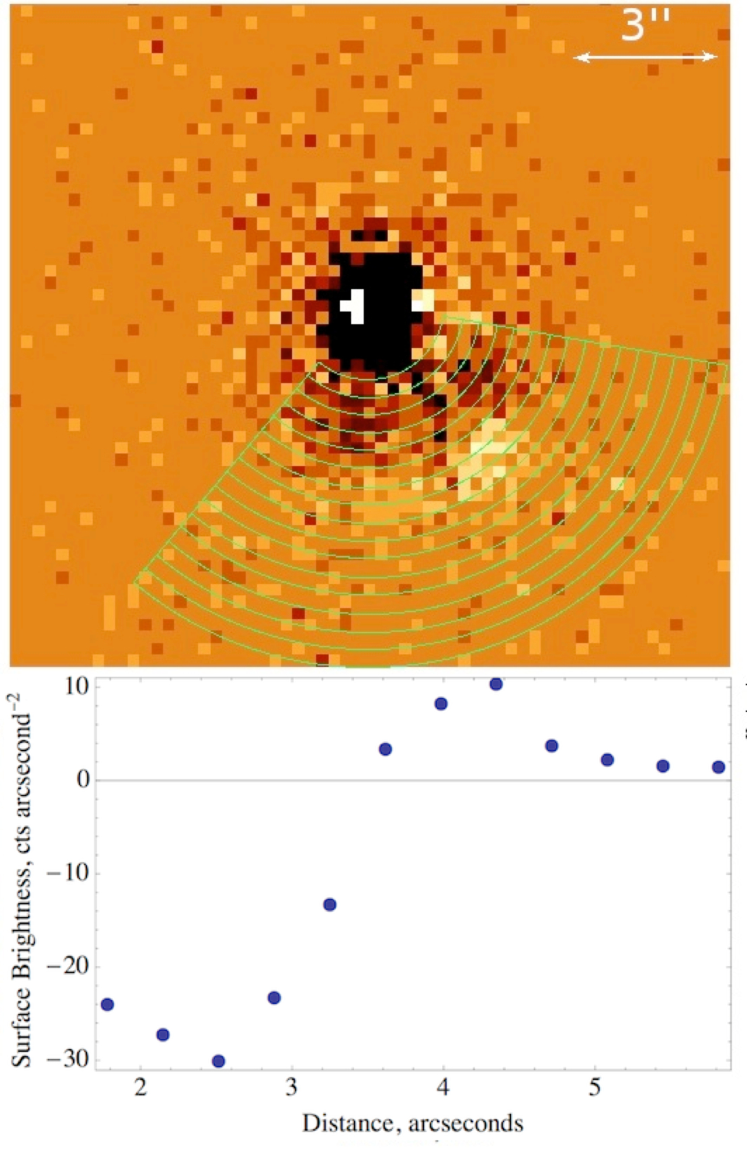
The exquisite angular resolution of CXO reveals the diffuse X-ray emission which is clearly seen to up to from the binary (Figure 1). Moreover, the appearance of the extended emission changed dramatically between the two observations which occurred 248 days before and 268 days after the apastron passage (see Figure 2). While the diffuse emission looks like a southward extension of the point-like source in the first observation, it is clearly detached from the compact source in the second observation. This change appears as an outward motion of an arc-like structure which is particularly well seen in the difference image shown in Figure 3. The shift in the position of the arc-like structure corresponds to the proper motion arcsec yr mas day-1 and the projected velocity at the distance of 2.3 kpc. If the extended emission detected in the two observations were emitted by the same object moving with a constant velocity, this object left the binary days before the second observation, i.e., somewhere around the apastron passage in the previous binary cycle.
3.2. Spectral analysis
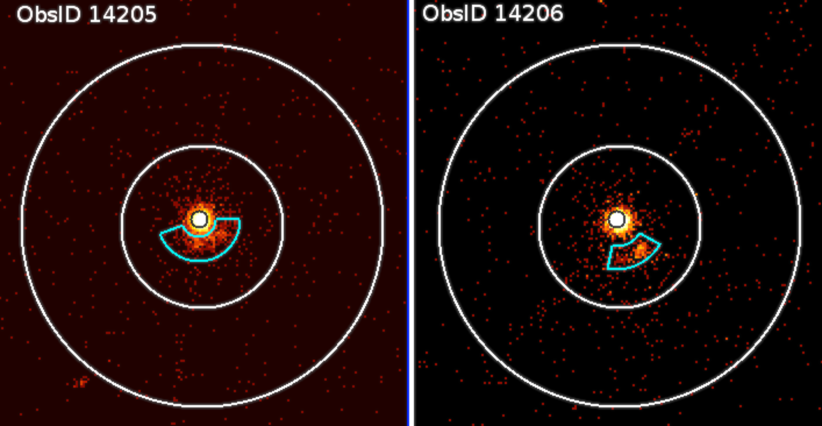
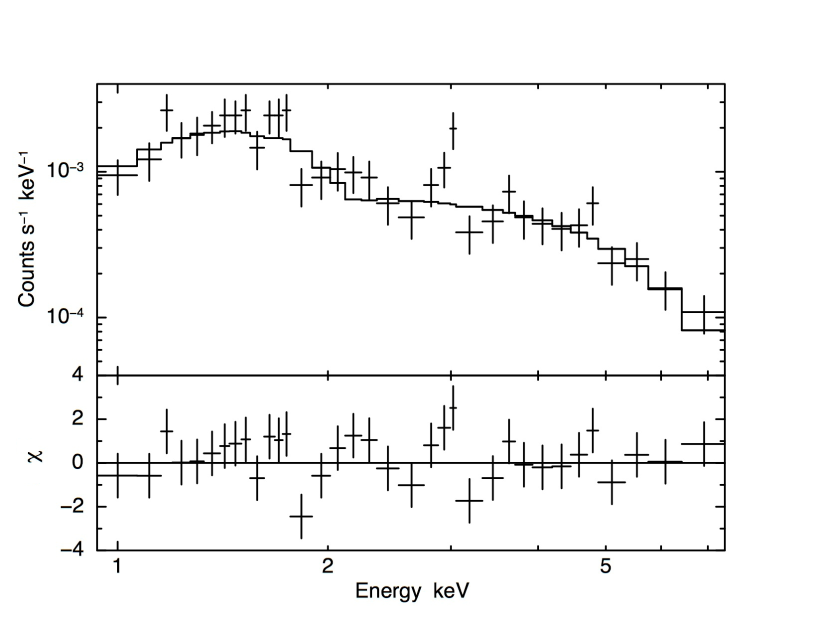
The regions used for spectral extraction in ObsIDs 14205 and 14206 are shown in Figure 4. For completeness we also re-extracted the ObsID 10089 spectra using exactly the same extraction regions as for ObsIDs 14205. We then binned the spectra and fit each of them to an absorbed power-law (PL) model with the interstellar absorption cross sections from Morrison & McCammon (1983). For each observation the extended emission spectra were fit with the extinction column fixed at the value found for the the core component (within ; includes the pulsar and unresolved PWN) in the same observation. An example of the extended emission spectrum (from ObsID 14205) is shown in Figure 5.
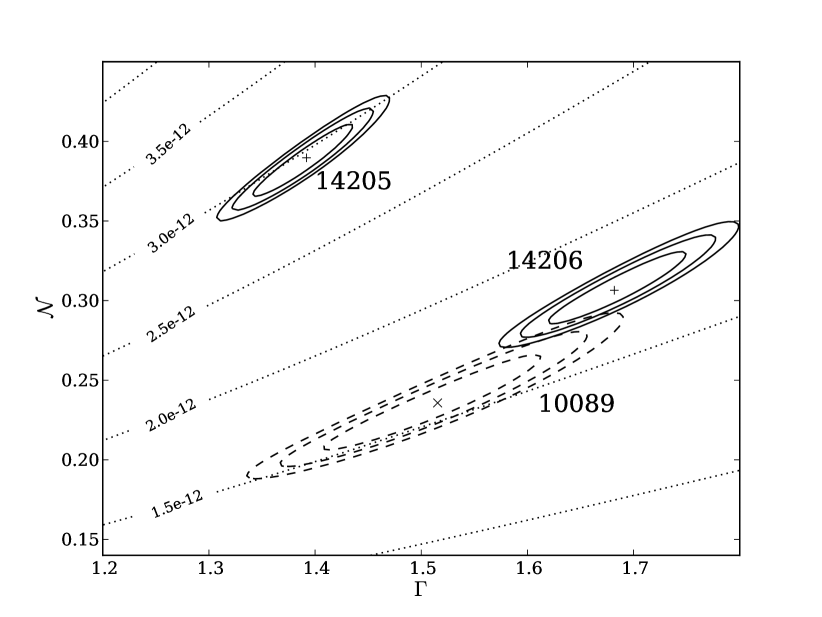
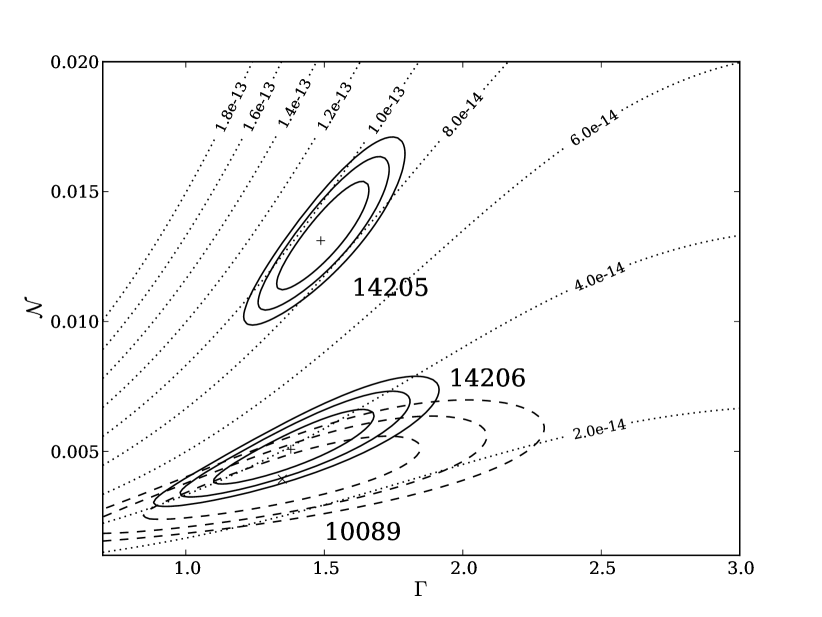
The fitting parameters the two observations are presented in Table 1 and Figure 6. The best-fit photon indices, –1.5, of the extended emission are similar to those obtained for PWNe around isolated pulsars (Kargaltsev & Pavlov, 2008). The quality of the fit to the spectrum of the extended emission from the 2011 observation (see Fig. 5) is not perfect ( for 16 degrees of freedom), but this can be explained by the noise fluctuations due to small number of counts. The 0.5–8 keV luminosities of the extended structures, on the order of erg s-1, are small fractions (2%–3%) of the compact source luminosity.
The brightness of the core and extended emission components, and the spectral slope for the core emission show appreciable variations. The absorbed flux of the extended emission was brighter by a factor of in the 2011 observation (ObsID 14205) compared to the 2009 and 2013 observations while the PL slope of the core component became steeper by in 2013 compared to 2011. At the same time no statistically significant spectral changes are measured for the extended emission in all three observations. The limited number of counts also does not allow us to say whether the spectrum of the extended emission differs from that of the core component. The changes in the core flux agree with those reported from multi-year observations at low angular resolution (Chernyakova et al., 2009).
The spectra of the extended emission also fit the thermal plasma model (vmekal ), with high plasma temperatures (best-fit keV, the upper boundary is unconstrained, the lower limit is keV), for which the plasma radiation is dominated by thermal bremsstrahlung. The vmekal normalization of cm-5 corresponds to the number density of cm-3, assuming solar abundances and the emitting volume cm3, where . The quality of these fits is similar to that of the PL fits.
4. Discussion
The observed extended X-ray emission is clearly asymmetric with respect to the binary while the resolved size and separation from the binary greatly exceed the size of the binary orbit. It does not resemble the flow structures expected in such systems based on the current models (Dubus, 2006; Bogovalov et al., 2008; Bosch-Ramon & Barkov, 2011; Bosch-Ramon et al., 2012).
The location and the shape of the intrabinary shock depend on the momentum fluxes of the winds and their angular distributions. As we know from observations of PWNe of isolated pulsars, the pulsar wind is predominantly concentrated around the pulsar’s equatorial plane. If this plane coincides with the orbital plane, and the high-mass companion wind is nearly isotropic, the location of the contact discontinuity, separating the shocked winds on the line connecting the two stars (the stagnation point) is at the distance from the pulsar, where is the separation between the binary companions, is the ratio of the momentum fluxes of the pulsar wind and stellar wind at the half-distance between the pulsar and the star, is the mass-loss rate of the high-mass companion, is terminal wind velocity, and is the half-opening angle around the equatorial plane into which the pulsar’s wind is blowing ( for an isotropic wind). At the stellar wind wraps around the pulsar and collimates the pulsar wind into a diverging tail directed away from the high mass companion, creating a spiral pattern due to the pulsar’s orbital motion (Dubus, 2006), which mixes with the denser stellar wind at the contact discontinuity via Kelvin-Helmholtz instabilities (Bosch-Ramon & Barkov, 2011). At the pulsar wind takes over and collimates the stellar wind within a shock of a complex shape. According to Martins et al. (2005) and Puls et al. (2008), late-type O stars with produce “weak” winds, with yr-1 and – km s-1. Therefore, for the nearly isotropic polar component of the LS 2883 wind, the parameter is on the order of unity or even larger.
The PL spectrum of the resolved extended emission could be interpreted as synchrotron emission of the shocked pulsar wind, while the thermal plasma emission could be produced by the massive companion wind heated to X-ray temperatures by the interaction with the energetic pulsar wind (e.g., in oblique shocks and instabilities; Bosch-Ramon & Barkov 2011; Bosch-Ramon et al. 2012) and ejected from the system. The latter possibility, however, requires a very large mass of the ejected plasma cloud, g, where cm-3 is the proton number density estimated from the spectral fit (see Section 3.2). This mass is much larger than g lost by the high-mass companion wind during the whole orbital period. Therefore, we conclude that thermal emission from the heated O-star ejecta alone cannot explain the observed extended X-ray emission.
The other possible interpretation could be synchrotron emission from pulsar wind particles. Using standard formulae for synchtrotron radiation (e.g., Ginzburg & Syrovatskii 1965; Pacholczyk 1970), we can estimate the Lorentz factors of the emitting electrons as . One can also express the magnetic field in a synchrotron-emitting region in terms of observable parameters (Pavlov et al., 2003):
| (1) |
Here is the ratio of the magnetic field energy density to the energy density of the relativistic particles, photons (s cm2 keV arcsec2)-1 is the average spectral surface brightness at keV (see Table 1), is the normalization of photon spectral flux measured from the area (in arcsec2), cm is the average length of the radiating region along the line of sight, , , and are the lower and upper energies of the photon PL spectrum (in keV), and , and are the numerical coefficients whose values depend on the slope of the electron PL spectral energy distribution (Ginzburg & Syrovatskii 1965). Taking , , and values from Table 1, and assuming (equivalent to at kpc), we obtain G for the extended emission seen in the 2011 and 2013 observations (for keV, keV). Note that for the measured – the magnetic field dependence on the (unknown) values of and is extremely weak (e.g., expanding the energy range by five orders of magnitude up and down increases the magnetic field value by a factor of 1.6). The lower limit on magnetic field can be obtained by requiring the electron Larmor radius to be smaller than the transverse size () of the arc-like extended emission seen in the 2013 image, G (which implies ). The corresponding magnetic and electron energies are erg and erg, respectively, in the volume cm3. The total energy, , in the emitting volume is much smaller than the energy lost by the pulsar spin-down during one orbital period, , in a broad range of magnetization parameter, , which means that the cloud energy can be supplied by the pulsar in a fraction of the binary period. In the following subsections we describe two scenarios that could explain the origin of the extended synchrotron-emitting structure.
4.1. Fast moving cloud ejected from the binary.
The first scenario assumes that we observed the same cloud in December 2011 and May 2013, which had been moving with the average velocity since the launch. However, if such a cloud is created and ejected from the binary in the course of interaction of the pulsar wind with the dense excretion disk close to the nearest preceding periastron (i.e., about one year before the first observation), it should decelerate very rapidly. The drag force exerted on the light, fast-moving cloud by the ambient medium is very large: , where cm2 is the frontal area of the cloud, and is the ambient density. The deceleration caused by this force can be estimated as cm s-2, where erg is the total (particle and magnetic field) energy in the emitting volume. The characteristic deceleration time is then s. This means that if the circumbinary medium is filled with the stellar wind of the high-mass companion, the cloud of relativistic electrons would be decelerated and/or destroyed in a time much shorter than the interval of 519 days between our two observations. The deceleration time could be larger if the cloud is loaded with a substantial amount of the O-star wind. For instance, it will exceed the apparent travel time from the binary, d, if g, which still requires a rather low ambient density, cm-3, to be consistent with the mass and energy budget. Therefore, this scenario seems rather unlikely. The drag force could be much smaller if the matter ahead of the cloud is mostly comprised of the pulsar wind particles and is moving away from the binary with a high velocity. The presence of such a lepton-dominated medium would be more plausible on the apastron side of the orbit where the pulsar spends most of the time. Overall, the moving cloud scenario seems to require somewhat artificial assumptions, but it cannot be firmly ruled out without further investigation (e.g., another CXO observation could confirm or rule out the translational motion of the cloud).
4.2. Varibale extrabinary termination shock
In the second scenario, which we consider more plausible, the extended structures are formed at the extrabinary termination shock in the pulsar wind at large distances from the binary, comparable to those observed in PWNe around isolated pulsars (Kargaltsev & Pavlov, 2008), so that the different locations of the structures in December 2011 and May 2013 are due to different conditions at the epochs of their formation, rather than to the motion of a cloud of relativistic electrons from the binary.
Formation of such a distant termination shock can be understood as follows. In a high mass binary the pulsar’s wind collides with the companion’s wind and forms a double-shock structure within the binary and in its vicinity (Tavani & Arons, 1997). If the pulsar wind is dynamically dominant, it escapes freely in the directions away from the high-mass companion and, similar to an isolated pulsar wind, shocks in the ambient medium at a distance , where the wind’s ram pressure becomes comparable to the ambient pressure, . Synchrotron radiation from the shocked pulsar wind can be observed as an extrabinary PWN. As the pulsar orbits the heavy companion, this extrabinary shock rotates around the binary, seeding the medium with X-ray emitting relativistic electrons (positrons). If their cooling time is larger than the orbital period, one can expect a uniformly bright extended structure to form around a circular binary at distances ; such a structure would be brighter on the apastron side for an eccentric binary because the pulsar spends more time around apastron than around periastron. The location of the structure can vary due to variations in the ambient pressure or because of instabilities that can destroy the contact discontinuity, separating the two winds, and mix the stellar wind matter into the pulsar wind.
The extended X-ray structures detected near the B1259 binary could be associated with such an extrabinary termination shock formed at a distance cm, where dyn cm-2. The corresponding angular separation from the binary, (where is the angle between the line of sight and the line connecting the binary and the emitting region) is close to the observed separations of the detected extended structures at . Such high pressures are possible in wind-blown bubbles around massive stars (van Marle et al., 2004).
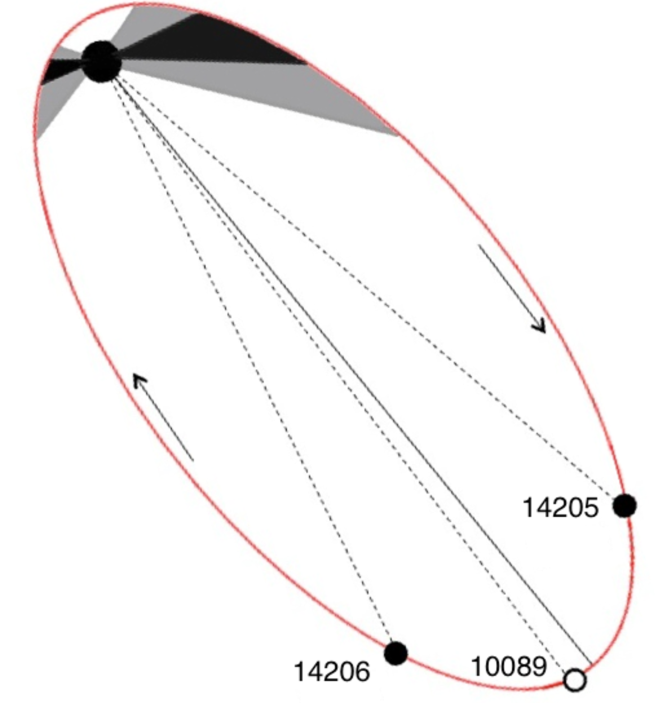
The magnetic field immediately beyond the shock can be estimated as G for , where is the pre-shock magnetization parameter (Kennel & Coroniti, 1984). This field is consistent with G, inferred assuming a synchrotron origin of the detected emission. The synchrotron cooling time in such a field, yr, exceeds the orbital period, which means that the PWN structure created in a given orbital cycle could be seen in a few following cycles, and its azimuthal extent around the binary can be rather large. The latter conclusion does not contradict to the small azimuthal extent () of the observed structures because the PWN brightness is proportional to the amount of pulsar wind particles supplied in a given direction. This amount strongly varies throughout the eccentric orbit, with a maximum around apastron. It should be noted that a major restructuring of both the extrabinary and intrabinary PWN components is expected when the pulsar moves through the dense excretion disk of the O star around periastron. However, since the pulsar spends only a small fraction () of the orbital period in this stage but sweeps a large range () of true anomalies (see Figure 2), we do not expect a significant contribution of this stage to the extrabianry PWN. The observed shift of the extended structure during 1.5 years can be reconciled with the large if the apparent motion is interpreted as a shift of the termination shock caused by a 30% change of the ratio of the pulsar-wind pressure to the ambient pressure.
The extended emission was the faintest during the 2009 observation, which occurred near apastron at the true anomaly intermediate between those of the 2011 and 2013 observations. Therefore, the extended emission flux is not a periodic function of true anomaly, even for adjacent orbital cycles, which could be explained either by variations in the density/velocity of the O-star wind or by instabilities developing at the interface between the winds. These arguments may also explain a factor of three different X-ray fluxes from the entire binary (at nearly the same true anomalies) seen in the earlier observations with other satellites (see Figure 2 from Chernyakova et al. 2009). In this interpretation we neglected the role of possible mixing of the stellar wind into the pulsar wind, which could lead to mass loading and deceleration of the pulsar wind at large distances from the binary.
5. Conclusions
The unexpected morphology and transient behavior of the resolved extended emission have not been captured in the existing models of such systems. Most likely, the observed structures can be interpreted as the synchrotron emission from the pulsar wind shocked by the interaction with the circumbinary medium or with the heavy stellar wind entrained into the pulsar wind outflow. The appearance of the PWN and the parameter estimates suggest that in either case most of the observed extended emission comes from the pulsar wind ejected from the binary near apastron. If our interpretation of the discovered X-ray emission is correct, then B1259 can be used to probe the properties of stellar and pulsar winds, to study baryonic mass loading of pulsar winds, and to shed light on the complex relativistic shock dynamics. Systematic monitoring of B1259, using high-resolution X-ray, UV, optical, IR, and mm-band observations, is needed to fully utilize this unique laboratory offered by nature.
Acknowledgments: This work was supported by National Aeronautics Space Administration grants NNX09AC81G and NNX09AC84G, and through CXO Award GO2-13085 issued by the CXO X-ray Observatory Center, which is operated by the Smithsonian Astrophysical Observatory for and on behalf of the National Aeronautics Space Administration under contract NAS8-03060.
References
- Bednarek & Sitarek (2013) Bednarek, W., & Sitarek, J. 2013, MNRAS, 430, 2951
- Bogovalov et al. (2008) Bogovalov, S. V., Khangulyan, D. V., Koldoba, A. V., Ustyugova, G. V., & Aharonian, F. A. 2008, MNRAS, 387, 63
- Bosch-Ramon & Barkov (2011) Bosch-Ramon, V., & Barkov, M. V. 2011, A&A, 535, A20
- Bosch-Ramon et al. (2012) Bosch-Ramon, V., Barkov, M. V., Khangulyan, D., & Perucho, M. 2012, A&A, 544, A59
- Chernyakova et al. (2009) Chernyakova, M., Neronov, A., Aharonian, F., Uchiyama, Y., & Takahashi, T. 2009, MNRAS, 397, 2123
- Chernyakova et al. (2006) Chernyakova, M., Neronov, A., Lutovinov, A., Rodriguez, J., & Johnston, S. 2006, MNRAS, 367, 1201
- Dubus (2006) Dubus, G. 2006, A&A, 456, 801
- Dubus (2013) Dubus, G. 2013, A&A Rev., 21, 64
- Dubus et al. (2008) Dubus, G., Cerutti, B., & Henri, G. 2008, A&A, 477, 691
- Ginzburg & Syrovatskii (1965) Ginzburg, V. L., & Syrovatskii, S. I. 1965, ARA&A, 3, 297
- Johnston et al. (2005) Johnston, S., Ball, L., Wang, N., & Manchester, R. N. 2005, MNRAS, 358, 1069
- Johnston et al. (1992) Johnston, S., Manchester, R. N., Lyne, A. G., Bailes, M., Kaspi, V. M., Qiao, G., & D’Amico, N. 1992, ApJ, 387, L37
- Kargaltsev & Pavlov (2008) Kargaltsev, O., & Pavlov, G. G. 2008, in American Institute of Physics Conference Series, Vol. 983, 40 Years of Pulsars: Millisecond Pulsars, Magnetars and More, ed. C. Bassa, Z. Wang, A. Cumming, & V. M. Kaspi, 171
- Kennel & Coroniti (1984) Kennel, C. F., & Coroniti, F. V. 1984, ApJ, 283, 694
- Martins et al. (2005) Martins, F., Schaerer, D., Hillier, D. J., Meynadier, F., Heydari-Malayeri, M., & Walborn, N. R. 2005, A&A, 441, 735
- Melatos et al. (1995) Melatos, A., Johnston, S., & Melrose, D. B. 1995, MNRAS, 275, 381
- Moldón et al. (2011) Moldón, J., Johnston, S., Ribó, M., Paredes, J. M., & Deller, A. T. 2011, ApJ, 732, L10
- Moldón et al. (2012) Moldón, J., Ribó, M., & Paredes, J. M. 2012, in American Institute of Physics Conference Series, Vol. 1505, American Institute of Physics Conference Series, ed. F. A. Aharonian, W. Hofmann, & F. M. Rieger, 386
- Moldón et al. (2013) Moldón, J., Ribó, M., & Paredes, J. M. 2013, ArXiv e-prints
- Morrison & McCammon (1983) Morrison, R., & McCammon, D. 1983, ApJ, 270, 119
- Negueruela et al. (2011) Negueruela, I., Ribó, M., Herrero, A., Lorenzo, J., Khangulyan, D., & Aharonian, F. A. 2011, ApJ, 732, L11
- Pacholczyk (1970) Pacholczyk, A. G. 1970, Radio astrophysics. Nonthermal processes in galactic and extragalactic sources, Series of Books in Astronomy and Astrophysics (San Francisco: Freeman)
- Pavlov et al. (2011) Pavlov, G. G., Chang, C., & Kargaltsev, O. 2011, ApJ, 730, 2
- Pavlov et al. (2003) Pavlov, G. G., Teter, M. A., Kargaltsev, O., & Sanwal, D. 2003, ApJ, 591, 1157
- Puls et al. (2008) Puls, J., Vink, J. S., & Najarro, F. 2008, Astronomy and Astrophysics Review, 16, 209
- Shannon et al. (2013) Shannon, R. M., Johnston, S., & Manchester, R. N. 2013, ArXiv e-prints
- Tavani & Arons (1997) Tavani, M., & Arons, J. 1997, ApJ, 477, 439
- van Marle et al. (2004) van Marle, A. J., Langer, N., & García-Segura, G. 2004, in Revista Mexicana de Astronomia y Astrofisica Conference Series, Vol. 22, Gravitational Collapse: from Massive Stars to Planets, ed. G. Garcia-Segura, G. Tenorio-Tagle, J. Franco, & H. W. Yorke, 136
- Zabalza et al. (2013) Zabalza, V., Bosch-Ramon, V., Aharonian, F., & Khangulyan, D. 2013, A&A, 551, A17
- Zdziarski et al. (2010) Zdziarski, A. A., Neronov, A., & Chernyakova, M. 2010, MNRAS, 403, 1873