Mixing and transport by ciliary carpets: a numerical study
Abstract
We use a 3D computational model to study the fluid transport and mixing due to the beating of an infinite array of cilia. In accord with recent experiments, we observe two distinct regions: a fluid transport region above the cilia and a fluid mixing region below the cilia tip. The metachronal wave due to phase differences between neighboring cilia is known to enhance the fluid transport above the ciliary tip. In this work, we show that the metachronal wave also enhances the mixing rates in the sub-ciliary region, often simultaneously with the flow rate enhancement. Our results suggest that this simultaneous enhancement in transport and mixing is due to an enhancement in shear flow. As the flow above the cilia increases, shear rate in the fluid increases and such shear enhances stretching, which is an essential ingredient for mixing. Estimates of the mixing time scale indicate that, compared to diffusion, the mixing due to the cilia beat may be significant and sometimes dominates chemical diffusion.
1 Introduction
Cilia are micro-scale hair-like structures that cover many eukaryotic cells, from single-celled protozoa to mammalian epithelial surfaces. Motile cilia function in both fluid transport across the cell surface as well as in the sensing of environmental cues (Bloodgood, 2010). The distribution of cilia in animal tissues is highly correlated with the animal’s habitat (Ibañez-Tallon et al., 2003). In aquatic species, cilia commonly occur along external and internal epithelial surfaces, where they have a broad array of functions, from food capture to acquisition of microbial partners. A well-studied example is the harvesting of the bacterium Vibrio fischeri, the luminous symbiont of the Hawaiian squid, during the onset of the model squid-vibrio symbiosis (Altura et al., 2013; Kremer et al., 2013). These bacteria aggregate along ciliated surfaces of a nascent light organ, where they present signals critical for normal onset and development of the symbiotic relationship. When animals invaded terrestrial habitats, cilia became restricted to internal epithelial surfaces to reduce water loss across mucociliary membranes, rendering them difficult subjects for direct study. In mammals, they serve a number of functions including mucus clearance in the respiratory system, left-right asymmetry determination during embryonic development and transport of egg cells in Fallopian tubes (see Satir & Christensen (2007) and the references therein). Also, as in squid-vibrio system, mammals have intimate interactions with bacteria along their ciliary surfaces. In addition to their role in biological systems, cilia also provide an attractive paradigm for fluid manipulation in microfluidic devices. This potential is particularly compelling in light of the rapid developments in micro-scale manufacturing technologies and applications such as “lab-on-a-chip” devices for synthesis of chemicals (e.g., Alexeev et al., 2008; Shields et al., 2010).
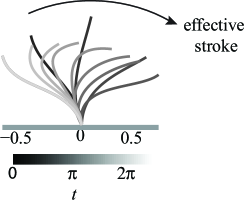
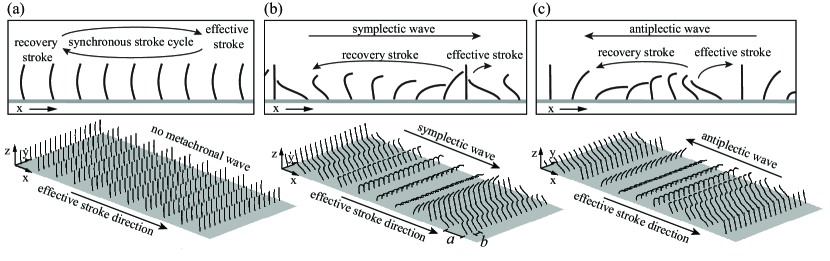
Cilia are usually - m long in mammals and can reach up to m long in aquatic invertebrates such as the Hawaiian squid. Their slenderness ratio ranges between and . Their beating motion usually consists of two asymmetric strokes: an effective stroke where the cilium is relatively straight and generates a flow in the same direction as its motion, and a recovery stroke where the cilium bends towards the surface and generates a relatively smaller backward flow (see, e.g. Blake & Sleigh, 1974). Cilia often beat in accord and form wave patterns, known as metachronal waves. A metachronal wave is called symplectic when it propagates in the direction of the effective stroke. It is called antiplectic when the wave propagates in the direction opposite to the effective stroke (Fig. 2). Cilia-driven flows are characterized by velocities less than m/s and oscillatory frequency less than Hz (Blake & Sleigh, 1974). The associated Reynolds numbers are typically about , even for fluid viscosities as low as water, so inertia is negligible and viscous forces are dominant. Manipulating the surrounding fluid in this drag-dominated microscale work is not intuitive. Cilia are successfully used by biological systems to manipulate the fluid at this scale and, as such, have attracted a great deal of research effort in theoretical and computational mechanics, see, e.g., the reviews by Blake & Sleigh (1974), Brennen & Winet (1977), and Smith et al. (2008). In particular, the coupling between the metachronal waves and the fluid motion was considered in a number of studies, most of which focus on either examining the role of the hydrodynamic coupling in generating the metachronal waves or examining the effect of the metachronal waves on the fluid transport. In the following, we present a partial review of the related literature.
The ‘envelope’ model where the tips of the cilia are modeled as a continuum was proposed by Blake (1971) and has been used in numerous studies on the swimming of ciliated micro-organisms, see, e.g., Michelin & Lauga (2010, 2011). The envelope model is only capable of describing symplectic metachronal waves and is only valid in the case of very densely spaced cilia. Slender body theory, coupled with elastic models of the internal structure of the cilium, has been used to model individual and arrays of cilia. For instance, it was used by Gueron & Liron (1992), Gueron et al. (1997), and Gueron & Levit-Gurevich (1999) to demonstrate that, for closely packed ciliary arrays, hydrodynamic interactions between neighboring cilia are sufficient to account for antiplectic metachrony. The role of hydrodynamic coupling in the emergence of the metachronal wave was also confirmed by Elgeti & Gompper (2013). Eloy & Lauga (2012) focused on computing the energy-optimal kinematics of a wall-bound elastic cilium. Osterman & Vilfan (2011) used a measure of energetic efficiency based on the ciliary performance in pumping fluid and computed, according to this criterion, optimal beating patterns of cilia acting individually and collectively. The flow fields generated by beating cilia were examined numerically using the Stokeslet method (see Smith et al., 2007; Ainley et al., 2008; Cortez, 2001, and references therein) as well as the immersed boundary method, see, e.g. Lukens et al. (2010) for a description of the flow field generated by a single cilium and Khaderi et al. (2011); Khaderi & Onck (2012) for the flow field generated by a finite number of artificial cilia.
These studies focus primarily on the performance of the ciliary systems in fluid transport and pumping. However, the way by which ciliary motion serves the simultaneous tasks of fluid transport and sensing is less well understood. Transport implies that fluid is being moved above the cilia tip whereas, for sensing, chemicals in the fluid need to be brought closer to the base of the ciliated surface. It is unclear if chemical diffusion is the sole mechanism for sensing or whether cilia-generated flows enhance diffusion by chaotic advection and mixing. At this micro scale, lack of turbulence makes mixing by chaotic advection a nontrivial task (Aref, 1990; Ottino, 1989). The computational results of Lukens et al. (2010) showed some evidence of mixing in the flow around a single cilium. A transition from unidirectional flow above the cilium to vortical flow below the cilium was reported by Supatto et al. (2008) based on in-vivo experiments that mapped the velocity field surrounding a single beating cilium in zebrafish embryo. Enhanced diffusion below the cilia tip was also reported in experiments on artificial cilia (e.g., Shields et al., 2010), albeit for cilia beating in synchrony (no metachronal wave). This suggests that the beating of ciliary carpets may be an effective way to induce chaotic mixing.
The goal of this paper is, therefore, to obtain understanding of the transport and mixing properties of flows generated by a doubly-periodic array of asymmetrically beating cilia. In particular, we ask how the transport and mixing properties of the ciliary-generated flows depend on the metachronal wave, and whether there is a trade-off between these two properties. To answer these questions, we use a computational model based on the regularized Stokeslet method (§2). We find, consistent with previous studies, that the flow is characterized by a transport region above the cilia tip and a mixing region below the cilia tip with fluid “leaking” between the two regions (§3). We quantify the transport and mixing rates and their dependence on the metachronal wave (§3). Comparing the mixing time scales to diffusion time scales, we conclude that the mixing time scale is comparable to or more favorable than that of pure diffusion (§4).
2 Model
We consider a regular array of cilia whose base points are placed on the infinite plane , with being the Cartesian coordinates. The spacing between the base points of the cilia is in the -direction and in the -direction, see Fig. 2. The length of each cilium is . We assume that the cilia beat is in the -direction with frequency and period , and that the metachronal wave is propagating in the -direction such that all cilia having the same value of are in phase with each other. In order to model the metachronal wave, each cilium goes through exactly the same cyclic motion as its neighbor but with a phase difference .
For concreteness, consider the cilium whose base point is located at the origin. Let denote the coordinates of the centreline of this cilium. The motion (effective and recovery stroke) of the cilium is described by where is the arclength along the cilium’s centreline from its base and is time . Throughout this work, we prescribe 2D kinematics () of the cilium using a Fourier series expansion in and Taylor series in with coefficients based on experimental data, as shown in Fig. 1, (see Fulford & Blake (1986) for details). This 2D beating kinematics is chosen to facilitate the analysis and the visualization of the flow field. Previous studies suggest that, while 3D beating kinematics may be more efficient in transporting fluid, the mechanisms of generating a directional flow are the same in both 2D and 3D (Elgeti & Gompper, 2013; Eloy & Lauga, 2012). Therefore, we expect our results to be valid for 3D kinematics as well. The metachronal wave in the -direction implies that the kinematics of a cilium based at the point , where , at time is given by
| (1) |
The metachronal wave has a wavelength of , frequency of and wave velocity of .
We use the cilia length to scale all length variables and to scale time. That is to say, all variables are considered to be dimensionless with , and . To explore the effect of the phase difference from 0 to and avoid overlapping of neighboring cilia, we use a spacing in the -direction and in the -direction, see Fig. 2b, c, & d.
To compute the flow field generated by the ciliary motion, each cilium is approximated by a distribution of regularized Stokeslets along its centreline, together with an “image” distribution to satisfy zero-flow boundary conditions at a plane wall (Cortez, 2001). Note that the regularization parameter determines the size of a region with nearly uniform velocity, and therefore can be used as an approximation of the finite radius of the cilium (Ainley et al., 2008). Therefore, we set the regularization parameter to , which gives a radius-to-length ratio close to that of a typical cilium (Blake, 1972). The Stokeslet strengths depend on their position on the cilium and time and are obtained by imposing no-slip boundary conditions at the cilia. Let be the Green’s function associated with a regularized Stokeslet of unit strength situated at a point and such that the no-slip condition is satisfied on the plane . The total velocity induced by all cilia is given by
| (2) |
An expression for is given by (Ainley et al., 2008) 111Note the expression (Eqn. 21) in (Ainley et al., 2008) has a sign error.. No-slip boundary conditions imply that the fluid velocity at the cilia centerline is equal to the prescribed velocity of the cilia Substituting (2) into this equation, one gets a linear system of equations to be solved for the Stokeslet strengths . Having the Stokeslet strengths, the velocity field can be reconstructed everywhere. For more details on the regularized Stokeslet method, the interested reader is referred to Cortez (2001); Ainley et al. (2008).
Given that we apply the regularized Stokeslet method to an infinite array of cilia, a comment on convergence is in order here. Because of the presence of the plane wall, the velocity generated by a Stokeslet and its image decays faster than , where is the distance from the Stokeslet. Therefore, the infinite summations in (2) converge. This is in contrast to an infinite summation over Stokeslets (no image system), which diverges because the flow given by a Stokeslet decays as . Techniques to overcome this challenge using Fourier transform and Ewald’s summation date back to the work of Hasimoto (1959) for point Stokeslets and have been recently extended to the context of regularized Stokeslets by Leiderman et al. (2013). However, since in the case considered here the infinite sums converge, we simply use truncated sums and as approximations of the infinite summations over and . In other words, we approximate the infinite ciliary array using a computational domain with a large but finite number of cilia. To avoid any edge effects, we report the results for flow transport and mixing in the middle section of the computational domain.
3 Results
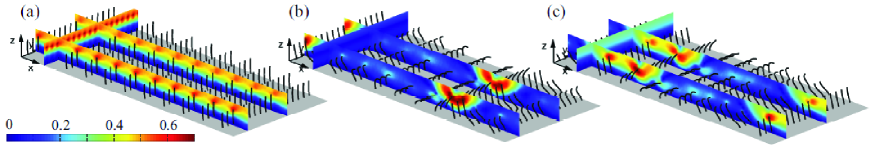
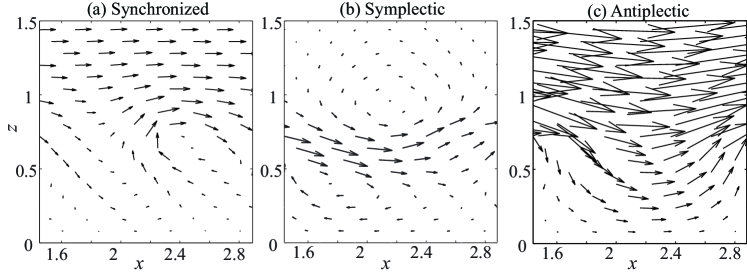
The flow field generated by ciliary motion is studied for three distinct cases: (a) all the cilia beat together in a synchronized way; (b) the ciliary beat generates a symplectic metachronal wave that propagates in the same direction as the effective stroke of the individual cilium ( is negative); (c) the ciliary beat generates an antiplectic wave propagating in the opposite direction of the effective stroke ( is positive). For each case, the flow field is depicted in Fig. 3 at three representative planes , , and . Notice that because the cilia are closely-spaced and their motion is synchronized in the -direction, variations in the flow field in the -direction are small and the flow field is nearly 2-dimensional.
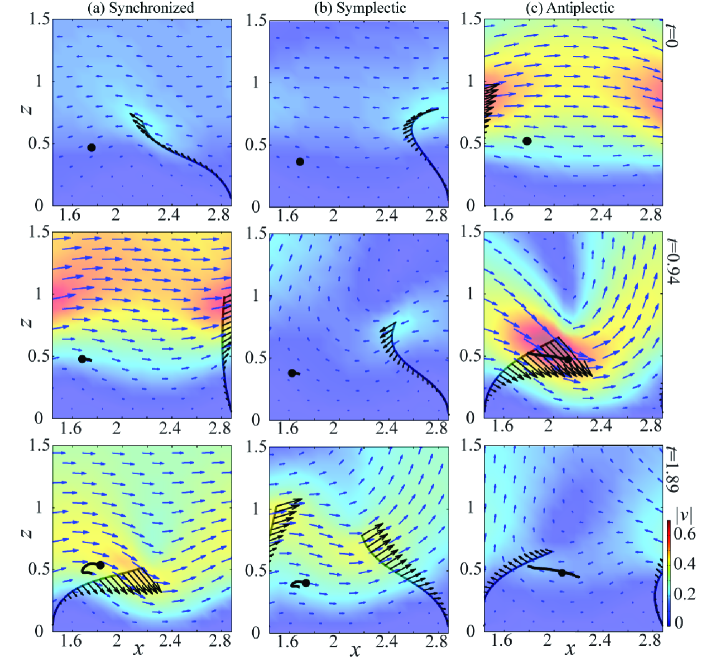
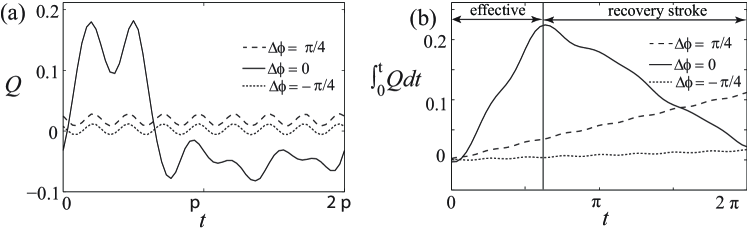
A close-up on the velocity field near one of the cilia is depicted in Fig. 4 at three distinct instances of the beat cycle (top to bottom). The behavior of a passive tracer particle is superimposed. In the synchronized case, the instantaneous velocity field is in the same direction as the cilia motion. The high fluid velocities achieved during the effective stroke get reversed during the recovery stroke so that the net fluid flow over one cycle is small. In the two cases of the metachronal beating, the instantaneous velocity field is attenuated but, at the same time, the variation in the instantaneous velocities is smaller. This results in larger net flow over one cycle in the antiplectic case. Roughly speaking, in the antiplectic case, the cilia undergoing recovery stroke ‘cluster’ together, thus minimizing reverse flow whereas in the symplectic case, the cilia undergoing effective stroke cluster together thus minimizing flow in the effective stroke direction. To quantify these statements, we compute the volumetric flow rate generated by the cilia as a function of time. To this end, we adapt a formula for the flow rate generated by a point force near an infinite wall given by Smith et al. (2008), namely, , where is the viscous coefficient, is the force in the flow direction, and is the distance of the point force from the wall. The flow rate generated by the cilia in Fig. 4 is plotted in Fig. 5(a) as a function of time over one ciliary beat cycle. Clearly, during the effective stroke, the instantaneous flow rate is higher for the synchronized cilia than the metachronally-beating cilia. However, the flow rate is lower during the recovery stroke such that the net flow rate over one ciliary beat cycle is small, see 5(b). Similar results were obtained by Khaderi et al. (2011); Khaderi & Onck (2012), who noted that the blocking effect of reverse flow by the antiplectic metachronal wave is the mechanism the cilia use to enhance fluid transport.
The displacement of a tracer particle over a cycle is given by . The displacement field is depicted in Fig. 6 for the three cases shown in Fig. 4. Above the cilia tip, tracer particles move in the -direction almost uniformly in the synchronized and antiplectic cases with larger magnitude in the antiplectic case. Below the cilia, in the synchronized case, the displacement field shows a vortex-like structure whereas in the antiplectic case, there is little or no backward displacement. In the symplectic case, vortex-like structures appear both below and above the cilia tip with a narrow band of forward displacement in between. Note that the details of these vortex-like structures depend on . For example, for , the vortex above the cilia tip disappears and the displacement field is analogous to that of the synchronized case.
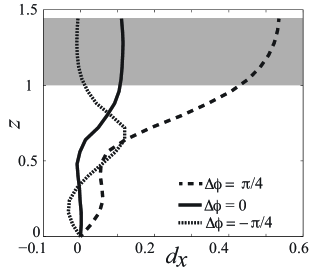
We compute the average displacement in the -direction as a function of using where is the -component of the displacement field and is the wavelength of the metachronal wave. The dependence of on is depicted in Fig. 7(a). The average displacement is small close to the surface due to the no-slip boundary condition. It reaches a plateau above the cilia tip, and decreases for large further away from the cilia (results not shown). Such a displacement profile is reminiscent to that of a shear flow. Clearly, the details from to (at which the displacement plateaus) depend on .
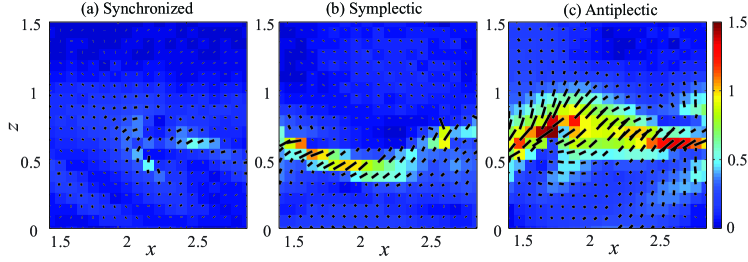
In order to examine the shearing properties of the displacement field shown in Fig. 6, we compute the gradient of the displacement field . We average the -component of the displacement field and consider only the gradient in the plane. The gradient can be decomposed into two components: an antisymmetric component , where is the transpose, that corresponds to rotations, and a symmetric component, , that corresponds to shear deformations. The two eigenvalues of are of the form (by incompressibility) and indicate the rates of stretching () and compression (). The unit eigenvector corresponding to the positive eigenvalue indicates the direction of stretching. Note that the eigenvector corresponding to is orthogonal to , hence it suffices to show the vector field associated with . In order to understand the significance of the vector field , recall that in the case of a uniform linear shear profile (where is a constant), is a uniform vector field of magnitude oriented at a to the -direction. The stretching rate and direction are depicted in Fig. 8 for the three cases shown in Fig. 6. In all three cases, the stretching rate is highest near the upper part of the cilia, and the stretching rate is enhanced by the metachronal wave, especially in the antiplectic case . The field is oriented at a to the -direction in regions where the shear rate is maximum, but, overall, the stretching orientation is a nonlinear function of space. The change in the stretching orientation as a function of indicates the presence of ‘folding’ in the displacement field (Kelley & Ouellette, 2011). We will return to this point later. In Fig. 11(a), we show the spatially-averaged shear rate over the domain as a function of the phase lag. The average shear rate is characterized by two local maxima, one corresponding to a symplectic wave () and another one corresponding to an antiplectic wave ().
We now return to our discussion on fluid transport. To assess the magnitude of the fluid transport in the -direction, we use two interdependent quantities: (i) the net displacement above the cilia tip and (ii) the net volume flow. We define the net displacement as , which corresponds to the net displacement in the grey region of Fig. 7. We calculate the time-averaged net flux generated per cilium as , where is adapted from (Smith et al., 2008) as noted earlier. The dependence of fluid transport in the -direction on is depicted in Fig. 11(b). Both quantities, the net displacement and net flow, exhibit a similar dependence on . It is clear that both symplectic and antiplectic waves can enhance fluid transport in comparison with the synchronized case () but, for small phase lag, the symplectic wave does slightly reduce the fluid transport. Maximal transport occurs for antiplectic waves near and a smaller peak occurs for symplectic waves near .
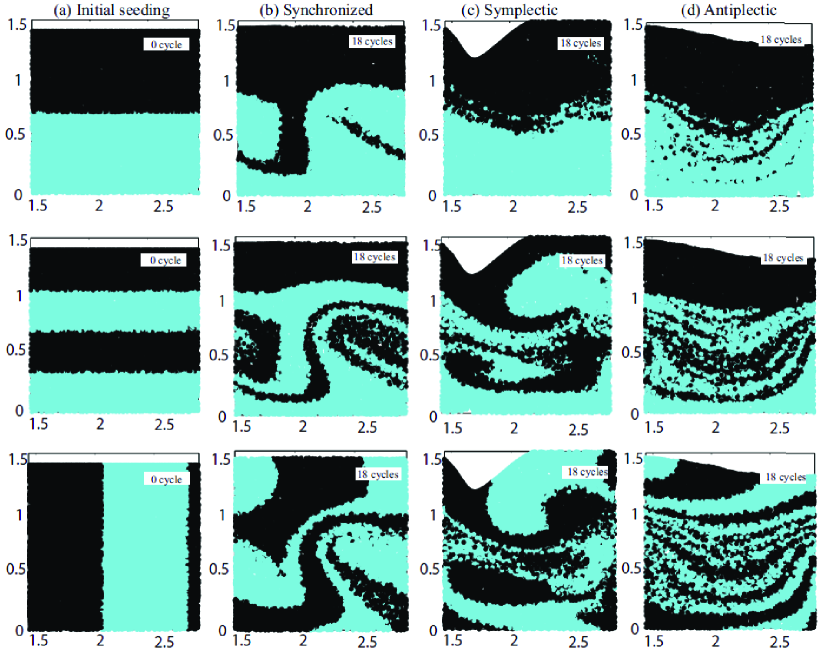
The displacement field can be used as a discrete map to study the long-term behavior of tracer particles. The behavior of tracer particles under repeated iterations of this map is equivalent to a Poincaré section associated with the underlying flow field. Poincaré sections of the flow fields generated by the synchronized, symplectic and antiplectic ciliary beat are shown in Fig. 9 for three different initial seeding of particles. Particles of two different colors are used such that initially, they occupy equal volumes, that is to say, the two colors are in 50:50 ratio. In Fig. 9 (top row), the initial seeding is chosen such that the black particles occupy the region between and . Note that is chosen because it corresponds to the average height of the cilium over a cycle (the actual length of the cilium is but its average height is smaller due to its bending motion during the effective and recovery strokes). Clearly, the tracer particles from the upper layer leak into the lower layer. This is also evident in Fig. 9(middle row) with initial seeding consisting of four layers of alternating colors from to . Again, black particles from the transport region between and leak and mix with subciliary particles. The two regions, namely, the transport region above the cilia tip and mixing region below, are most distinguishable in Fig. 9(bottom row) where the initial seeding consists of regions of alternating colors in the -direction. We emphasize that these two regions are not separated by clear boundaries and that fluid particles leak between them over the course of multiple stroke cycles.
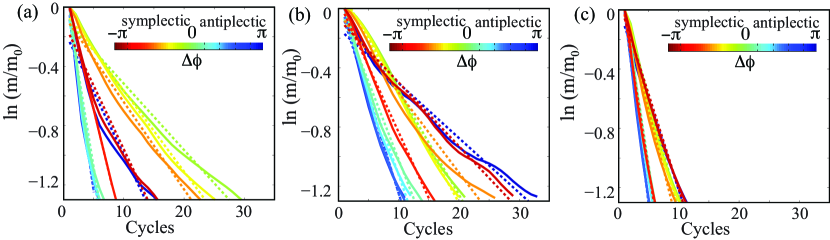
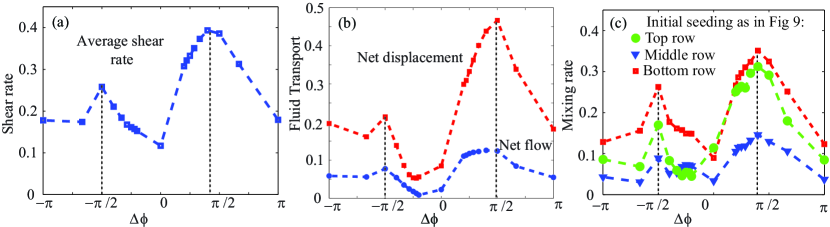
A common way to measure mixing is to quantify how the distance between these initially separated and differently-colored tracer particles decays as a function of time. Several (somewhat related) measures of mixing exist; see, for example, Mathew et al. (2005); Wiggins & Ottino (2004) and references therein. Here, use the shortest distance between particles with different colors as a measure, following Stone & Stone (2005), and define the mixing number as , where and are positions of tracer particles of different colors and ( is the total number of same-color particles). Geometric mean is used here to better account the changes to the particles with small distances. We find (see Fig. 10) that decreases with the number of cycles indicating enhanced mixing. The decay in seems exponential, which is an indication of chaotic mixing. The mixing number is ill-defined for large times when the separation distance between particles of different colors gets closer to the spatial resolution of the initial seeding (which is ). For the time scales before this limit is reached, we approximate the decay by an exponential fit using with being the initial mixing number, the mixing rate, and the number of cycles. We use the resulting mixing rate to compare the mixing efficiency as a function of the phase lag . The dependence of the mixing rate on is depicted in Fig. 11. Interestingly, we find that the values of that correspond to optimal transport (Fig. 7(b)) are also optimal for mixing.
It is worth noting that, for certain phase differences , the actual decay deviates slightly from the exponential fit, especially as increases (see Fig. 10). We attribute this decrease in the mixing rate to the no-slip boundary condition at the fixed wall, which is known to slow down the mixing rate, see, e.g., Thiffeault et al. (2011) and references therein. Thiffeault et al. (2011) propose moving the wall as a mechanism for attenuating the effect of the no-slip wall and restoring the exponential decay in the bulk of the fluid. In many systems, it is not biologically viable to move the cell wall to which the cilia are attached. However, by design, the cilia during the recovery stroke align themselves almost tangentially to the fixed wall and, roughly speaking, act as a moving wall parallel to the no-slip fixed wall, thus shielding the fluid from the presence of the no-slip fixed wall and attenuating its effect on the fluid motion. The amount of ‘coverage’ of the no-slip fixed wall by the moving cilia depends on the phase difference , and therefore we observe that, for certain , this attenuation is smaller and the mixing rate is not exactly exponential. This slight deviation from the exponential decay does not affect our comparative study of the effect of the metachronal wave on the mixing rate, given that we are mainly interested in a relative measure of mixing as varies and not its absolute details.
These results on the role of the metachronal wave in enhancing the fluid mixing can be understood by recalling that stretching and folding are the building blocks of mixing. The higher mixing rate associated with antiplectic waves is contributed to the higher shear rate and therefore, higher stretching (see Figs. 7 and 8). This shear rate argument also explains why for between and , the fluid transport is reduced compared to the synchronized case but the mixing rate is enhanced (Fig. 11). Indeed, for these values of , although the net flow is small, the rate of change in the displacement as a function of height (Fig. 7) and consequently the average shear rate (Fig. 11(a)) are greater than that in the synchronized case.
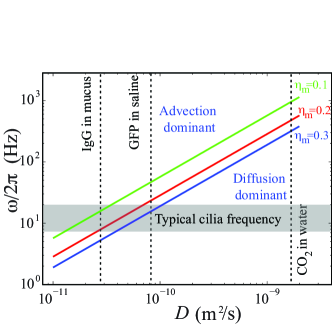
We conclude this section by comparing the time scales associated with mixing by fluid advection to those associated with mixing by molecular diffusion. This comparison is motivated by the fact that cilia often serve two biological functions: fluid transport and sensing. For sensing, chemicals have to come close to the base of the ciliated surface, where molecules would diffuse into the ciliated cells. In the absence of fluid motion, the only mechanism for sensing is molecular diffusion. The main question here is whether the flows generated by the ciliary motion results in enhancing the time scales associated with sensing. To this end, consider particles of different colors initially at a distance apart. We seek to compare the time scales for which the distance between them decreases by, say, a ratio of , where . From the standpoint of mixing by fluid advection, assuming it takes cycles for the separation distance between the particles to become and assuming exponential decay in particle separation distance , one gets that the mixing time scale is given by
| (3) |
where is the frequency of the ciliary beat, as defined in §2. On the other hand, particles moving a distance by molecular diffusion with diffusivity coefficient would take, on average,
| (4) |
Equating the two time scales , one gets
| (5) |
For given , and (dictated by ), (5) provides a linear relationship between and which defines the boundary in the parameter space between advection-dominant mixing and diffusion-dominant mixing. This parameter space is depicted in Fig. 12 for , m, which is the length of a typical cilium, and , which are representative values of the mixing rates obtained from Fig. 11(c). One can readily see that there exists a range of diffusivity coefficients and ciliary beat frequencies where the time scales associated with mixing by fluid advection is dominant.
4 Conclusions
We examined the fluid transport and mixing induced by ciliary carpets. Our results can be summarized as follows:
-
(i)
The fluid motion can be described by two distinct regions: a fluid transport region above the cilia and a fluid mixing region below the cilia tip, with fluid particles leaking between the two regions. This is in accord with the experimental work on artificial cilia beating in synchrony (Shields et al., 2010).
-
(ii)
We showed that both transport and mixing can be enhanced, often simultaneously, when the cilia beat produces a metachronal wave. Further, the optimal wavelengths for transport and mixing are practically the same. Two optima are identified: one for antiplectic waves and one for symplectic waves , with better transport in the antiplectic case but comparable mixing in both cases.
-
(iii)
Our fluid transport results are qualitatively consistent with the previous studies of Gauger et al. (2009) and Khaderi & Onck (2012). A direct numerical comparison is not feasible due to differences in the cilia beat stroke, density and shape. However, a rough comparison between these various studies shows some consistency in the resulting flow rates. In Gauger et al. (2009), the normalized flow rate per cycle generated by the optimal beating pattern of a single cilium is close to /cycle. In our model, we obtain a flow rate of /cycle for a single cilium, whereas Khaderi & Onck (2012) obtained a flow rate close to /cycle per cilium for a finite number of “flat” cilia (cilia with plate-like geometry as opposed to circular cross-section). However, while Khaderi & Onck (2012) report an enhancement in the flow rate up to 2 times due to the metachronal wave, in our study, we observe a greater enhancement (up to 4 times) in the flow rate. We attribute this more significant enhancement in the flow rate to the higher cilia density in our study; other factors such as beating pattern may also contribute to the difference.
-
(iv)
To our knowledge, our study is the first that quantifies mixing by chaotic advection in a doubly-periodic array of cilia. The possibility of mixing by chaotic advection below the cilia tips is suggested in the experimental studies of Supatto et al. (2008) on a single beating cilium in zebrafish embryo and Shields et al. (2010) on arrays of artificial cilia beating in synchrony. More concrete evidence of mixing by chaotic advection was reported in the computational studies of Lukens et al. (2010) on a single cilium in a two-dimensional fluid and Khatavkar et al. (2007) on single and two cilia in a two-dimensional rectangular channel. In the case of two cilia (micro-actuators) beating at a phase difference , Khatavkar et al. (2007) reported exponential growth in the length of a fluid strip for between and with the optimal value being , which is consistent with our results.
-
(v)
We explained the mixing below the cilia tip by the stretching and folding properties of the flow field generated by the ciliary array: the no-slip boundary condition at the base surface together with the asymmetric stroke of the beating cilia generate a shear-like flow field with stretching and folding as depicted in 8. This is most likely a general phenomenon in all ciliary beat patterns.
We conclude by noting that, whereas all the results shown here were based on 2D beating kinematics, the computational framework that we use is general and can easily incorporate 3D ciliary motion. Indeed, our preliminary results on 3D nodal cilia show qualitatively similar separation of transport and mixing regions and similar effects due to the metachronal waves. We limited the discussion here to 2D beating kinematics to better illustrate the main ideas and for easier visualization of the resulting flows. Future extensions of this work will include coupling these models to advection-diffusion models for chemicals (e.g., Michelin & Lauga, 2010), as well as studying the transport and mixing of non-passive inanimate and motile particles in the presence of mucus (non-Newtonian fluids).
5 Acknowledgement
We thank the Center for High-Performance Computing and Communications at USC for providing HPC resources and support.
References
- Ainley et al. (2008) Ainley, J., Durkin, S., Embid, R., Boindala, P. & Cortez, R. 2008 The method of images for regularized Stokeslets. Journal of Computational Physics 227 (9), 4600–4616.
- Alexeev et al. (2008) Alexeev, A., Yeomans, J. M. & Balazs, A. C. 2008 Designing synthetic, pumping cilia that switch the flow direction in microchannels. Langmuir 24 (21), 12102–12106.
- Altura et al. (2013) Altura, M. A., Heath-Heckman, E. A.C., Gillette, A., Kremer, N., Krachler, A., Brennan, C., Ruby, E. G., Orth, K. & McFall-Ngai, M. J. 2013 The first engagement of partners in the Euprymna scolopes-Vibrio fischeri symbiosis is a two-step process initiated by a few environmental symbiont cells. Environmental Microbiology 15 (11), 2937–2950.
- Aref (1990) Aref, H. 1990 Chaotic advection of fluid particles. Philosophical Transactions of the Royal Society of London. Series A: Physical and Engineering Sciences 333 (1631), 273–288.
- Blake (1972) Blake, J. 1972 A model for the micro-structure in ciliated organisms. Journal of Fluid Mechanics 55 (1), 1–23.
- Blake (1971) Blake, J. R. 1971 A spherical envelope approach to ciliary propulsion. Journal of Fluid Mechanics 46 (1), 199–208.
- Blake & Sleigh (1974) Blake, J. R. & Sleigh, M. A. 1974 Mechanics of ciliary locomotion. Biological Reviews 49 (1), 85–125.
- Bloodgood (2010) Bloodgood, R. A. 2010 Sensory reception is an attribute of both primary cilia and motile cilia. Journal of Cell Science 123 (4), 505–509.
- Brennen & Winet (1977) Brennen, C. & Winet, H. 1977 Fluid mechanics of propulsion by cilia and flagella. Annual Review of Fluid Mechanics 9 (1), 339–398.
- Cortez (2001) Cortez, R. 2001 The method of regularized Stokeslets. SIAM Journal on Scientific Computing 23 (4), 1204–1225.
- Elgeti & Gompper (2013) Elgeti, J. & Gompper, G. 2013 Emergence of metachronal waves in cilia arrays. Proceedings of the National Academy of Sciences 110 (12), 4470–4475.
- Eloy & Lauga (2012) Eloy, C. & Lauga, E. 2012 Kinematics of the most efficient cilium. Physical Review Letters 109 (3), 038101.
- Fridlyand et al. (1996) Fridlyand, L., Kaplan, A. & Reinhold, L. 1996 Quantitative evaluation of the role of a putative CO2-scavenging entity in the cyanobacterial CO2-concentrating mechanism. Biosystems 37 (3), 229–238.
- Fulford & Blake (1986) Fulford, G. R. & Blake, J. R. 1986 Muco-ciliary transport in the lung. Journal of theoretical Biology 121 (4), 381–402.
- Gauger et al. (2009) Gauger, E. M., Downton, M. T. & Stark, H. 2009 Fluid transport at low Reynolds number with magnetically actuated artificial cilia. The European Physical Journal E 28 (2), 231–242.
- Gueron & Levit-Gurevich (1999) Gueron, S. & Levit-Gurevich, K. 1999 Energetic considerations of ciliary beating and the advantage of metachronal coordination. Proceedings of the National Academy of Sciences 96 (22), 12240–12245.
- Gueron et al. (1997) Gueron, S., Levit-Gurevich, K., Liron, N. & Blum, J. J. 1997 Cilia internal mechanism and metachronal coordination as the result of hydrodynamical coupling. Proceedings of the National Academy of Sciences 94 (12), 6001–6006.
- Gueron & Liron (1992) Gueron, S. & Liron, N. 1992 Ciliary motion modeling, and dynamic multicilia interactions. Biophysical journal 63 (4), 1045–1058.
- Hasimoto (1959) Hasimoto, H. 1959 On the periodic fundamental solutions of the Stokes equations and their application to viscous flow past a cubic array of spheres. Journal of Fluid Mechanics 5 (02), 317–328.
- Ibañez-Tallon et al. (2003) Ibañez-Tallon, I., Heintz, N. & Omran, H. 2003 To beat or not to beat: roles of cilia in development and disease. Human molecular genetics 12 (suppl 1), R27–R35.
- Kelley & Ouellette (2011) Kelley, D. H. & Ouellette, N. T. 2011 Separating stretching from folding in fluid mixing. Nature Physics 7 (6), 477–480.
- Khaderi & Onck (2012) Khaderi, S. N. & Onck, P. R. 2012 Fluid–structure interaction of three-dimensional magnetic artificial cilia. Journal of Fluid Mechanics 708, 303.
- Khaderi et al. (2011) Khaderi, S. N., den Toonder, J. M. J. & Onck, P. R. 2011 Microfluidic propulsion by the metachronal beating of magnetic artificial cilia: a numerical analysis. Journal of Fluid Mechanics 688, 44–65.
- Khatavkar et al. (2007) Khatavkar, V. V., Anderson, P. D., den Toonder, J. M.J. & Meijer, H. E.H. 2007 Active micromixer based on artificial cilia. Physics of Fluids 19 (8), 083605–083605.
- Kremer et al. (2013) Kremer, N., Philipp, E. E.R., Carpentier, M., Brennan, C. A., Kraemer, L., Altura, M. A., Augustin, R., Häsler, R., Heath-Heckman, E. A.C., Peyer, S. M. et al. 2013 Initial symbiont contact orchestrates host-organ-wide transcriptional changes that prime tissue colonization. Cell host & microbe 14 (2), 183–194.
- Leiderman et al. (2013) Leiderman, K., Bouzarth, E. L., Cortez, R. & Layton, A. T. 2013 A regularization method for the numerical solution of periodic Stokes flow. Journal of Computational Physics 236, 187–202.
- Lukens et al. (2010) Lukens, S., Yang, X. & Fauci, L. 2010 Using Lagrangian coherent structures to analyze fluid mixing by cilia. Chaos: An Interdisciplinary Journal of Nonlinear Science 20 (1), 017511.
- Mathew et al. (2005) Mathew, G., Mezić, I. & Petzold, L. 2005 A multiscale measure for mixing. Physica D: Nonlinear Phenomena 211 (1), 23–46.
- Michelin & Lauga (2010) Michelin, S. & Lauga, E. 2010 Efficiency optimization and symmetry-breaking in a model of ciliary locomotion. Physics of Fluids 22, 111901.
- Michelin & Lauga (2011) Michelin, S. & Lauga, E. 2011 Optimal feeding is optimal swimming for all Péclet numbers. Physics of Fluids 23, 101901.
- Osterman & Vilfan (2011) Osterman, N. & Vilfan, A. 2011 Finding the ciliary beating pattern with optimal efficiency. Proceedings of the National Academy of Sciences 108 (38), 15727–15732.
- Ottino (1989) Ottino, J. M. 1989 The kinematics of mixing: stretching, chaos, and transport. Cambridge University Press.
- Saltzman et al. (1994) Saltzman, W. M., Radomsky, M. L., Whaley, K. J. & Cone, R. A. 1994 Antibody diffusion in human cervical mucus. Biophysical journal 66 (2), 508–515.
- Satir & Christensen (2007) Satir, P. & Christensen, S. T. 2007 Overview of structure and function of mammalian cilia. Annual Review of Physiology 69, 377–400.
- Shields et al. (2010) Shields, A. R., Fiser, B. L., Evans, B. A., Falvo, M. R., Washburn, S. & Superfine, R. 2010 Biomimetic cilia arrays generate simultaneous pumping and mixing regimes. Proceedings of the National Academy of Sciences 107 (36), 15670–15675.
- Smith et al. (2008) Smith, D. J., Blake, J. R. & Gaffney, E. A. 2008 Fluid mechanics of nodal flow due to embryonic primary cilia. Journal of The Royal Society Interface 5 (22), 567–573.
- Smith et al. (2007) Smith, D. J., Gaffney, E. A. & Blake, J. R. 2007 Discrete cilia modelling with singularity distributions: application to the embryonic node and the airway surface liquid. Bulletin of mathematical biology 69 (5), 1477–1510.
- Stone & Stone (2005) Stone, Z. B. & Stone, H. A. 2005 Imaging and quantifying mixing in a model droplet micromixer. Physics of Fluids 17 (6), 063103–063103.
- Supatto et al. (2008) Supatto, W., Fraser, S. E. & Vermot, J. 2008 An all-optical approach for probing microscopic flows in living embryos. Biophysical journal 95 (4), L29–L31.
- Swaminathan et al. (1997) Swaminathan, R., Hoang, C. P. & Verkman, A. S. 1997 Photobleaching recovery and anisotropy decay of green fluorescent protein GFP-S65T in solution and cells: cytoplasmic viscosity probed by green fluorescent protein translational and rotational diffusion. Biophysical Journal 72 (4), 1900–1907.
- Thiffeault et al. (2011) Thiffeault, J.L., Gouillart, E. & Dauchot, O. 2011 Moving walls accelerate mixing. Physical Review E 84 (3), 036313.
- Wiggins & Ottino (2004) Wiggins, S. & Ottino, J. M. 2004 Foundations of chaotic mixing. Philosophical Transactions of the Royal Society of London. Series A: Mathematical, Physical and Engineering Sciences 362 (1818), 937–970.