Harbin, Heilongjiang, China
{ruiguo,wangzh,zlc,lijzh,honggao}@hit.edu.cn
Authors’ Instructions
Harbinger:
An Analyzing and Predicting System for Online Social Network Users’ Behavior
Abstract
Online Social Network (OSN) is one of the hottest innovations in the past years, and the active users are more than a billion. For OSN, users’ behavior is one of the important factors to study. This demonstration proposal presents Harbinger, an analyzing and predicting system for OSN users’ behavior. In Harbinger, we focus on tweets’ timestamps (when users post or share messages), visualize users’ post behavior as well as message retweet number and build adjustable models to predict users’ behavior. Predictions of users’ behavior can be performed with the discovered behavior models and the results can be applied to many applications such as tweet crawler and advertisement.
Keywords:
Social Network, User Behavior, Message Timestamp1 Introduction
Online social networks have exploded incredibly in the past years. For instance, Twitter has 200 million active users who post an average of 400 million tweets every day [twitterCite]. Since the large group of users make OSNs valuable for both commercial and academical applications, the understanding of users’ behaviors could help these applications to improve efficiency and effectiveness.
The understanding of users’ behaviors brings challenges. The crucial one is that they keep on challenging computing resource. For billions of active OSN users, various models or parameters are required to describe users’ different behaviors. Another difficulty is that users are influenced by many factors, most of which are invisible through OSNs. It makes users’ behavior difficult to predict.
Existing works study OSN users’ behavior in several different ways. [charactering1] characterizes behavior by clickstream data. They summarized HTTP sessions from an aggregation website. Its conclusion is that browsing counts 92% of all users’ activities, but this observation cannot be obtained from public OSN data. [measuring2] downloaded user profile pages, and modeled users’ online time with Weibull distributions.
To analyze and predict users’ behavior, we present Harbinger system. Harbinger has two major functions: users’ post behavior analyzing and single message retweet number analyzing. Statistics methods in [rui2013cuvim] are applied to avoid the effect of invisible factors. We observe both a group of users and single tweets, collect message timestamps and message retweet numbers, visualize users’ post behavior and the variation of message retweet number, and describe them by Gaussian Mixture Model and Logarithm Model. Unlike previous works, Harbinger analyzes users’ post behavior through tweets’ timestamps rather than users’ clickstream, online time or friendship.
The remainder of the demonstration proposal is organized as follows. In Section 2, we overview Harbinger and introduce system architecture. In Section 3, we present mathematics models and algorithms. In Section 4, we give demonstration scenario of the system.
2 System Overview
Our System contains two major functions: the users’ post behavior analyzing function and the single message retweet number analyzing function.
For the OSN users’ post behavior, the user of Harbinger is expected to choose an analyzing function, a target OSN user and an analyzing pattern (daily, weekly or monthly pattern). Then corresponding data are selected and statistics are preformed. We set the statistics time span to be one hour (from 00:00 to 24:00) to the daily pattern, and one day from the beginning to the end of the week or month to the weekly or monthly pattern. Finally, the figure of message number and time, and the analysis results such as Figure 2(a) will be plotted.
For the retweet number function, a user chooses a tweet function and target tweet rather. The system analyzes the data and plots the relationship between time and the retweets of the selected tweet such as Figure 2(b).
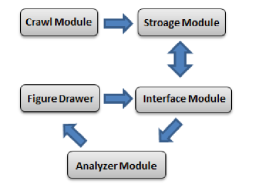
As shown in Figure 1, Harbinger has five major modules: crawl, storage, interface, analyzer and figure drawer modules.
In the crawl module, we develop an OSN crawler through OSN official API to collect information and this is also an application for our prediction model. The crawler collects the message information, including content and timestamp, and then stores it in the storage module, where all data are stored in a database. The User Interface (UI) of the Interface Module connects visitors to Harbinger and other modules. The user of Harbinger can select target OSN user or tweet, and the analyzing pattern in the UI module. The selection is sent to the analyzer. After statistics, analysis and calculating in the analyzer are based on the models in Section 3, and the results are sent to the figure drawer, which draws figures in the UI according to the analysis results.
3 Models and Algorithms
In this section, we describe the models and algorithms used in our system. They are the major parts of the analyzer. Based on the technology in [rui2013cuvim], we develop the Gaussian Mixture Model (GMM) to describe OSN user behavior and Logarithm Model to illustrate the relationship between retweet number and time. Figure 2 shows the results of the GMM and Logarithm Model.
Gaussian Mixture Model
In the daily pattern of the users’ post behavior, we find that the relationship between new messages’ number and the time in a day follows the addition of two Gaussian Distributions (or Normal Distributions). OSN users often work during the day, and rest at noon and dusk. Thus there are two peaks of fresh OSN messages. The curve around each peak is similar to a Gaussian Distribution. As the result, the figure can be treated as a mixture of two Gaussian Distributions.
Thus we develop Gaussian Mixture Model [wikiGMM] (GMM) to compute unknown parameters of the figure. Assume the daily time is , the number of new messages during is , the two Gaussian Distributions are and , and there is
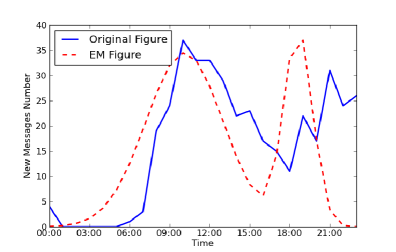
To figure out the exact parameters () in GMM, we apply Expectation-Maximization (EM) algorithm [wikiEM], which is the computing process of GMM. Figure 2(a) shows the results of GMM. In Figure 2(a), the solid line means the original figure of time and retweet number (the user post frequency in a day), and the dotted line means the results of EM algorithm. The results show that the post frequency is indeed similar to the sum of two Gaussian distributions.
Logarithm Model
We find that the relation between retweet number and posted time of a specific message follows the logarithm function. After stretching and shifting, a basic logarithm function can describe retweet number properly. In this curve, x-axis is the posted time (e.g. how long the tweet is posted) of the message and y-axis is the retweet number.
The retweet number grows very fast after the tweet is posted, and with x increases, the growing becomes more and more unchanged. Thus we compute the retweet number in the posted time (e.g. how long the message is posted) as , where is the base of logarithm function representing the steepness of the curve. is the x-axis stretch parameter, is the y-axis stretch parameter, is the x-axis shift parameter, and is the y-axis shift parameter.
To compute the exact parameters of Logarithm Model, we apply Least Squares Algorithm [wikiLS]. The basic idea of Least Squares algorithm is to approximate the model by a linear function and to refine the parameters with iterations.
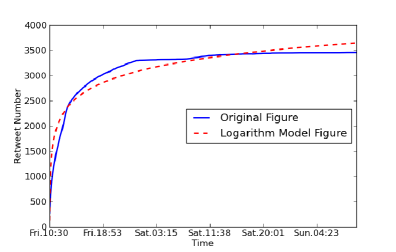
Figure 2(b) describes the result of Logarithm Model. The solid line means the original figure of time and retweet number growth (how the retweet number changes over time after being posted), and the dotted line means the result of Logarithm Model. The result shows that the original figure is indeed similar to a logarithm function figure.
4 Demonstration Scenario
Harbinger is well encapsulated with a friendly interface. Though the system has a large database and specialized analyzer module, what the user faces is only a simple UI.
The interface is shown in the video (http://www.youtube.com/watch?v=x
gXcsbNYqqQ&feature=youtu.be).
The post behavior analyzing function is selected with the radio button. The user of Harbinger can select “All User” or a specific user from the target OSN user list to study all OSN users’ behavior or a specific user’s behavior. And the figure of the distribution is plotted at the bottom of the interface according to the parameters shown at the right side. To show the single message retweet number analyzing function, the other radio button is selected as well as a target message.