Correlation between thermodynamic anomalies and pathways of ice nucleation in supercooled water
Abstract
The well-known classical nucleation theory (CNT) for the free energy barrier towards formation of a nucleus of critical size of the new stable phase within the parent metastable phase fails to take into account the influence of other metastable phases having density/order intermediate between the parent metastable phase and the final stable phase. This lacuna can be more serious than capillary approximation or spherical shape assumption made in CNT. This issue is particularly significant in ice nucleation because liquid water shows rich phase diagram consisting of two (high and low density) liquid phases in supercooled state. The explanations of thermodynamic and dynamic anomalies of supercooled water often invoke the possible influence of a liquid-liquid transition between two metastable liquid phases. To investigate both the role of thermodynamic anomalies and presence of distinct metastable liquid phases in supercooled water on ice nucleation, we employ density functional theoretical approach to find nucleation free energy barrier in different regions of phase diagram. The theory makes a number of striking predictions, such as a dramatic lowering of nucleation barrier due to presence of a metastable intermediate phase and crossover in the dependence of free energy barrier on temperature near liquid-liquid critical point. These predictions can be tested by computer simulations as well as by controlled experiments.
I Introduction
Liquid water shows pronounced thermodynamic (isothermal compressibility, isobaric heat capacity, negative thermal
expansion coefficient below etc.) as well as dynamic anomalies in its supercooled state 1 ; phystoday ; 2 ; 3 ; 4 ; 5 ; 6 ; sengers ; shinji ; 8 . One popular, yet controversial,
interpretation of the observed anomalies invokes the concept of liquid-liquid transition and Widom line
in supercooled water 9 ; 35 ; 36 . Poole et al. 9
observed the existence of two liquid phases – high density liquid (HDL) and low density liquid (LDL) in supercooled
ST2 model of water. These two liquid phases undergo first order liquid-liquid phase transition (LLPT) on supercooling.
The HDL-LDL coexistence line ends at liquid-liquid critical point (LLCP). We must note that in simulations one
observes LLPT at thermodynamic conditions far from ambient conditions 9 . Several recent experiments also suggest the
existence of liquid-liquid transition in water 10 ; 11 ; pnas_exp as well as in other molecular liquids 12 ; 13 ; 14 .
However, the unambiguous confirmation of existence of LLPT in bulk supercooled water is hampered by fast ice nucleation at
thermodynamic conditions predicted for the existence of LLPT. Alternative interpretations of the increase in response functions
upon supercooling also exist that does not invoke the concept of LLPT 15 ; 16 .
Despite water being the most ubiquitous as well as the most studied liquid on earth, the origin of anomalies in supercooled
water is still debated 17 ; 18 ; poole_1 ; 20 ; 19 ; 21 . Most surprisingly, while much discussion has focused on the possible presence
(or absence) of HDL/LDL phases and LLCP 17 ; 18 ; poole_1 ; 20 ; 19 ; 21 , relatively fewer studies have focused on crystallization of
ice and the effects of pronounced thermodynamic and dynamic anomalies observed in supercooled water on the pathway of ice
nucleation 17 ; 18 ; 22 ; 23 .
Nucleation of a new phase in correlated molecular systems (such as water) can be a highly complex process. There are
a multitude of factors (both thermodynamic and dynamic) for this difficulty. The interplay between different length and
energy scales present in molecular systems gives rise to unusually slow relaxation of the system and also rich phase diagram
(polymorphism) 24 in supercooled state. Rich phase behavior can offer diverse (non-classical) nucleation
pathways 25 ; 26 ; 27 . Both these factors along with observed thermodynamic and dynamic anomalies in supercooled water
enhance the complexity of ice nucleation from supercooled water and poses fundamental limitations to the classical nucleation
theory (CNT) nuc_1 ; nuc_2 ; 28 .
II Density functional theoretical formulation of ice nucleation
Two major assumptions of CNT nuc_1 ; nuc_2 ; 28 are (i) the capillary approximation that alllows us to write the free energy of a growing nucleus in terms of a sum of the surface energy and the bulk free energy terms, and (ii) the spherical shape of the nucleus. It is virtually impossible to remove these assumptions in any self-consistent way without making use of substantial numerical work which destroys the simplicity of CNT. However, these approximations might not introduce errors of many orders unless we approach the spinodal line.
Density functional theory (DFT) 29 ; 30 ; 31 ; 32 ; 33 allows us to address the problem of the free energy of growing nucleus without making the capillary approximation. In DFT one gets directly the (unstable) equilibrium density profile by minimizing the grand potential of the inhomogeneous system,
| (1) |
with respect to density profile and corresponding free energy cost for formation of the density profile of critical cluster. In the above equation, is density correlation length and is the grand potential density. The non-local effects in the system due to inhomogeneity in the density are accounted for in the square gradient term.
II.1 Phase diagram of supercooled water
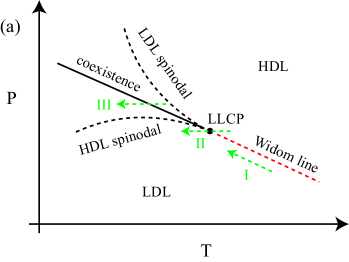
As mentioned, ice nucleation in water could be substantially different due to the possible presence of multiple intermediate thermodynamic phases and also from the fact that the participating free energy surfaces (FES’s) of the parent and daughter phases can be quite different from each other. Thus, the FES of supercooled water can become soft (as we approach ) due to multiple reasons. In Fig. 1, we have shown a schematic phase diagram of supercooled water. Liquid-liquid coexistence line ends at LLCP. Beyond LLCP, the red dotted line shows the Widom line (locus of the maxima of thermodynamic response functions). As evident from the figure, depending on the change of controlled thermodynamic variables nucleation scenario will differ. The FES’s (emphasizing the change in the curvature of liquid free energy basin) on changing thermodynamic variables along the dotted green arrows indicated by I, II and III in Fig. 1 are shown in Fig. 1, Fig. 1 and Fig. 1, respectively.
In this article, we have used one order parameter DFT approach to explore the effects of thermodynamic anomalies and distinct metastable liquid phases in supercooled water on ice nucleation by studying ice nucleation in different regions of phase diagram and made a number of striking predictions that can be tested either by computer simulation or controlled experiments. The present analysis offers an explanation of the proximity of homogeneous nucleation temperature to the apparent LLCP. This DFT based approach can also be extended to multiple order parameters 31 ; 39 .
II.2 Effects of softening of free energy surface on ice nucleation
The anomalous increase in thermodynamic response functions on approaching towards LLCP (dotted green arrow I) indicates the softening of the metastable liquid FES. As illustrated in Fig. 1, on moving along the Widom line towards the LLCP, two thermodynamic variables (pressure and temperature) change. Increase in pressure has an opposite effect (favors high density phase) to that of decrease in temperature (favors ice-like low density phase) on density as well as free energy gap between supercooled water and ice. Considering these opposite dependencies and sake of simplicity we have neglected the thermodynamic condition dependence of both the density of supercooled water as well as the relative free energy gap between two phases.
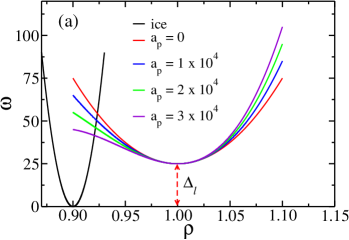
We include the softening of in FES through Landau type free energy expansions in order parameter(s). The grand potential densities of ice and metastable liquid phases are assumed as,
| (2) |
where is the curvature of ice free energy basin, is the equilibrium density of ice phase and is the equilibrium density of metastable liquid phase. is the supercooling parameter. The values of these parameters are mentioned in the caption of Fig. 2. At a particular supersaturation we can evaluate the density profile of the critical nucleus by solving analytically the Euler-Lagrange equation, , with appropriate boundary conditions (see Appendix A for details). is defined by Eq. 1 with correlation length, and . The advantage of such a simplified, yet representative, approach is that one can solve Euler-Lagrange equation analytically (still-non-trivial).
The expression for density profile of critical cluster is,
| (3) |
where and . is the density of the system at .
Relationship between and can be established by equating the derivatives of density profiles for
and at . This condition is necessary for the smoothness of the
composite density profile at . The supercooling parameter () is related with as,
. The density profiles
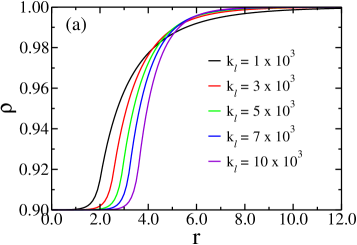
given by Eq. 3 for different curvatures of liquid FES are shown in Fig. 2. We note the broadening of the
interface as well as decrease of the critical cluster size on softening of supercooled liquid FES. The nucleation barrier is
the extra energy cost (with respect to metastable
homogeneous liquid phase) for the formation of (unstable) equilibrium density profile of critical cluster
and is given as, .
The final expression for the nucleation barrier () can easily be derived using the analytical expression
of density profile from Eq. 3 and is
| (4) |
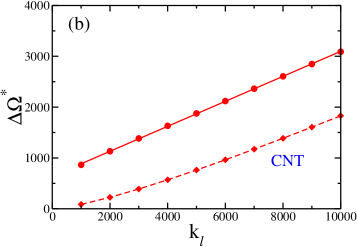
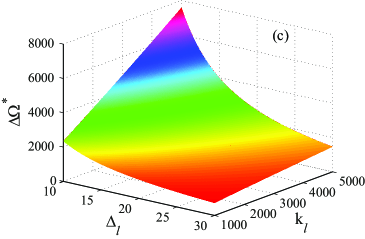
The effect of softening of the metastable liquid phase FES is also reflected in the plot of vs. , shown in Fig. 2. Fig. 2 consists a two dimensional plot showing dependence of on both and . Note the linear increase of on increasing as well as stronger dependence of on at low supersaturation compared to high supersaturation (see Fig. 2). The dotted line in Fig. 2 indicates the nucleation barrier predicted by CNT, , where is the surface tension at coexistence. The surface tension at coexistence () is the extra energy cost per unit area for the formation of planner interface and is given by, , where is the surface area of the planner interface. The coexistence density profile can be easily calculated by solving the Euler-Lagrange equation, , with appropriate boundary conditions (see Appendix B for details). The expression for surface tension is,
| (5) |
As, inclusion of the effects of curvature increases the surface tension, DFT prediction of nucleation barrier is larger than
the nucleation barrier predicted by CNT with coexistence (planner interface) surface tension.
It should be noted that on increasing supercooling the relaxation time of the system also increases and one would expect that the non-equilibrium effects (especially in correlated molecular systems) will also become more pronounced. These non-equilibrium effects are not accounted in our study.
II.3 Beyond the harmonic approximation: role of anharmonicity of free energy surface on nucleation phenomena
The majority of theoretical studies of phase transitions assume the participating free energy surfaces as harmonic. However, in computer simulation studies one often observes an anharmonic softening of the metastable liquid phase FES on supercooling. As on increasing anharmonicity, the bulk free energy barrier (which in turn related to surface tension) decreases, one would expect that the enhance anharmonic fluctuations on increasing supercooling has pronounced effect on nucleation. In this section, we quantify the effects of anharmonic softening of the metastable liquid FES on nucleation barrier and density profile of the critical cluster. The grand potential densities of ice and metastable liquid phases are assumed as,
| (6) |
where is the anharmonicity parameter and is a measure of the anharmonicity of the liquid phase FES (grand potential density).
For a fixed supersaturation (), the grand potential densities for different values of anharmonic parameter are shown in Fig. 3. The density profile is computed using relaxation method 34 . In Fig. 3, we have shown the dependence of the density profile of critical cluster as well as nucleation barrier (see the inset of Fig. 3) on anharmonicity parameter. Note that on increasing anharmonicity of the metastable liquid phase FES, the size of the critical cluster as well as the nucleation free energy barrier decreases. This decrease can be attributed to the decrease in the bulk free energy barrier (shown in Fig. 3) on increasing . Thus, anharmonic softening of the FES on increasing supercooling has an important role in decreasing the free energy barrier of nucleation and hence enhancing the rate of nucleation.
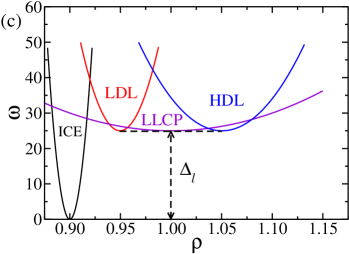
II.4 Nucleation near liquid-liquid critical point
Now, we discuss the nucleation of ice from supercooled water near LLCP (indicated by dotted green arrow II in Fig. 1). In order to study the effects of metastable LLCP on the ice nucleation scenario we have assumed the grand potential densities of ice and supercooled water as,
| (7) |
The temperature dependence of is assumed as, ,
with , . is the critical temperature and is
the curvature of metastable liquid free energy basin at . The temperature dependence of density of metastable liquid,
is assumed as, ,
with critical density, and . The grand potential densities corresponding to
different phases are shown in Fig. 1.
The calculated nucleation barrier and density profiles are shown in Fig. 4. The temperature is
scaled with , . The blue line indicates the dependence of nucleation
barrier on temperature when is assumed to be independent of temperature () and
for LDL basin and for HDL basin and the black line indicates the same when the curvatures of metastable HDL and
LDL basins are same (). The red line indicates the case same as blue line, however,
the temperature dependence of is also taken into account. In this case, is varied in such
as way that at starting its values from at .
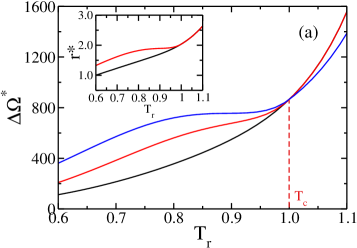
As evident from Fig. 4, there is a crossover in the temperature dependence of free energy barrier for ice
nucleation near LLCP. Similar crossover behavior is also observed in the temperature dependence of critical cluster size
(see inset of the figure). We also note that the free energy barrier is relatively insensitive to the supercooling near LLCP.
In Fig. 4, we have shown the temperature dependence of the density profile of critical ice nucleus for the case when
the free energy gap between the metastable liquid and ice is fixed corresponding to its value at , and LDL basin
curvature is larger than the HDL basin. Note the increase in the stiffness of density profiles as well as decreases in the
density difference between bulk phases (ice and supercooled water) on supercooling. Decrease in density difference between
bulk phases reduces the surface tension cost for formation of ice nucleus; however, at the same time increase in the stiffness
of density profile (or, curvature of LDL basin) leads to an increase in the surface tension. This delicate balance leads to an
interesting crossover behavior in the temperature dependence of nucleation barrier near . This observed crossover
behavior of ice nucleation barrier can be tested in computer simulation studies. We must note that, depending on the
stiffness of LDL basin with respect to HDL basin, one might observe a significant increase in the free energy barrier of nucleation
(in place of being insensitive or weakly sensitive) on increasing supercooling just below . The exact nature of crossover
can only be quantified by inserting more realistic parameters in our theoretical formalism which is not available at the moment.
The nucleation scenario near LLCP has striking similarity to the (non-classical) pathway of protein crystallization near metastable gas-liquid critical point. The metastable critical point enhances density fluctuation and thus decreases the nucleation barrier 37 . One might also observe a similar non-classical nucleation pathway near LLCP by invoking a two order parameter description (density and order) where ice nuclei will grow inside low density ice-like domains formed due to large scale density fluctuations in the system.
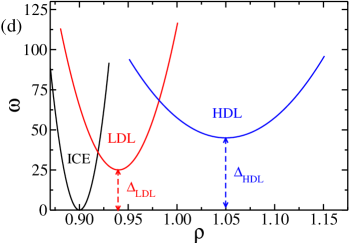
II.5 Wetting mediated nucleation pathway
In the last section, we discuss the ice nucleation scenario at thermodynamic conditions where one observes distinct metastable minima for LDL and HDL phases (indicated by dotted arrow III in Fig. 1). The grand potential densities of ice, LDL and HDL phases are assumed as,
| (8) |
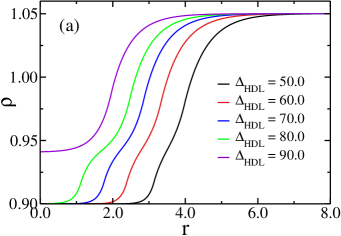
where and are the (meta)stabilities of LDL and HDL phases with respect to ice phase. , and are the densities of bulk ice, LDL and HDL phases, respectively. For numerical computation we have assumed the bulk densities and curvatures of grand potential densities of ice, LDL and HDL phases as independent of temperature. The grand potential densities of different phases at thermodynamic condition when HDL is metastable with respect to both LDL and ice phases are shown in Fig. 1. In order to get the density profile of critical cluster, we have solved the corresponding Euler-Lagrange equation using relaxation method 34 . The dependence of density profile of critical ice nucleus on (meta)stability of HDL phase with respect to ice () is shown in Fig. 5. Note that we have neglected the supercooling dependence of with respect to ( is fixed at ), as is relatively closer to than . We have also neglected the non-equilibrium effects arising due to rapid increase of relaxation time of LDL phase on decreasing temperature.
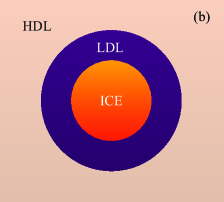
As evident from Fig. 5, when the HDL phase has minimal metastability with respect to the ice phase, a one step density profile (without pronounced wiggle) indicates the absence of (or negligible) wetting of ice nucleus by intermediate metastable LDL phase. On gradually increasing the stabilities of ice and LDL phases with respect to HDL phase, we observe a significant deviation in the density profile of the critical cluster. This indicates a change in the composition of the critical cluster of ice by an intermediate LDL phase. In Fig. 5, we have shown a schematic diagram of the ice nucleus wetted by an intermediate metastable LDL phase. Note the extent of wetting (width of the metastable LDL region) depends on the stability of LDL phase. On further increasing we observe a transition where a critical cluster of intermediate LDL phase appears inside the bulk metastable HDL phase. This is the Ostwald step rule scenario, where transition from metastable HDL phase to final stable ice phase occurs via sequential transformations.
Thus, on increasing supercooling we observe a crossover from the wetting enhanced one step transition to a sequential two step (following Ostwald step rule) transition. The existence of a metastable LDL/LDA-like phase, with order/density intermediate between HDL and ice can greatly facilitate the nucleation of ice from HDL metastable phase by decreasing the surface tension between stable ice and metastable HDL phases. Recent computer simulation studies of freezing of water by Matsumoto et al. 22 as well as Moore et al. 23 indicate the wetting of ice nucleus by a metastable low density phase. This type of wetting mediated transition has also been predicted in the nucleation of liquid from a glassy phase 38 , crystallization of simple (such as hard sphere) and complex (protein crystallization) systems 37 ; 38 ; 39 ; 40 ; 41 ; 42 ; 43 . The application of CNT in the case of wetting mediated transitions is flawed as it does not take into account the decrease in surface tension due to wetting (indirect participation of intermediate phase(s)) of the nucleus.
III Conclusion
To summarize, we have used DFT with phenomenological free energy surfaces to explore the thermodynamic condition dependent diverse plausible pathways of ice nucleation from supercooled water. We show that both the softening of the free energy surface (due to even a distant presence of LLCP in the phase plane) and the presence of distinct metastable liquid phases (LDL and HDL) can lower significantly the nucleation free energy barrier. As both the two situations lower the free energy barrier, we need to look for the features that can allow us to uniquely identify the actual pathway, at least in computer simulations. The main discernible difference occurs in the order parameter profiles as we move from the core of the growing ice nucleus to the surface. However, a detailed analysis of the order parameter profile around a critical is yet to be carried out. We also observe an interesting crossover in the temperature dependence of nucleation barrier near LLCP.
It should be noted that, in computer simulation studies, the phase diagram as well as formation of ice from supercooled water is quite sensitive to the force field used. This often leads to uncertainty and even conflicting results.
Acknowledgements.
We thank Dr. Mantu Santra, Prof. Shinji Saito and Prof. Iwao Ohmine for help and many stimulating discussions. We thank the Department of Science and Technology (DST) and the Board of Research in Nuclear Sciences (BRNS), India, for partial financial support for this work. B.B. thanks DST for J. C. Bose fellowship.References
- (1) F. Franks, Water: A Matrix for Life (Royal Society of Chemistry, Cambridge, 2000)
- (2) A. G. Smart, Phys. Today 66, 16 (2013)
- (3) R. J. Speedy and C. A. Angel, J. Chem. Phys. 65, 851 (1976)
- (4) C. A. Angel, Annu. Rev. Phys. Chem. 34, 593 (1983)
- (5) O. Mishima, J. Chem. Phys. 133, 144503 (2010)
- (6) C. A. Angell, J. Shuppert, and J. C. Tucker, J. Phys. Chem. 77, 3092 (1973)
- (7) D. E. Hare and C. M. Sorensen, J. Chem. Phys. 87, 4840 (1987)
- (8) V. Holten, C. E. Bertrand, and J. V. Anisimov, M. A. Sengers, J. Chem. Phys. 136, 094507 (2012)
- (9) S. Saito, I. Ohmine, and B. Bagchi, J. Chem. Phys. 138, 094503 (2013)
- (10) B. Jana, R. S. Singh, and B. Bagchi, Phys. Chem. Chem. Phys. 13, 16220 (2011)
- (11) P. H. Poole, F. Sciortino, U. Essmann, and H. E. Stanley, Nature 360, 324 (1992)
- (12) O. Mishima, J. Chem. Phys. 100, 5910 (1994)
- (13) T. Loerting and N. Giovambattista, J. Phys.: Condens. Matter 18, R919 (2006)
- (14) O. Mishima and H. E. Stanley, Nature 392, 164 (1998)
- (15) O. Mishima, Phys. Rev. Lett. 85, 334 (2000)
- (16) K. Amann-Winkel, C. Gainaru, P. H. Handle, M. Seidl, H. Nelson, R. Böhmer, and T. Loerting, Proc. Nat. Acad. Sci. 110, 17720 (2013)
- (17) M. Durandurdu and D. A. Drabold, Phys. Rev. B 66, 041201 (2002)
- (18) R. Kurita and H. Tanaka, Science 306, 845 (2004)
- (19) M. Beye, F. Sorgenfrei, W. F. Schlotter, W. Wurth, and A. Föhlisch, Proc. Nat. Acad. Sci. 107, 16772 (2010)
- (20) R. J. Speedy, J. Phys. Chem. 86, 982 (1982)
- (21) S. Sastry, P. G. Debenedetti, F. Sciortino, and H. E. Stanley, Phys. Rev. E 53, 6144 (1996)
- (22) D. Limmer and D. Chandler, J. Chem. Phys. 135, 134503 (2011)
- (23) D. Limmer and D. Chandler, J. Chem. Phys. 138, 214504 (2013)
- (24) F. Sciortino, I. Saika-Voivod, and P. H. Poole, Phys. Chem. Chem. Phys. 13, 19759 (2011)
- (25) P. H. Poole, R. K. Bowles, I. Saika-Voivod, and F. Sciortino, J. Chem. Phys. 138, 034505 (2013)
- (26) Y. Liu, J. C. Palmer, A. Z. Panagiotopoulos, and P. G. Debenedetti, J. Chem. Phys. 137, 214505 (2012)
- (27) T. A. Kesselring, E. Lascaris, G. Franzese, S. V. Buldyrev, H. J. Herrmann, and H. E. Stanley, J. Chem. Phys. 138, 244506 (2013)
- (28) M. Matsumoto, S. Saito, and I. Ohmine, Nature 416, 409 (2002)
- (29) E. B. Moore and V. Molinero, Nature 479, 506 (2011)
- (30) R. S. Singh, M. Santra, and B. Bagchi, J. Chem. Phys. 138, 184507 (2013)
- (31) S. Whitelam, Phys. Rev. Lett. 105, 088102 (2010)
- (32) S. Whitelam, J. Chem. Phys. 132, 194901 (2010)
- (33) L. O. Hedges and S. Whitelam, J. Chem. Phys. 135, 164902 (2011)
- (34) R. Becker and W. Döring, Ann. Phys. 24, 719 (1935)
- (35) A. C. Zettlemoyer, Nucleation (Dekker: New York, 1969)
- (36) P. G. Debenedetti, Metastable Liquids: Concepts and Principles (Princeton University Press, 1996)
- (37) J. W. Cahn and J. E. Hilliard, J. Chem. Phys. 28, 258 (1958)
- (38) Y. C. Shen and D. W. Oxtoby, Phys. Rev. Lett. 77, 3585 (1996)
- (39) V. Talanquer and D. W. Oxtoby, J. Chem. Phys. 109, 223 (1998)
- (40) L. Granasy and D. W. Oxtoby, J. Chem. Phys. 112, 2410 (2000)
- (41) C. K. Bagdassarian and D. W. Oxtoby, J. Chem. Phys. 100, 2139 (1994)
- (42) M. Santra, R. S. Singh, and B. Bagchi, J. Phys. Chem. B 117, 13154 (2013)
- (43) W. H. Press, S. A. Teukolsky, W. T. Vitterling, and B. P. Flannery, Numerical Recipes (Cambridge University Press, 1986)
- (44) P. R. ten Wolde and D. Frenkel, Science 77, 1975 (1997)
- (45) X. Xia and P. G. Wolynes, Proc. Nat. Acad. Sci. 97, 2990 (2000)
- (46) T. Kawasaki and H. Tanaka, Proc. Nat. Acad. Sci. 107, 14036 (2010)
- (47) J. Russo and H. Tanaka, Scientific Reports 2, 505 (2012)
- (48) P. R. ten Wolde, M. J. Ruiz-Montero, and D. Frenkel, Phys. Rev. Lett. 75, 2714 (1995)
- (49) P. R. ten Wolde and D. Frenkel, Phys. Chem. Chem. Phys. 1, 2191 (1999)
Appendix A Analytical expression for nucleation free energy barrier
At a particular supersaturation, density profile of the critical nucleus can be evaluated by solving the Euler-Lagrange equation, . The resulting equation is
| (9) |
The above equation in spherical coordinate can be rewritten as,
| (10) |
where . This equation as
close resemblance with free particle time independent Schrödinger equation in spherical coordinate. One can easily derive an
analytical expansion for density profile by substituting and . The boundary conditions are,
at and at .
The expression for density profile is,
| (11) |
The relationship between and can be established by equating,
| (12) |
For each , one can get by solving numerically the non-linear algebraic equation given by Eq. 12. The free energy barrier of nucleation is the grand potential for formation of critical cluster in bulk metastable liquid phase,
| (13) |
The above equation can be splitted as, , where
| (14) |
and
| (15) |
Now, on integrating the above equation and on further simplification using the relationship between and (Eq. 12), the expression for nucleation barrier reduces to
| (16) |
Appendix B Analytical expression for surface tension at coexistence
Surface tension is the extra energy cost for the formation of planner interface between two coexisting phases at equilibrium and is defined as, , where is area of the planner interface and is grand potential for inhomogeneous density profile and is the grand potential of the bulk phases at coexistence. Following similar procedure one can derive an expression for surface tension,
| (17) |
Now, when the curvature of the grand potential densities corresponding to ice and liquid phases are same, i.e. , then and the expression for surface tension reduces to the following well-known expression of surface tension initially derived by Cahn and Hilliard 29 ,
| (18) |
where is the order parameter difference between two coexisting phases and is the correlation length.