Enhancing resilience of interdependent networks by healing
Abstract
Interdependent networks are characterized by two kinds of interactions: The usual connectivity links within each network and the dependency links coupling nodes of different networks. Due to the latter links such networks are known to suffer from cascading failures and catastrophic breakdowns. When modeling these phenomena, usually one assumes that a fraction of nodes gets damaged in one of the networks, which is followed possibly by a cascade of failures. In real life the initiating failures do not occur at once and effort is made replace the ties eliminated due to the failing nodes. Here we study a dynamic extension of the model of interdependent networks and introduce the possibility of link formation with a probability , called healing, to bridge non-functioning nodes and enhance network resilience. A single random node is removed, which may initiate an avalanche. After each removal step healing sets in resulting in a new topology. Then a new node fails and the process continues until the giant component disappears either in a catastrophic breakdown or in a smooth transition. Simulation results are presented for square lattices as starting networks under random attacks of constant intensity. We find that the shift in the position of the breakdown has a power-law scaling as a function of the healing probability with an exponent close to . Below a critical healing probability, catastrophic cascades form and the average degree of surviving nodes decreases monotonically, while above this value there are no macroscopic cascades and the average degree has first an increasing character and decreases only at the very late stage of the process. These findings facilitate to plan intervention in case of crisis situation by describing the efficiency of healing efforts needed to suppress cascading failures.
pacs:
89.75.Fb, 64.60.aq, 64.60.De, 89.75.DaI Introduction
Robustness is one of the key issues for network maintenance and design Cohen et al. (2000); Callaway et al. (2000); Albert et al. (2000). The representation of complex systems has been limited to single networks for a long time Newman (2010). In many cases, however, coupling between several networks takes place Kivelä et al. (2013); Kenett et al. (2014). An important case is that of interdependency Buldyrev et al. (2010); Li et al. (2012) where there are two kinds of links: connectivity and dependency links. An example of interdependent networks is the ensemble of the Internet and the power supply grid where telecommunication is used to control power plants and electric power is needed to supply communication devices Buldyrev et al. (2010). Connectivity links model the relation of the entities within the same sector, spanning in the above example a power supply network and a telecommunication network. Dependency links depict the basic supplies an entity depends on which are supplied by entities in the other network. If a supplier fails its dependent nodes fail as well. The system is viable if a giant component of interconnected units exists in both networks. In the 28 September 2003 blackout in Italy it came to evidence that the interdependency of the two networks makes them more vulnerable than ever thought before (Buldyrev et al., 2010). Similar relations occur in the economics between banks and firms or funds. Banks are related through interbank loans, firms through supply chains and the interdependence comes from loans and securities. Inappropriate asset proportions can also lead to global avalanches as seen in the subprime mortgage crisis Haldane and May (2011).
Interconnecting similar subsystems used to increase capacity was shown beneficial as long as it does not open pathways to cascades Brummitt et al. (2012). However, in interdependent networks, the aspect of robustness was considered with the conclusion that broadening the degree distribution of the initial networks enhances vulnerability Gao et al. (2012a). A cost-intensive intervention to strengthen robustness is to upgrade nodes to be autonomous on some resources Schneider et al. (2013).
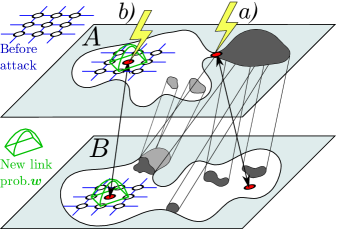
Because failures propagate rapidly in infrastructure networks, they cannot be stopped by installing backup devices during the spreading of the damage. but rather they require already existing systems. After the cascade of failures, damaged devices or elements can be replaced by new, functioning ones identical to the originals Gao et al. (2012b). In contrast to engineered systems, social or economic networks are highly responsive and may react quickly Mucha et al. (2010); Schweitzer et al. (2009). When a failure occurs considerable effort is made to reorganize the network and rearrange the load of failing elements among functioning ones. The role of the failing entities is taken over by similar participants. Such processes can be modeled by healing, i.e., substituting some of the failed elements by new ones. The timescale of an economic crisis is wide enough for the network to completely restructure itself Schweitzer et al. (2009). So far such mechanisms have only been studied for simple networks Wang (2013); Majdandzic et al. (2014); Havlin et al. (2012). Here we extend the original model Buldyrev et al. (2010) of cascading failures of interdependent networks. After each removal, the healing process attempts to bypass the removed node with a new connectivity link (see Fig. 1). In this paper, we demonstrate how healing acts on interdependent networks.
The outline of the paper is as follows. In Sec. II we define the node failure process in a dynamic way. We introduce initial failures one by one to be able to apply healing at every failure event. Then we relate the original version of cascading failures to our model as a special case and give formulas for comparing the order parameter of the two models. The scaling properties of the healing are explained along with the numeric results in Sec. III. In Sec. IV we discuss the properties of the cascades with microscopic insight to the model. Finally we conclude our findings in Sec. V.
II The model
In the standard model of interdependent networks Li et al. (2012) the computer-generated model-system is built up of two topologically identical networks and , e.g., square lattices of size , where each node has connectivity links within the same network. In addition, dependency links couple between the networks, which are bidirectional one-to-one relationships connecting randomly selected pairs of nodes from the two networks. If any of the nodes fails its dependent pair fails too. A node in any network can function only if it is connected to the largest connected component of that network the node which it depends on is also functional, otherwise it fails, i.e., it is removed from the network.
The existence of a macroscopic connected component in a single network is treated by percolation theory. In the usual case, for a lattice it describes a second-order phase transition between the phases with and without the existence of a giant component Stauffer and Aharony (1994). Adding interdependency allows cascades of failures to propagate between the two networks. The threshold the network can survive without collapse decreases considerably in this setting Li et al. (2012).
The collapse due to cascades was shown to be a first order transition if the dependency links have unlimited range while the transition is of second order if the range is less than a critical length Li et al. (2012); Danziger et al. (2013). Moreover, the first order transition has a hybrid character with scaling on one of its sides (Hu et al., 2011; Baxter et al., 2012).
As mentioned in the Introduction we first introduce a dynamic process on the interdependent network model. In the setting of two interdependent networks of general topology this dynamic process consists of the repetition of attacks and relaxations to a rest via cascades. (See Fig. 1.) Let us suppose that failures affect the nodes one by one in a random order which defines a timeline. One time step is identified with the external attack of one node. Time is measured by the number of time steps normalized by for systems of different sizes to be comparable:
The externally introduced failure in network may separate the largest connected component (LCC) into two or more parts where only the largest one survives. All the failed nodes have dependency connections to nodes of the network causing their failure. Again, the LCC of may get fragmented and only the largest part survives. This cascading procedure is repeated until no more failures happen. Of course, our model can easily be generalized to any number of interdependent networks and any density of dependency links.
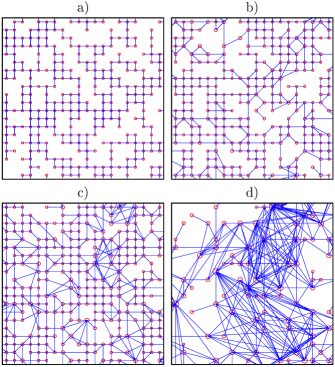
Our aim is to introduce healing into this dynamic model. The procedure is as follows: After an externally introduced failure (which may cut off a part of the LCC) the healing step follows. Two remaining, functioning neighbors of a removed node establish a connectivity link with an independent probability . (See part b) in Fig. 1.) Then the dependent nodes of the removed nodes are removed from the other network. After the propagation of the failure there, again, two functioning neighbors of a removed node establish a connectivity link probability . Due to the separation of small components, further damages might propagate back and forth within the network, always followed by a healing step. Here, the healing step means that all pairs of neighbors of each failed node is considered as a candidate for a new connectivity link with an independent probability , then, after having selected the candidates, the connectivity links are established simultaneously. The process goes on until no more separation of components occurs. The healing links may change the topology considerably, bridging larger and larger distances as the time goes on (Fig. 2). Once a critical fraction of nodes are removed, a catastrophic cascade destroys the remaining system.
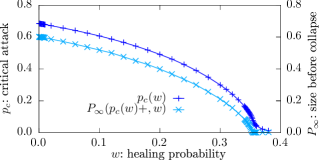
The case is simply the dynamic version of the well studied model of Li et al.. In Li et al. (2012) a fraction of the original network is destroyed in the first step then the size of the giant component after the relaxation of cascades is traced as a function of . The important difference between this procedure and ours is that in the version of Li et al. nodes may be accidentally attacked, which already fail in our step-by-step (dynamic) model. Let denote the fraction of remaining nodes as a function of the fraction of attacked nodes in the step-by-step model. The number of unattacked but disconnected nodes is . The probability of randomly destroying an already disconnected (but not attacked) node is , so the implicit relation between the two attacking methods is 111The integral (1) can be numerically evaluated more accurately by where is the inverse function of .
| (1) |
Due to the small false target ratio in the random attack, the threshold values of the two models are close. The extrapolated threshold value for the infinite system size in case is , in good agreement with the result of Li et al..
III Scaling with the healing probability
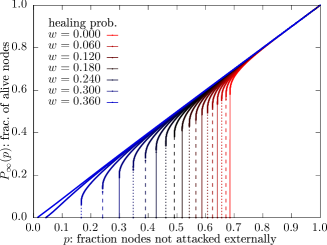
The order parameter of our model depends not only on the fraction of attacked nodes but also on the healing parameter. According to one’s intuition, the data show that the critical attack increases monotonically with .
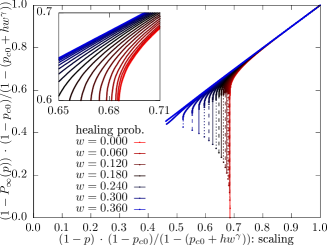
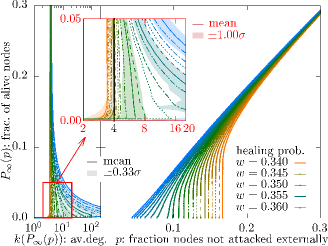
We executed Monte Carlo simulations of our model with both periodic and open boundary conditions on square lattices starting networks of linear size , , , and with , , , and runs respectively, and we measured that the execution time in our implementation scaled approximately as . In the square lattices connectivity links join nodes to their nearest neighbors within the same network. Dependency links were established by first creating the trivial mapping between the topologically identical lattices, then randomly shuffling the end of the links. The -s are then obtained averaging over the vertical axis: for a given number of surviving nodes , we averaged the proportion of nodes attacked one-by-one. Fig. 3 shows the averaged curves for different values of . The shape of the curves suggests the scaling in the form of anisotropic resizing from the point:
| (2) |
which is asymptotically satisfied in the limit.
In the infinite lattice limit, the initial few attacks almost surely occur in different parts of the lattice and do not raise cascades, only the attacked points fail, if . The unit slope at with respect to can be expressed by differentiation and yields . Let us express the fraction of unattacked nodes relative to the threshold without healing: . The change in the threshold value can be identified by the largest where has an infinite slope (see Fig. 4): . Substituting it into (2) yields . The increase in lifetime, , has a general scaling behavior expressed in
| (3) |
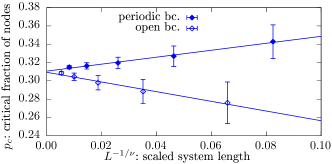
for small -s, in the range . For the purpose of precise measurement we created simulation data for all system sizes with step size for additional to that shown in Fig. 3. The measurement is hampered by large fluctuations of the small systems, therefore we extrapolated to infinite system size using standard finite size scaling Privman (1990). We used both systems with periodic and open boundary conditions and measured the finite size fluctuations in (approaching from the domain in accord with the hybrid character of the transition) which yields slightly different scaling exponents within the error tolerance for the two systems (respectively and ) from which we deduce . The finite size scaling measurements, yielding , are represented in Fig. 5.
The parameters of Eq. (3) are first fitted for each system size , then the infinite size limit is obtained using extrapolation. The systems with periodic and open boundary conditions simulated at different system sizes collapse well yielding and for the infinite size network.
IV Cascades change topology
We call cascades all events involving more nodes than the attacked one and its dependency counterpart. The size (number of nodes involved compared to the starting lattice size) of typical cascades is small up to the point of breakdown.
The healing dynamics changes the network topology and the average degree as well. Fig. 6 allows us to describe a transition: below a critical healing threshold we find a sharp breakdown in the number of surviving nodes. The critical healing is defined as the lowest for which the function does not have an infinite slope. In our simulation we observe . For also there is no macroscopic cascade and goes smoothly to zero in a second-order transition as decreases (see also Fig. 4).
The healing performed by the neighbors introduces new links on average. A rough mean-field estimate of is the healing probability, which conserves the average degree in the initial settings, leading to (each link joins nodes). As the square lattice has , the result is . According to the left plot in Fig. 6 we find that the average degree changes least through the simulation for , which agrees well with the critical healing determined from the curves 222In triangle lattice we measure , and the heuristic argument gives .. The change in the topology along with the trend of the average degree can be observed in Fig. 2. Below the critical healing the average degree is monotonically decreasing function of and the connectivity links remain local, conserving the disordered lattice-like topology. Thorough inspection shows that all simulations end with a cascade wiping out all of the remaining network at . Above the healing promotes the formation of densely connected regions and connectivity links begin to join distant nodes. We remark that in the terminal stage the defined dynamics removes all nodes and links in both cases. In summary, the difference is that for the process terminates with a macroscopic cascade, while for there is no macroscopic cascade. In the latter case the average degree increases until it has to decrease due to the small number of remaining nodes.
V Conclusions
We examined the consequences of healing by edge formation in interdependent networks under random attack. We found that the increase in resilience of the network, measured in the number of survived attacks, has power-law scaling with the probability of healing. By establishing new random links in the neighborhood of the failed nodes, we delayed the collapse of the network through the hindering of cascades. We found that it is possible to completely suppress macroscopic cascading failures for healing probabilities higher than a critical value ; we demonstrated that this critical healing probability keeps the average degree of the nodes close to the initial value while the network topology changes. By analyzing healing efficiency, these findings can aid in the development of intervention strategies for crisis situations. The presented model contains a number of unrealistic features, like the starting lattice, the unbounded range and the high density of dependency links and the non-locality of the healing links. Further studies should clarify the role of these simplifications.
VI Acknowledgements
This work was partially supported by the European Union and the European Social Fund through project FuturICT.hu (Grant No.: TAMOP-4.2.2.C-11/1/KONV-2012-0013). JK thanks MULTIPLEX, Grant No. 317532. Thanks are due to Éva Rácz for her help at the early stage of this work and to Michael Danziger for a critical reading of the manuscript.
References
- Cohen et al. (2000) R. Cohen, K. Erez, D. ben Avraham, and S. Havlin, Phys. Rev. Lett. 85, 4626 (2000).
- Callaway et al. (2000) D. S. Callaway, M. E. J. Newman, S. H. Strogatz, and D. J. Watts, Phys. Rev. Lett. 85, 5468 (2000).
- Albert et al. (2000) R. Albert, H. Jeong, and A. L. Barabasi, Nature 406, 378 (2000).
- Newman (2010) M. E. J. Newman, Networks: An Introduction (Oxford University Press, 2010).
- Kivelä et al. (2013) M. Kivelä, A. Arenas, M. Barthelemy, J. P. Gleeson, Y. Moreno, and M. A. Porter, pre-print (2013), arXiv:1309.7233 [soc-ph] .
- Kenett et al. (2014) D. Y. Kenett, J. Gao, X. Huang, S. Shao, I. Vodenska, S. V. Buldyrev, G. Paul, H. E. Stanley, and S. Havlin, in Networks of Networks: The Last Frontier of Complexity, Understanding Complex Systems, edited by G. D’Agostino and A. Scala (Springer International Publishing, 2014) pp. 3–36.
- Buldyrev et al. (2010) S. V. Buldyrev, R. Parshani, G. Paul, H. E. Stanley, and S. Havlin, Nature 464, 1025 (2010).
- Li et al. (2012) W. Li, A. Bashan, S. V. Buldyrev, H. E. Stanley, and S. Havlin, Phys. Rev. Lett. 108, 228702 (2012).
- Haldane and May (2011) A. G. Haldane and R. M. May, Nature 469, 351 (2011).
- Brummitt et al. (2012) C. D. Brummitt, R. M. D’Souza, and E. A. Leicht, Proc. Nat. Ac. Sci. of the USA 109, E680 (2012).
- Gao et al. (2012a) J. Gao, S. V. Buldyrev, S. Havlin, and H. E. Stanley, Phys. Rev. E 85, 066134 (2012a).
- Schneider et al. (2013) C. M. Schneider, N. Yazdani, N. A. M. Araujo, S. Havlin, and H. J. Herrmann, Sci. Rep. 3, 1969 (2013).
- Gao et al. (2012b) J. Gao, S. V. Buldyrev, H. E. Stanley, and S. Havlin, Nat. Phys. 8, 40 (2012b).
- Mucha et al. (2010) P. J. Mucha, T. Richardson, K. Macon, M. A. Porter, and J.-P. Onnela, Science 328, 876 (2010).
- Schweitzer et al. (2009) F. Schweitzer, G. Fagiolo, D. Sornette, F. Vega-Redondo, A. Vespignani, and D. R. White, Science 325, 422 (2009).
- Wang (2013) J. Wang, Physica A-Stat. Mech. and Appl. 392, 2257 (2013).
- Majdandzic et al. (2014) A. Majdandzic, B. Podobnik, S. V. Buldyrev, D. Y. Kenett, S. Havlin, and H. E. Stanley, Nat. Phys. 10, 34 (2014).
- Havlin et al. (2012) S. Havlin, D. Y. Kenett, E. Ben-Jacob, A. Bunde, R. Cohen, H. Hermann, J. Kantelhardt, J. Kertész, S. Kirkpatrick, J. Kurths, J. Portugali, and S. Solomon, The European Physical Journal Special Topics 214, 273 (2012).
- Stauffer and Aharony (1994) D. Stauffer and A. Aharony, Intorduction to Percolation Theory, 2nd ed. (Taylor and Francis, London, 1994).
- Danziger et al. (2013) M. Danziger, A. Bashan, Y. Berezin, and S. Havlin, in 2013 International Conference on Signal-Image Technology and Internet-Based Systems (SITIS) (IEEE, 2013) pp. 619–625.
- Hu et al. (2011) Y. Hu, B. Ksherim, R. Cohen, and S. Havlin, Phys. Rev. E 84, 066116 (2011).
- Baxter et al. (2012) G. J. Baxter, S. N. Dorogovtsev, A. V. Goltsev, and J. F. F. Mendes, Phys. Rev. Lett. 109, 248701 (2012).
- Note (1) The integral (1\@@italiccorr) can be numerically evaluated more accurately by where is the inverse function of .
- Privman (1990) V. Privman, ed., Finite Size Scaling and Numerical Simulation of Statistical Systems (World Scientific Publishing Company, Inc., 1990).
- Note (2) In triangle lattice we measure , and the heuristic argument gives .