Anomalous magneto-structural behavior of MnBi explained:
a path towards an improved permanent magnet
Abstract
Low-temperature MnBi (hexagonal NiAs phase) exhibits anomalies in the lattice constants (, ) and bulk elastic modulus (B) below 100 K, spin reorientation and magnetic susceptibility maximum near K, and, importantly for high-temperature magnetic applications, an increasing coercivity (unique to MnBi) above K. We calculate the total energy and magneto-anisotropy energy (MAE) versus (, ) using DFT+U methods. We reproduce and explain all the above anomalies. We predict that coercivity and MAE increase due to increasing , suggesting means to improve MnBi permanent magnets.
pacs:
75.30.Gw, 81.40.Rs, 65.40.De, 02.70.-cMnBi in its low-temperature phase (LTP) has one of the most extraordinary magnetic properties among ferromagnetic materials. Heusler1904 ; Arrivaut1905 ; JAP23p1207y1952 ; ProcPhysSocB67p290y1954 ; Shchukarev1961 ; JPhysSocJapan16p2187y1961 ; ActaChemScand21p1543y1967 ; JETPLetters30p333y1979 ; JAC317p297y2001 ; APL79p1846y2001 ; JPhysCM14p6509y2002 ; JAP91p7866y2002 ; JJapanInstMetals73p40y2009 ; SciTechnolAdvMater9p024204y2008 ; APL99p082505y2011 ; JAC509pL78y2011 ; JMMM324p1887y2012 ; JMMM115p66y1992 ; PSSA34p553y1976 ; PSSA30p251y1975 ; JAP43p2358y1974 ; JAP39p5471y1968 Uniquely, its coercivity increases with temperature (T), and its value is larger than that of Nd2Fe14B above K, making it potentially an excellent permanent magnet for higher-temperature applications. MnBi does not contain critical rare-earth elements and, thus, it has a potential for technological impact. If magnetic anisotropy energy (MAE) is better controlled and tuned, use of MnBi magnets could be broadened. Below we provide theoretical explanation for the long-standing experimental puzzles in the measured coercivity, spin orientation, lattice constants, and bulk modulus of MnBi. We also suggest a means to further increase the MAE.
Despite its simple NiAs hexagonal structure (Fig. 1), stable below K, Shchukarev1961 ; JJapanInstMetals73p40y2009 MnBi exhibits several puzzling and unexplained behaviors versus T. JPhysCM14p6509y2002 ; JAP91p7866y2002 ; JJapanInstMetals73p40y2009 ; SciTechnolAdvMater9p024204y2008 ; APL99p082505y2011 First, the lattice constant exhibits minimal thermal expansion below 70 K and then expands rapidly during the spin reorientation, while shows a chaotic zigzag behavior below K. JAC317p297y2001 ; SciTechnolAdvMater9p024204y2008 ; APL99p082505y2011 Second, there is a measured kink in the bulk modulus (B) near 39 GPa at K. JETPLetters30p333y1979 Third, a spin reorientation is observed at K, JETPLetters30p333y1979 ; JPhysCM14p6509y2002 ; JAP91p7866y2002 when the magnetization M(T) easy axis changes from in-plane to -axis above . Next, coercivity is near zero at T180 K, and increases with T above 180 K. Finally, above K MnBi transforms to a high-T oP10 phase (stable between K and K) with M=0. ActaChemScand21p1543y1967

We explain all these observations by examining dependence of the calculated total energy (E) and MAE on the lattice geometry (Figs. 2, 3 and 4). The total energy is anisotropic versus (), like a “flat-bottom canoe,” and its asymmetry causes abnormal thermal expansion. Due to the nature of the potential energy surface, the second derivative of the total energy with respect to volume is not monotonic, producing a kink in B near 39 GPa, whose origin can be traced to features in electronic density of states (DOS). Spin reorientation arises from a change of sign in MAE, which depends on increasing , This suggests simple means to control MAE: by thermal expansion (observed), or by strain or alloying, e.g., coherent interfacing or doping. While temperature and strain affect mostly (), doping can induce competing effects on MAE, some of which can be beneficial. Preliminary results suggest that doping with selected metals (Ni, Rh, Pd, Ir) increases MAE and coercivity and stabilize the spin orientation along at all temperatures.
Computational method: We use a DFT+U method implemented in the Vienna ab initio simulation package (VASP). VASP1 ; VASP3 We use Monkhorst-Pack -point grid with the -point, a eV plane-wave energy cutoff and V augmentation charge cutoff, for both energy and magnetic anisotropy energy. A modified Broyden’s method PRB38p12807y1988 is used for electronic self-consistency. Bulk moduli are found from dependence of the total energy E on volume . MAE is the energy difference with moments along and then , i.e., EE. Generally, the MAE can be the order of V to V; in MnBi for changes in , pertinent to thermal lattice expansion effects, changes are order of V.
We improve description of the electronic structure (and, hence, magnetization and lattice parameters) by combining the spin-polarized, generalized gradient approximation (GGA) PW91 with the rotationally invariant DFT+U formalism.LDAUTYPE2 GGA includes local value and gradient of the electron density and spin density (=) in the exchange-correlation functional .textbookGGA DFT+U corrects the total energyLDAUTYPE2 for presence of localized states, i.e., , where is the occupation number of state ( for -orbital on Mn). See textbook textbookLDAU for more details. After testing, we set (UJ)=2 V for correlated Mn -electrons to better reproduce the measured () and M (Table 1). Note, a single UJ parameter cannot be adjusted to reproduce both () and M perfectly. At K, we find (Å) and (Å) in good agreement with those measured JPhysCM14p6509y2002 at K (Table 1), with an overestimate by 1.86% and 0.21%, respectively. The calculated M(0) is /MnBi (with site-projected moments of 4.231 and on Mn and Bi, respectively); it agrees with the extrapolated to K values of 4.0 PhysRev104p607y1956 and ; PhysRev99p446y1955 or the measured values of at K; AIP18p1222y1974 at K, or at room T.JPhysCM14p6509y2002
| (Å) | (Å) | (Å3) | Ref. | ||
|---|---|---|---|---|---|
| 4.2827 | 6.1103 | 1.4267 | 97.0574 | 4.18 | JPhysCM14p6509y2002 @10 K |
| 4.286 | 6.126 | 1.4293 | 97.4567 | JMMM115p66y1992 | |
| 4.28 | 6.11 | 1.427 | 96.9303 | PSSA34p553y1976 | |
| 4.305 | 6.118 | 1.4211 | 98.1943 | PSSA30p251y1975 | |
| 4.285 | 6.113 | 1.4266 | 97.2046 | JAP43p2358y1974 | |
| 4.32 | 5.84 | 1.352 | 94.3867 | JAP39p5471y1968 | |
| 4.3080 | 5.7398 | 1.3324 | 92.2554 | 3.455 | GGA |
| 4.3625 | 6.1231 | 1.4036 | 100.9217 | 3.96 | GGA+U |
| 4.170 | 5.755 | 1.3801 | 86.6659 | 4.01 | LMTO PRB59p15680y1999 |
| 4.26 | 6.05 | 1.420 | 95.0835 | 3.7 | ASM JPhysFMetPhys15p2135y1985 |
| 4.30 | 6.12 | 1.423 | 97.9984 | 3.50 | LCAO JapJAP46p3455y2007 |
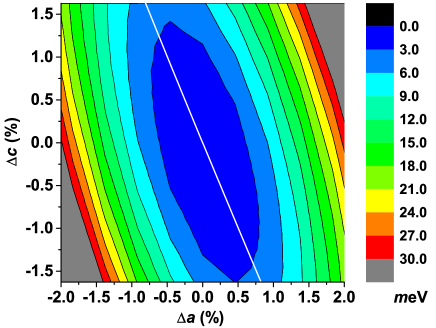
While the GGA+U better describes strongly-correlated systems, like MnBi, there still remains a small systematic DFT error in the lattice constants, arising from the approximation in the exchange-correlation functional (which introduces a small shift in pressure, but not in the curvature of the total energy). Notably, the measured lattice constants differ by 1%, e.g., at T=K, =Å APL99p082505y2011 and Å. SciTechnolAdvMater9p024204y2008 The MAE (Fig. 4) is small and very sensitive to (). For proper comparison, we plot in Fig. 4 both the measured () and those shifted by 0.8% to account for a DFT bias in the GGA+U lattice constants for a given alloy.
Comparison to previous DFT calculations: Without the Hubbard U correction, GGA gives M(0) of and distorts the cell, underestimating its volume (Table 1). For comparison, previous DFT results are 3.50, JapJAP46p3455y2007 3.49, JPhysCM14p6509y2002 and . JPhysFMetPhys15p2135y1985 Fixing to Å and to Å gives a total moment of in the full-potential LMTO, PRB59p15680y1999 while fixing to Å and to Å gives in augmented spherical methods (ASM).JPhysFMetPhys15p2135y1985 Magnetization of MnBi increases with volume. The calculated lattice constants, volume, and magnetization increase with the value of (UJ).
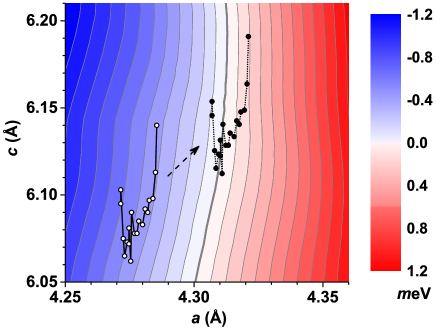
Results and Discussion: Around equilibrium, E(,) looks like a flat-bottom canoe, canted from a constant volume direction towards (Fig. 2). Because the energy penalty for changing by 0.5% is close to zero, even low-energy defects can alter , and any value of within that range is accessible in experiment below K. Indeed, this predicted behavior of with chaotic amplitude within % is observed. SciTechnolAdvMater9p024204y2008 ; APL99p082505y2011
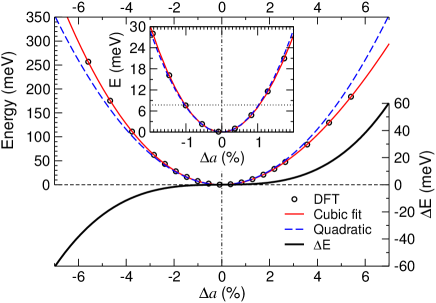
Below V (70 K), E(,0) in Fig. 3 is symmetric with , and can be well described by a parabola , where the unit cell mass is a.m.u., and is harmonic frequency for vibrations along . Quantization of this potential results in a descrete spectrum with the equidistant levels , with eV (K). Due to the symmetric potential and absence of vibrational excitations, there is no thermal expansion along at K.
Above V (K), E(,0) is asymmetric with . It can be approximated by a cubic polynomial , with eV/Å2 and eV/Å3. This fit has , RMS relative error of , and Theil U coefficent of . For ions per unit cell, our theoretical estimate of the linear thermal expansion coefficient () is , in agreement with experiment, SciTechnolAdvMater9p024204y2008 i.e., .
Hence, the potential energy surface in Fig. 2 predicts no thermal expansion along at low K, and a positive expansion at higher T above 100 K, as observed. SciTechnolAdvMater9p024204y2008
The spin reorientation in MnBi near K was not fully understood in experiments. JETPLetters30p333y1979 ; JPhysCM14p6509y2002 ; JAP91p7866y2002 Moreover, previous DFT calculations of MAE found the easy axis to be always in-plane (Table 3 in Ref. PRB59p15680y1999, ). We calculate dependence of the MAE on (), and find that it is strongly affected by and very weakly by , see Fig. 4. Thus, thermal expansion of causes the MAE to change from negative (in-plane oriented moments) to positive (moments oriented along the -axis). This sign change causes a spin reorientation, experimentally observed around K. JETPLetters30p333y1979 ; JPhysCM14p6509y2002 ; JAP91p7866y2002 Magnetic susceptibility has maximum at MAE=0, JETPLetters30p333y1979 ; APL79p1846y2001 ; JPhysCM14p6509y2002 when spins easily reorient along the external applied magnetic field. Coercivity is zero if , but increases with MAE at K. JAP91p7866y2002 Thus, dependence of MAE on (, ) causes spin reorientation and explains the thermal behavior of magnetic susceptibility and coercivity.
Another consequence of the anomalous potential energy surface E is the observed kink in B near 39 GPa at K, a long-standing puzzle. JETPLetters30p333y1979 We calculate B from dependence of E on at isotropic expansion ( in Fig. 2). We find that B versus (Fig. 5) is not monotonic near BGPa, as observed. JETPLetters30p333y1979 This kink originates from a change in DOS at the Fermi level (Fig. 5; see also Fig. 4 in Ref. JPhysFMetPhys15p2135y1985, ). The Fermi level (EF) is in a pseudo-gap, and the minimum in the minority-spin DOS passes through EF with thermal expansion of ; the DOS minimum corresponds to the at B=39 GPa (inset, Fig. 5).
Summary: We calculated dependence of the total energy and magneto-anisotropy energy on the lattice geometry for MnBi low-T phase. Our results explain the unusual structural and magnetic properties, heretofore unexplained. From the potential energy surface, we reproduced and explained the observed anomalous behavior of (i) the lattice constants and (ii) bulk modulus. The calculated MAE changes sign with a small increase in , which causes spin reorientation during thermal expansion. (iii) The magnetic susceptibility has a maximum at MAE=0 (at spin reorientation). (iv) Further increase of MAE with thermally expanding increases coercivity at K, where .
Due to its sensitivity on , the MAE can be altered by temperature, pressure, doping, or interfacial strain. JAP109p07A740y2011 ; JAP107p09E303y2010 ; JPhysD46p095003y2013 ; JAP111p07E326y2012 To test whether doping can achieve a positive MAE at all temperatures, we performed preliminary, small-cell calculations that find that doping with selected (Ni, Rh, Pd, Ir) metals increases coercivity and stabilizes the spin orientation along . More extensive calculations for 3% cationic or anionic doped (substitutions and interstitials) cases are planned to establish the effects on lattice, magnetism, and stability. Our understanding of the anomalous magneto-structural behavior offers an opportunity to develop improved MnBi-based permanent magnets.
This work is supported by the U.S. Dept. of Energy ARPA-E (REACT 0472-1526). Some methods were developed under support by the Office of Basic Energy Science, Division of Materials Science and Engineering. Ames Laboratory is operated for the U.S. DOE by Iowa State University under contract DE-AC02-07CH11358. We thank our REACT team and F.J. Pinski for useful discussions.
References
- (1) Von Fr. Heusler, Z. Angewandte Chemie 17 (9), 260-264 (1904).
- (2) C. R. Arrivaut, Soc. Sci. Phys. Nat., Bordeux, June 8, 1905.
- (3) E. Adams, W.M. Hubbard, and A.M. Syeles, J. Appl. Phys. 23 (11), 1207 (1952).
- (4) B.T.M. Willis and H.P. Rooksby, Proc. Phys. Soc. B 67, 290 (1954).
- (5) S.A. Shchukarev, M.P. Morozova, T.A. Stolyarova, Zh. Obshch. Khim. 31, 1773 (1961).
- (6) K. Adachi, J. Phys. Soc. Japan 16 (11), 2187 (1961).
- (7) A.F. Andresen, W. Hälg, P. Fischer, and E. Stoll, Acta Chem. Scand. 21, 1543-1554 (1967).
- (8) N.P. Grazhdankina and M.A. Novikov, Pisma Zh. Eksp. Theor. Fiz. (JETP Letters) 30 (6), 333-335 (1979).
- (9) H. Yoshida et al., J. Alloys Compd. 317, 297 (2001).
- (10) J.B. Yang et al., Appl. Phys. Lett. 79 (12), 1846 (2001).
- (11) J.B. Yang et al., J. Phys.: Condens. Matter 14, 6509-6519 (2002).
- (12) J.B. Yang et al., J. Appl. Phys. 91 (10), 7866-7868 (2002).
- (13) J.B. Yang et al., Appl. Phys. Lett. 99, 082505 (2011).
- (14) Y. Mitsui et al., J. Japan Inst. Metals 73 (1), 40-45 (2009).
- (15) K. Koyama, Y. Mitsui and K. Watanabe, Sci. Technol. Adv. Mater. 9, 024204 (2008).
- (16) K. Koyama et al., J. Alloys Compd. 509, L78-L80 (2011).
- (17) D.T. Zhang et al., J. of Magnetism and Magnetic Materials 324, 1887-1890 (2012).
- (18) D.D. Sheng et al., J. of Magnetism and Magnetic Materials 115, 66-76 (1992).
- (19) H. Göbel, E. Wolfgang, and H. Harms, Phys. Stat. Sol. A 34, 553 (1976).
- (20) K. Ahlborn, K. Bärner, W. Schröter, Phys. Stat. Sol. A 30, 251 (1975).
- (21) T. Chen, J. Appl. Phys. 45, 2358 (1974).
- (22) J. M. Noothoven van Goor and H. Zijlstra, J. Appl. Phys. 39, 5471 (1968).
- (23) G. Kresse and J. Hafner. Phys. Rev. B 47, 558 (1993); ibid 49, 14251 (1994).
- (24) G. Kresse and J. Furthmüller. Comput. Mat. Sci. 6, 15 (1996); Phys. Rev. B 54, 11169 (1996).
- (25) D.D. Johnson, Phys. Rev. B 38 (18), 12807 (1988).
- (26) J.P. Perdew, J.A. Chevary, S.H. Vosko, K.A. Jackson, M.R. Pederson, D.J. Singh, and C. Fiolhais. Phys. Rev. B 46, 6671 (1992); ibid 48, 4978 (1993).
- (27) S. L. Dudarev, G. A. Botton, S. Y. Savrasov, C. J. Humphreys and A. P. Sutton, Phys. Rev. B 57, 1505 (1998).
- (28) R.G. Parr and W. Yang, Density-Functional Theory of Atoms and Molecules, Oxford University Press, New York, 1989.
- (29) V. I. Anisimov and A. I. Lichtenstein, LDA+U Method: Screened Coulomb Interaction in the Mean-field Approximation, Chapter 2 in Strong coulomb correlations in electronic structure calculations: Beyond the local density approximation, edited by V. I. Anisimov, Gordon and Breach Science Publishers, 2000.
- (30) B. W. Roberts, Phys. Rev. 104, 607 (1956).
- (31) R. R. Heikes, Phys. Rev. 99, 446 (1955).
- (32) W. E. Stutius, Tu Chen, and T. R. Sandin, AIP Conf. Proc. 18, 1222 (1974).
- (33) M.-F. Li et al., Japanese Journal of Applied Physics 46 (6A), 3455-3462 (2007).
- (34) R. Coehoornf and R. A. de Groot, J. Phys. F: Met. Phys. 15 (1985) 2135-2144.
- (35) P. Ravindran et al., Phys. Rev. B 59 (24), 15680 (1999).
- (36) S. Cao et al., J. Appl. Phys. 109, 07A740 (2011).
- (37) P. Kharel et al., J. Appl. Phys. 107, 09E303 (2010).
- (38) P. Kharel et al., J. Appl. Phys. 111, 07E326 (2012).
- (39) P. Kharel et al., J. Phys. D: Appl. Phys. 46, 095003 (2013).