000\Yearpublication\Yearsubmission\Month\Volume\Issue\DOI
The association between sunspot magnetic fields and superpenumbral fibrils
Abstract
Spectropolarimetric observations of a sunspot were carried out with the Tenerife Infrared Polarimeter at Observatorio del Teide, Tenerife, Spain. Maps of the physical parameters were obtained from an inversion of the Stokes profiles observed in the infrared Fe i line at 15648 Å. The regular sunspot consisted of a light bridge which separated the two umbral cores of the same polarity. One of the arms of the light bridge formed an extension of a penumbral filament which comprised weak and highly inclined magnetic fields. In addition, the Stokes profiles in this filament had an opposite sign as the sunspot and some resembled Stokes or . This penumbral filament terminated abruptly into another at the edge of the sunspot, where the latter was relatively vertical by about 30∘. Chromospheric H and He 304Å filtergrams revealed three superpenumbral fibrils on the limb-side of the sunspot, in which one fibril extended into the sunspot and was oriented along the highly inclined penumbral counterpart of the light bridge. An intense, elongated brightening was observed along this fibril that was co-spatial with the intersecting penumbral filaments in the photosphere. Our results suggest that the disruption in the sunspot magnetic field at the location of the light bridge could be the source of reconnection that led to the intense chromospheric brightening and facilitated the supply of cool material in maintaining the overlying superpenumbral fibrils.
keywords:
Sun: sunspots–photosphere–chromosphere–infrared, Techniques: polarimetric1 Introduction
Sunspots are sites of strong magnetic fields. Sunspots comprise a central dark core called the umbra, which is surrounded by a relatively, brighter, radially-oriented, filamentary structure called the penumbra. Magnetic fields are strongest in the umbra, exceeding 2.5 kG and are almost vertical (Solanki, 2003; Balthasar & Gömöry, 2008; Borrero & Ichimoto, 2011, and references therein). The magnetic field inclination to the vertical increases with increasing radius, reaching an average value of 70∘ at the edge of the spot, where the field strength drops to less than 1000 G (Bellot Rubio et al., 2004). The filamentation of the penumbra is also reflected in its magnetic field, where stronger and relatively vertical magnetic fields alternate with filaments that are weaker and more inclined (Borrero et al., 2008; Puschmann et al., 2010b, a). The photospheric magnetic field extends beyond the visible sunspot boundary in the form of a low-lying superpenumbral canopy (Solanki et al., 1994).
In the chromosphere, the outermost boundaries of sunspots are referred to as superpenumbrae which comprise thin, dark, slightly curved fibrils or filaments, that extend radially outwards from the sunspot. According to Hale (1925, 1927) and Richardson (1941), the vorticity of superpenumbral fibrils follows a hemispherical rule wherein most sunspots in the northern/southern hemisphere comprised counterclockwise/clockwise fibrils. Balasubramaniam et al. (2004) reported that clockwise and counterclockwise fibrils could typically exist in the same superpenumbra with one-third of them originating from inside the penumbra. They concluded that the topology of fibrils was affected by the distribution of magnetic fields around the sunspot (Peter, 1996).
In this paper, we analyze the association of superpenumbral fibrils in the chromosphere with the photospheric magnetic field of a regular, unipolar sunspot. We find evidence for strong variations in the magnetic field in the vicinity of a light bridge that are possibly related to the dynamics observed in the chromosphere.
2 Observations
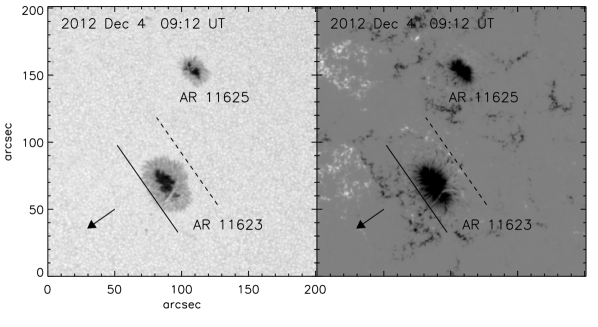
We carried out spectropolarimetric observations of active region NOAA 11623 on 2012 December 4 using the Tenerife Infrared Polarimeter (TIP II; Collados et al., 2007) at the German Vacuum Tower Telescope (VTT), Observatorio del Teide, Tenerife, Spain. TIP II provided spectral scans in the two infrared Fe i lines (15648 Å, and 15652 Å, ) with full-Stokes polarimetry. The sunspot was located at N7/W12 and at a heliocentric angle of 14∘. At each slit position and for a single Stokes parameter, we accumulated ten exposures of 250 ms each. Using a 0\farcs36-wide slit, a full scan of the sunspot was carried out with 100 scan steps, each step being 0\farcs36. The scan lasted from 9:08–9:29 UT. The spatial sampling along the slit was 0\farcs175 while the spectral sampling was 19.8 mÅ. The scan was facilitated by an incrementally turned dichroic beam splitter plate placed in the adaptive optics tank on the first floor of the VTT. This beam splitter transmits a small fraction of light to the wavefront sensor (WFS) and reflects all other light to the science focus. A small tilt shifts the image at the science focus but not on the WFS. Figure 1 shows the orientation of the spectrograph slit of TIP II, overlaid on a continuum intensity filtergram and line-of-sight magnetogram from the Helioseismic and Magnetic Imager (HMI; Schou et al., 2012). The initial and final slit positions are indicated by the solid and dashed lines, respectively. Flat-fielding and polarization calibration were performed at the end of the scan. This was done using a rotatable linear polarizer and phase plate which are introduced in the optical path after the exit window of the vacuum tower (Collados, 1999).
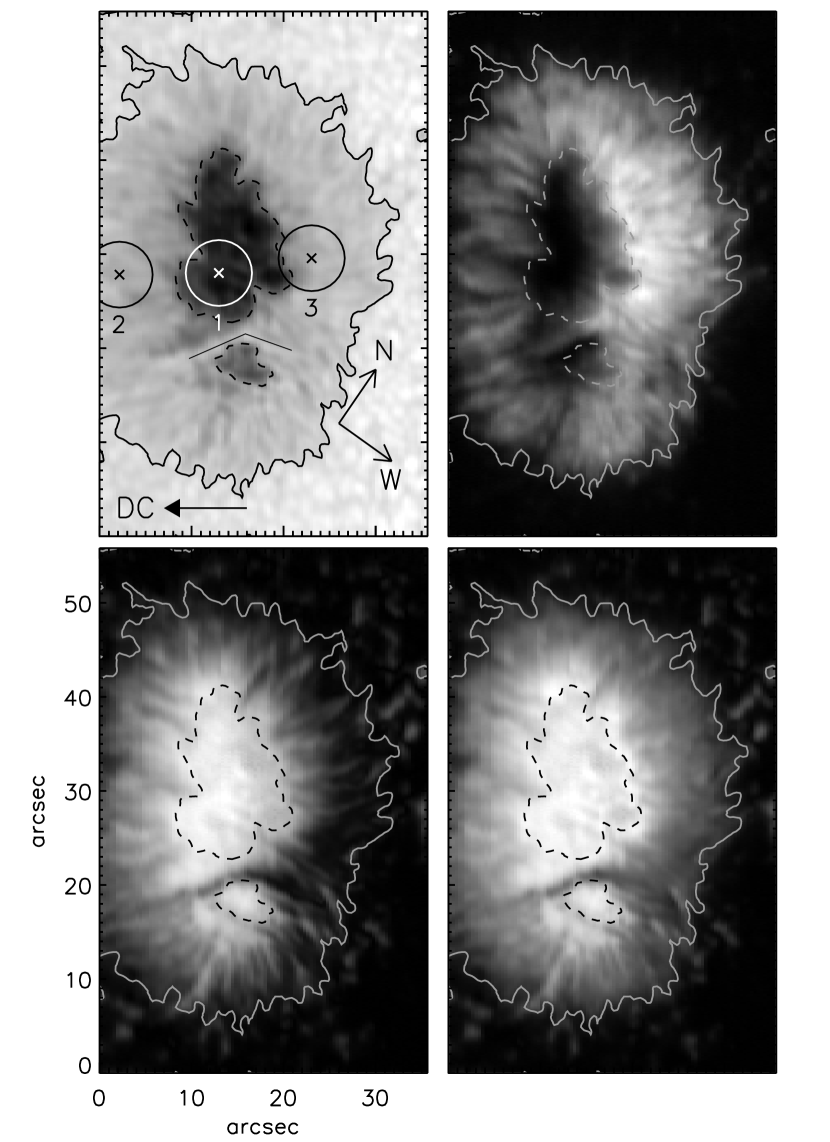
Our observations were supported by the Kiepenheuer-Institut Adaptive Optics System (KAOS; von der Lühe et al., 2003) which enabled us to obtain a highly stable scan of the sunspot with a spatial resolution of about 0\farcs8. Figure 2 shows a slit-reconstructed image of the sunspot in continuum intensity (top left panel) at 15648 Å from the TIP II scan. The sunspot comprises of two umbrae separated by a large light bridge (LB). The LB is oriented in the shape of an inverted ‘V’ (marked in the upper left panel of Fig.2 by a thin black line) in which the smaller umbral core is nestled in the bow of the LB. The filamentation in the penumbra is clearly discernible in the maps of total linear (top right) and total circular polarization (bottom left). In comparison to the umbra and the center-side penumbra, the total circular polarization is weaker in the mid and outer regions of the limb-side penumbra as well as in the LB. The total polarization (bottom right) in the LB is relatively weaker as compared to other regions of the sunspot.
We also use full-disk H images from the Global Oscillations Network Group (GONG; Harvey et al., 1996, 2011) recorded at the Udaipur station in India. The 2k2k images have a spatial sampling of about 1\arcsecand a cadence of 1 min. These are supported by He ii 304 Å images from the Atmospheric Imaging Assembly (AIA; Lemen et al., 2012) which cover the chromosphere and transition region. The 4k4k-pixel images have a spatial sampling and cadence of 0\farcs6 and 2 min, respectively.

3 Results
3.1 Photospheric magnetic field
The infrared Fe lines are very sensitive to the magnetic field owing to the -dependence on the Zeeman splitting and their high Landé factors. In addition, these lines sample the deep photospheric layers due to the reduced opacity of H- at these wavelengths (Bellot Rubio et al., 2004). There are several ways of selecting the infrared Fe lines for inversion, which depends on the spatial position in the sunspot and/or the availability of additional spectral lines. In the umbra, the Fe i 15652 Å line is blended with two molecular OH lines which show up in the Stokes and but are absent in and . Mathew et al. (2003) derived the three dimensional structure of a sunspot by inverting both the Fe lines at 15648 Å and 15652 Å as well as the molecular OH lines. Bellot Rubio et al. (2004) combined a third Fe i line at 15647 Å with the above lines but did not consider the Stokes and profiles of the 15652 Å line in their inversions of sunspot umbra. Cabrera Solana et al. (2007, 2008) and Beck (2008, 2011) have demonstrated that combining the infrared lines along with the visible Fe lines at 6300 Å, provides a better physical stratification as the different lines sample a large range of atmospheric layers. Nevertheless, it depends on the applied method how fast the magnetic field decreases with height (see Balthasar & Gömöry, 2008; Balthasar et al., 2013).
The observed Stokes profiles from the TIP II scan were subjected to an inversion using the SIR (Stokes Inversion based on Response functions; Ruiz Cobo & del Toro Iniesta, 1992) code to retrieve the thermal, magnetic and kinematic parameters in the sunspot. A single magnetic component was assumed in each pixel. Temperature was perturbed with five nodes while two nodes were provided for the magnetic field and line-of-sight (LOS) velocity. Inclination and azimuth were assumed to be height-independent. The average quiet Sun (QS) profile was used to retrieve the fraction of stray–light which was also a free parameter in the inversion. After several attempts, we reverted to the inversion of the stronger Fe i line at 15648 Å as the resulting fit to the observed profiles were inferior when performing the inversion with both lines simultaneously. As both of these lines have similar heights of formation, the resulting model atmosphere from a single line inversion should adequately describe the physical conditions at that height range.
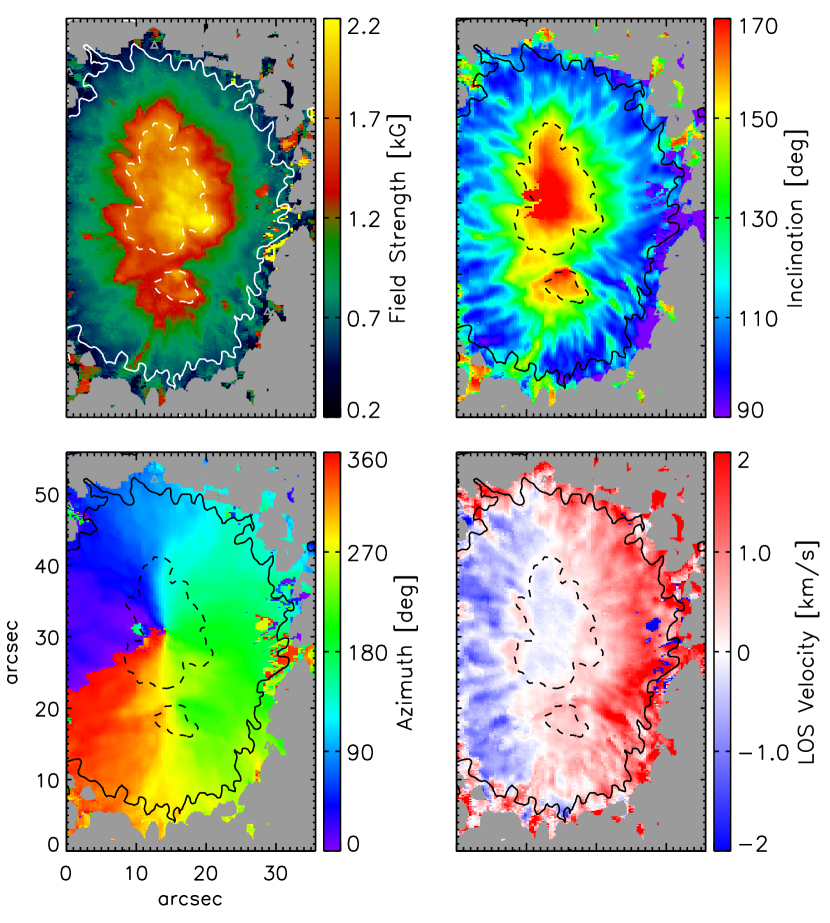
Figure 3 shows the synthetic profiles from the SIR inversion for an umbral, center-side and limb-side penumbral pixel, respectively. Note the large Zeeman splitting seen in Stokes for the umbral pixel. The agreement between the observed and synthetic profiles thus validates our choice of the single component model atmosphere. Maps of the magnetic field strength, inclination, azimuth, and LOS velocity retrieved from the inversion are shown in Fig. 4. The field strength and LOS velocity correspond to the optical depth at . The inclination and azimuth have been transformed to the local reference frame (but not deprojected). The 180∘ ambiguity in the azimuth was removed manually with 0∘ azimuth directed along the positive –axis and increases in the clockwise direction. Apart from a single bad patch (, ) in the outer limb-side penumbra, the maps of the physical parameters are very smooth and reveal small–scale structuring seen earlier in Fig. 2. In the umbra, the maximum and mean field strengths are 2200 and 1850 G at an optical depth of , respectively. The response of Stokes and is most sensitive to the magnetic field strength and LOS velocity at this height (Mathew et al., 2003; Cabrera Solana et al., 2005) for this spectral line. The field reduces from 1750 G at the umbra-penumbra boundary to about 600 G in the outer penumbra. In the LB, field strengths vary from 900–1400 G. While the magnetic field is predominantly vertical in the umbra, in the penumbra we find a variation of about 15∘ between adjacent penumbral filaments. The magnetic field is largely vertical (150∘) on the linear part of the LB (left half), while it is highly inclined (100∘) on the other anchorage section (right half) which is seen as an extension of the penumbra. The Evershed flow (EF; Evershed, 1909) at is about 1.5 km s-1 on the center-side and limb-side penumbra, respectively. However, at some locations in the outer limb-side penumbra, the LOS velocity exceeds 3 km s-1.
3.2 Connection between sunspot light bridge and superpenumbral fibrils
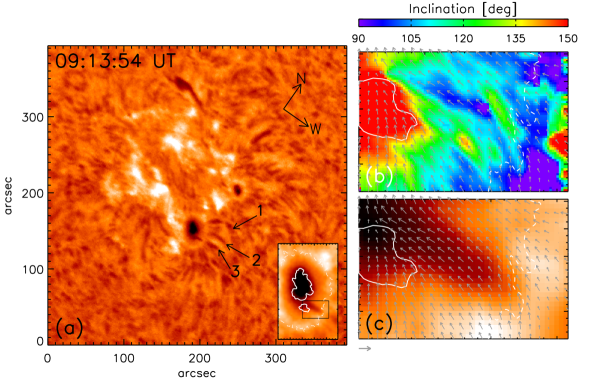
Panel ‘a’ of Fig. 6 depicts the chromosphere of the active region in H. The sunspot in question comprises three distinct superpenumbral fibrils on its western side which are marked with arrows. There is also a closed bundle of fibrils south of the sunspot. Out of these three fibrils, the lower most (labeled ‘3’) is seen to extend all the way to the LB although it is disjoint at the periphery of the sunspot. The inset in panel ‘a’ is a magnified view of the sunspot in H scaled to the TIP II continuum intensity map. It depicts a short part of the fibril that terminates at the edge of the sunspot. The foot-point separation and the length of the superpenumbral fibrils vary from 18–27 Mm. The fibrils do not have a distinct clockwise or counter-clockwise orientation and are seen as radially-orientated, elevated structures.
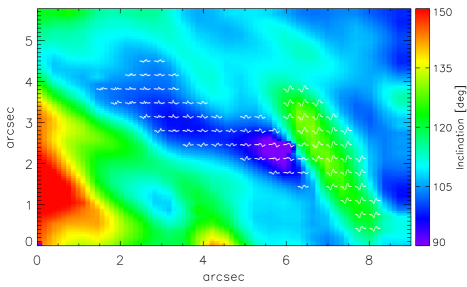
Panels ‘b’ and ‘c’ of Fig. 6 show a close-up view of the field inclination and H intensity, respectively, for the sub-region marked by the black rectangle in the inset of panel ‘a’. The grey arrows represent the horizontal magnetic field. These panels reveal that a part of the chromospheric fibril coincides with the highly inclined penumbral filament that is a continuation of the LB. In the outer penumbra, this horizontal filament abruptly terminates with another filament which is relatively vertical. We estimate the difference in inclination at the location of intersection to be about 30∘. As the sunspot has negative polarity, the horizontal magnetic field is directed radially inwards and is seen to be aligned with the chromospheric fibril. Figure 6 shows the Stokes profiles associated with this pair of intersecting penumbral filaments with the inclination as the background image which has been magnified by a factor of 3. The more horizontal filament that coincides with the fibril in H, comprises profiles which have the opposite sign as that of the sunspot or resemble Stokes or . In addition, the signals are quite weak in comparison to those in the relatively vertical penumbral filament where the profiles consist of two anti-symmetric lobes, and have the same polarity as the sunspot.
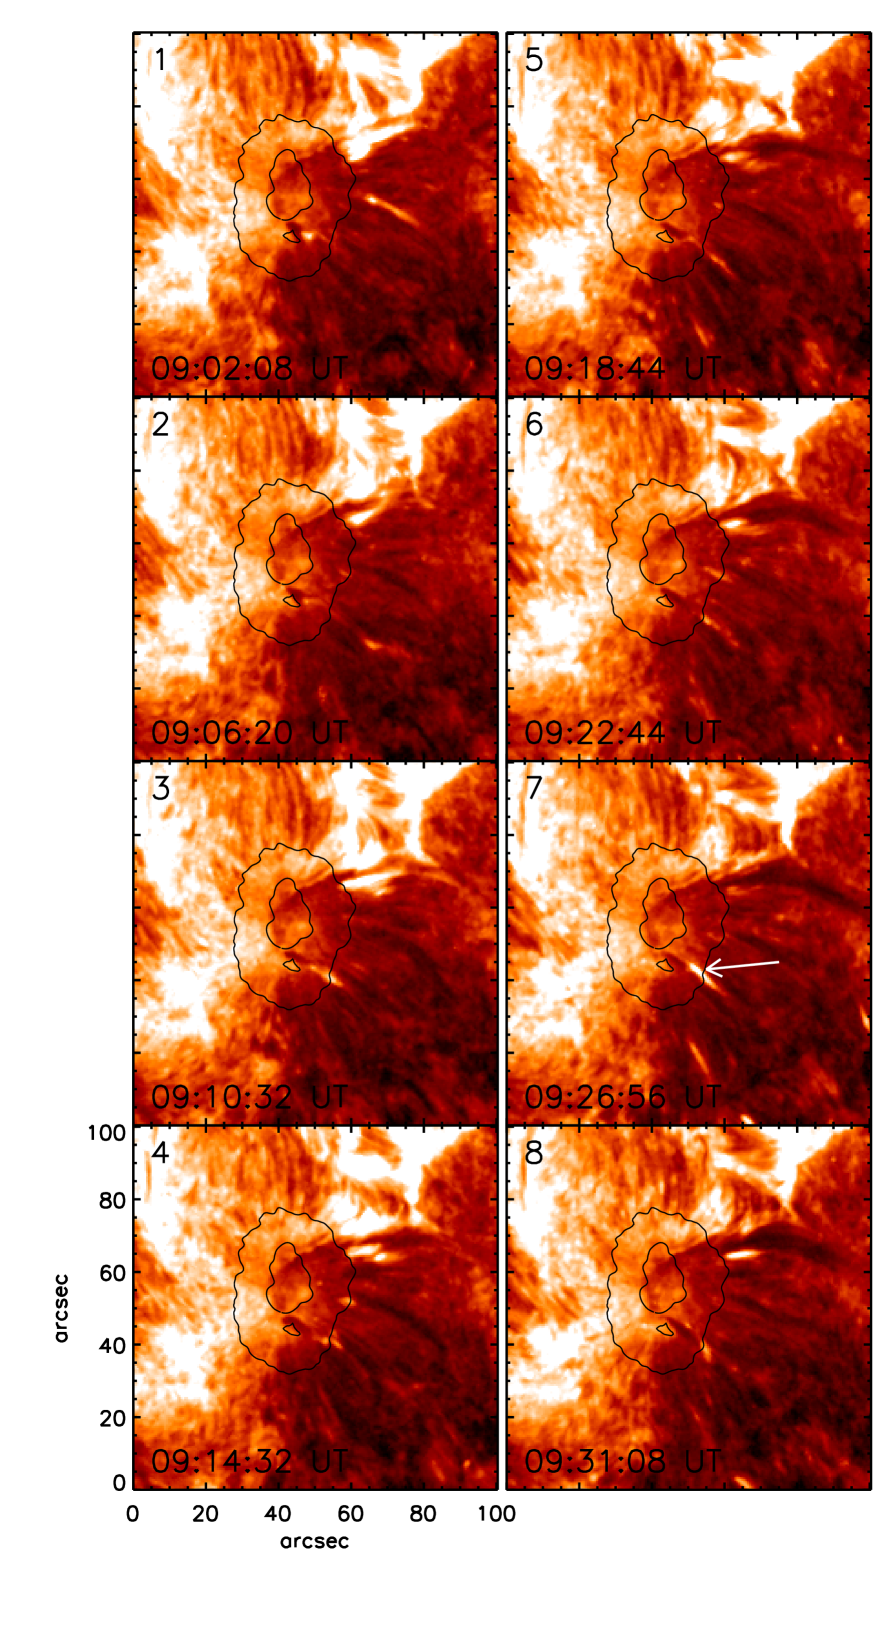
Figure 7 shows the time sequence of AIA He ii 304 Å images which indicate that the superpenumbral fibrils seen in H originate inside the penumbra. The fibrils are also associated with strong emission in the periphery of the sunspot (panels 1 and 8). However, in the case of the lowermost fibril described above, we find an intense brightening that is located well within the sunspot and co-spatial with the intersecting penumbral filaments (white arrow in panel 7). The elongated brightening is a part of the fibril that originates at the sunspot LB, similar to the H images. A movie of the H and He ii 304Å sequence gives the impression of material moving radially inwards along the fibril. However, this could be attributed to the following scenarios: i) the motion is a true motion of plasma along the field lines which could be associated with the chromospheric inverse-EF (St. John, 1913; Haugen, 1969; Dere et al., 1990; Georgakilas & Christopoulou, 2003), and ii) the motion is apparently inward which occurs when the plasma at different segments of the fibril reaches chromospheric temperatures.
4 Summary and conclusions
We carried out spectropolarimetric observations with TIP II at the VTT, Observatorio del Teide, Tenerife, Spain of a sunspot in active region NOAA 11623 on 2012 December 4. Spectral scans of the Fe i line at 15648 Å were obtained with full Stokes polarimetry. The observed Stokes profiles were subjected to an inversion using the SIR code which yielded maps of the physical parameters. The sunspot was a unipolar, regular structure with a large LB which separated the two umbral cores of the same polarity. The LB was oriented in the shape of an inverted ‘V’ with the smaller umbral core located in the bow of the LB. While one of the halves of the LB on the center-side of the sunspot revealed the presence of relatively strong and vertical magnetic fields, the other half on the limb-side was seen as an extension of the penumbra with relatively weaker and highly inclined magnetic fields. This highly inclined penumbral filament terminated abruptly into another filament that was relatively vertical by about 30∘. These intersecting filaments were located near the penumbra-QS boundary. An inspection of the Stokes profiles in the highly inclined filament indicated the presence of or -like profiles as well as with an opposite sign as the sunspot. By comparison, the other filament comprised stronger, normal, and anti-symmetric profiles with the same sign as the sunspot.
In H and He 304 Å filtergrams, we identified three superpenumbral fibrils on the limb-side of the sunspot, in which one fibril extended into the sunspot and was oriented along the highly inclined penumbral counterpart of the LB. The horizontal magnetic field was seen to be directed along the fibril channel. Towards the end of the TIP II scan, the He 304Å images showed an intense, elongated brightening along this fibril that was also co-spatial with the intersecting penumbral filaments in the photosphere. The time sequence of H and He ii images revealed an apparent radial inward motion of plasma along the chromospheric fibrils although this could be related either to the chromospheric inverse-EF or to a transient heating of the material to chromospheric temperatures.
The LB is a region where the magnetic field is disturbed as a result of hot, convective plasma penetrating the sunspot from below (Jurčák et al., 2006). This perturbation could result in a complex arrangement of magnetic fields which is seen in the form of a highly inclined penumbral filament intersecting another where the magnetic field is more vertical. Similar magnetic configurations have been reported earlier where the LB consisted of irregular Stokes profiles (Louis et al., 2009; Ruiz Cobo & Asensio Ramos, 2013). A magnetic topology such as the above, could facilitate reconnection in the chromosphere where we find a bright patch in the He ii 304Å images and is consistent with findings of Louis et al. (2008); Shimizu et al. (2009); Louis et al. (2009) and Louis et al. (2011). It has been shown that magnetic reconnection in the chromosphere plays an important role in the formation of filaments (van Ballegooijen & Martens, 1989; Chae et al., 2000; van Ballegooijen & Mackay, 2007; Okamoto et al., 2009; Wang & Muglach, 2013), as it re-orients magnetic field lines and facilitates the supply of cool material to the filament. We find that such a process could occur as a result of a disruption of the sunspot magnetic field in the proximity of the light bridge thereby producing the intense chromospheric brightening along the superpenumbral fibril.
Acknowledgements.
The Vacuum Tower Telescope is operated by the Kiepenheuer-Institute for Solar Physics in Freiburg, Germany, at the Spanish Observatorio del Teide, Tenerife, Canary Islands. This work utilizes data obtained by the Global Oscillation Network Group (GONG) Program, managed by the National Solar Observatory, which is operated by AURA, Inc. under a cooperative agreement with the National Science Foundation. The data were acquired by instruments operated by the Big Bear Solar Observatory, High Altitude Observatory, Learmonth Solar Observatory, Udaipur Solar Observatory, Instituto de Astrofísica de Canarias, and Cerro Tololo Interamerican Observatory. HMI data are courtesy of NASA/SDO and the HMI science team. They are provided by the Joint Science Operations Center – Science Data Processing at Stanford University. We thank Dr. Ravindra for carefully reading the manuscript and providing his suggestions. R.E.L. and C.D. were supported by grant DE 787/3-1 of the German Science Foundation (DFG). P.G. acknowledges the support from grant VEGA 2/0108/12 of the Science Grant Agency. We thank the anonymous referee for the useful comments.References
- Balasubramaniam et al. (2004) Balasubramaniam, K. S., Pevtsov, A., & Rogers, J. 2004, ApJ, 608, 1148
- Balthasar et al. (2013) Balthasar, H., Beck, C., Gömöry, P., et al. 2013, Central European Astrophysical Bulletin, 37, 435
- Balthasar & Gömöry (2008) Balthasar, H. & Gömöry, P. 2008, A&A, 488, 1085
- Beck (2008) Beck, C. 2008, A&A, 480, 825
- Beck (2011) Beck, C. 2011, A&A, 525, A133
- Bellot Rubio et al. (2004) Bellot Rubio, L. R., Balthasar, H., & Collados, M. 2004, A&A, 427, 319
- Borrero & Ichimoto (2011) Borrero, J. M. & Ichimoto, K. 2011, Living Reviews in Solar Physics, 8, 4
- Borrero et al. (2008) Borrero, J. M., Lites, B. W., & Solanki, S. K. 2008, A&A, 481, L13
- Cabrera Solana et al. (2007) Cabrera Solana, D., Bellot Rubio, L. R., Beck, C., & Del Toro Iniesta, J. C. 2007, A&A, 475, 1067
- Cabrera Solana et al. (2008) Cabrera Solana, D., Bellot Rubio, L. R., Borrero, J. M., & Del Toro Iniesta, J. C. 2008, A&A, 477, 273
- Cabrera Solana et al. (2005) Cabrera Solana, D., Bellot Rubio, L. R., & del Toro Iniesta, J. C. 2005, A&A, 439, 687
- Chae et al. (2000) Chae, J., Denker, C., Spirock, T. J., Wang, H., & Goode, P. R. 2000, Sol. Phys., 195, 333
- Collados (1999) Collados, M. 1999, in Astronomical Society of the Pacific Conference Series, Vol. 184, Third Advances in Solar Physics Euroconference: Magnetic Fields and Oscillations, ed. B. Schmieder, A. Hofmann, & J. Staude, 3–22
- Collados et al. (2007) Collados, M., Lagg, A., Díaz Garcí A, J. J., et al. 2007, in Astronomical Society of the Pacific Conference Series, Vol. 368, The Physics of Chromospheric Plasmas, ed. P. Heinzel, I. Dorotovič, & R. J. Rutten, 611
- Dere et al. (1990) Dere, K. P., Schmieder, B., & Alissandrakis, C. E. 1990, A&A, 233, 207
- Evershed (1909) Evershed, J. 1909, MNRAS, 69, 454
- Georgakilas & Christopoulou (2003) Georgakilas, A. A. & Christopoulou, E. B. 2003, ApJ, 584, 509
- Hale (1925) Hale, G. E. 1925, PASP, 37, 268
- Hale (1927) Hale, G. E. 1927, Nature, 119, 708
- Harvey et al. (2011) Harvey, J. W., Bolding, J., Clark, R., et al. 2011, in AAS/Solar Physics Division Abstracts #42, 1745
- Harvey et al. (1996) Harvey, J. W., Hill, F., Hubbard, R. P., et al. 1996, Science, 272, 1284
- Haugen (1969) Haugen, E. 1969, Sol. Phys., 9, 88
- Jurčák et al. (2006) Jurčák, J., Martínez Pillet, V., & Sobotka, M. 2006, A&A, 453, 1079
- Lemen et al. (2012) Lemen, J. R., Title, A. M., Akin, D. J., et al. 2012, Sol. Phys., 275, 17
- Louis et al. (2008) Louis, R. E., Bayanna, A. R., Mathew, S. K., & Venkatakrishnan, P. 2008, Sol. Phys., 252, 43
- Louis et al. (2009) Louis, R. E., Bellot Rubio, L. R., Mathew, S. K., & Venkatakrishnan, P. 2009, ApJ, 704, L29
- Louis et al. (2011) Louis, R. E., Bellot Rubio, L. R., Mathew, S. K., & Venkatakrishnan, P. 2011, ApJ, 727, 49
- Mathew et al. (2003) Mathew, S. K., Lagg, A., Solanki, S. K., et al. 2003, A&A, 410, 695
- Okamoto et al. (2009) Okamoto, T. J., Tsuneta, S., Lites, B. W., et al. 2009, ApJ, 697, 913
- Peter (1996) Peter, H. 1996, MNRAS, 278, 821
- Puschmann et al. (2010a) Puschmann, K. G., Ruiz Cobo, B., & Martínez Pillet, V. 2010a, ApJ, 720, 1417
- Puschmann et al. (2010b) Puschmann, K. G., Ruiz Cobo, B., & Martínez Pillet, V. 2010b, ApJ, 721, L58
- Richardson (1941) Richardson, R. S. 1941, ApJ, 93, 24
- Ruiz Cobo & Asensio Ramos (2013) Ruiz Cobo, B. & Asensio Ramos, A. 2013, A&A, 549, L4
- Ruiz Cobo & del Toro Iniesta (1992) Ruiz Cobo, B. & del Toro Iniesta, J. C. 1992, ApJ, 398, 375
- Schou et al. (2012) Schou, J., Scherrer, P. H., Bush, R. I., et al. 2012, Sol. Phys., 275, 229
- Shimizu et al. (2009) Shimizu, T., Katsukawa, Y., Kubo, M., et al. 2009, ApJ, 696, L66
- Solanki (2003) Solanki, S. K. 2003, A&ARv, 11, 153
- Solanki et al. (1994) Solanki, S. K., Montavon, C. A. P., & Livingston, W. 1994, A&A, 283, 221
- St. John (1913) St. John, C. E. 1913, ApJ, 37, 322
- van Ballegooijen & Mackay (2007) van Ballegooijen, A. A. & Mackay, D. H. 2007, ApJ, 659, 1713
- van Ballegooijen & Martens (1989) van Ballegooijen, A. A. & Martens, P. C. H. 1989, ApJ, 343, 971
- von der Lühe et al. (2003) von der Lühe, O., Soltau, D., Berkefeld, T., & Schelenz, T. 2003, in Society of Photo-Optical Instrumentation Engineers (SPIE) Conference Series, Vol. 4853, Society of Photo-Optical Instrumentation Engineers (SPIE) Conference Series, ed. S. L. Keil & S. V. Avakyan, 187–193
- Wang & Muglach (2013) Wang, Y.-M. & Muglach, K. 2013, ApJ, 763, 97