THE ACS SURVEY OF GLOBULAR CLUSTERS††thanks: Based on observations
with the NASA/ESA Hubble Space Telescope, obtained at the Space
Telescope Science Institute, which is operated by AURA, Inc., under NASA
contract NAS 5-26555, under program GO-10775 (PI: A. Sarajedini).. XIII.
PHOTOMETRIC CALIBRATION IN
COMPARISON WITH
STETSON STANDARDS
Abstract
In this study we compare the photometric data of 34 Milky Way globular clusters, observed within the ACS Treasury Program (PI: Ata Sarajedini) with the corresponding ground-based data, provided by the Photometric Standard Field Catalogs of Stetson (2000, 2005).111This research used the facilities of the Canadian Astronomy Data Centre operated by the National Research Council of Canada with the support of the Canadian Space Agency. We focus on the transformation between the HST/ACS F606W to -band and F814W to -band only. The goal is to assess the validity of the filter transformation equations by Sirianni et al. (2005) with respect to their dependence on metallicity, Horizontal Branch morphology, mass and integrated color of the various globular clusters. Such a dependence is expected due to the fact that the transformation equations are based on the observations of only one globular cluster, i.e., NGC 2419. Surprisingly, the correlation between offset and metallicity is found to be weak, with a low level significance. The correlation between offset and Horizontal Branch structure, as well as total cluster mass is still weaker. Based on the available data we do not find the photometric offset to be linked to multiple stellar populations, e.g., as found in NGC 0288, NGC 1851, and NGC 5139. The results of this study show that there are small systematic offsets between the transformed ACS- and observed ground based photometry, and that these are only weakly correlated, if at all, with various cluster parameters and their underlying stellar populations. As a result, investigators wishing to transform globular cluster photometry from the Sirianni et al. (2005) ground-based , system onto the Stetson (2000) system simply need to add –0.040 (0.012) to the magnitudes and –0.047 (0.011) to the magnitudes. This in turn means that the transformed ACS colors match the ground-based values from Stetson (2000) to within 0.01 mag.
1 Introduction
The Advanced Camera for Surveys on board the Hubble Space Telescope
(Pavlovsky et al., 2004) is one of the cornerstones of astronomical
research. In particular, its high spatial resolution combined with its Wide Field
Channel make it exceptionally well suited to investigate dense stellar
systems like globular clusters, not only in our own Milky Way
(e.g., Sarajedini et al., 2007), but in extragalactic systems as well
(e.g., Côté et al., 2004; Jordán et al., 2007). The results of these studies are
often matched with independent data obtained with ground based
instruments to extend the field of view or the wavelength range
of the observations. However, it is important to note
that the ACS filters differ significantly from ground-based filter sets
and that the photometric transformation between them could depend on knowledge of
the underlying stellar population, e.g., the age or metallicity of the object being
observed. In addition, these photometric data,
resolved and integrated, are used to derive the metallicity and other
parameters of stars and stellar populations. Clearly, it is paramount to estimate
the accuracy of the photometric transformation procedure.
The standard ACS to ground-based photometric transformation equations, as described by Sirianni et al. (2005), are based on a comparison of ACS photometry in several bands for the Stetson standard field data in NGC 2419 (e.g., Stetson, 2000, 2005), a massive globular cluster in the Milky Way (Stetson, 2000, 2005; Baumgart et al., 2009). The Stetson data offer ground-based Johnson/Kron-Cousin , and -band photometry of 1300 stars. With a metallicity of (Zinn, 1985; Suntzeff, 1988) and total luminosity of (Harris, 1996, edition 2010, see also http://physwww.mcmaster.ca/ harris/mwgc.dat), NGC 2419 is not only one of the most metal-poor, but also the fourth brightest known Milky Way globular cluster. As recently discovered by Di Criscienzo et al. (2011), NGC 2419 contains “a large and extreme” second stellar generation, representing 30 of the total stellar population, and featuring a different He-content.
Applying filter transformation equations to any photometric data set
based on this cluster alone may therefore result in a systematic
offset between the transformed and directly measured photometry,
reducing the high quality of the original ACS data. These differences,
which we will henceforth call the ‘photometric offset’ or short
‘offset’, are the subject of this study. Here we compare the
transformed - and -band photometry of various Milky Way globular
clusters, derived from ACS F606W and F814W observations, with their
counterparts by Stetson (2000, 2005), i.e. Johnson , and
Cron-Cousin , respectively (which we will be calling and
throughout this paper). When referring to the ACS based data, we will
use the term ‘transformed’ and . Our goal is to search for, and
if confirmed, to quantify the correlation between the photometric
offset and various cluster parameters.
The outline of this paper is as follows. In Section 2 we
briefly describe the ACS and Stetson data set, and, in more
detail, discuss how both photometric catalogs were matched. Section
3 focuses on the photometric offsets and their
correlation with the globular cluster parameters, such as integrated
color, metallicity, and Horizontal Branch structure. Given that HB
structure and metallicity are closely linked, we will investigate the
correlation between photometric offset, metallicity and HB structure
separately for the HB stars only. Due to the mounting evidence that
more massive globular clusters tend to harbor multiple stellar
populations (e.g., Piotto, 2009; Milone et al., 2010; Roh et al., 2011), we include the
total cluster mass in the list of cluster parameters and discuss the
effect of NGC 5139, the most massive target cluster, which also known to host
multiple stellar populations
(e.g., Lee et al., 1999; Pancino et al., 2000; Bedin et al., 2004; Da Costa et al., 2009; Bellini et al., 2010). Given the wide spread of GC
parameters, Section 4 deals with the effects this
diversity may have on the standard deviation of the photometric
offset, and therefore the accuracy of the derived correlation
coefficients. We summarize our findings in Section
5.
2 Photometric Sample and Matching Procedure
This study is based on the photometric catalogs for 34 Milky Way
globular clusters (MWGCs) observed in the ACS Survey of Galactic
Globular Clusters (PI: Ata Sarajedini, see Sarajedini et
al. 2007) and the Photometric Standard Field Catalog by
P. Stetson222http://www4.cadc.hia.nrc.gc.ca/community/STETSON/standards.. Detailed
information on the data reduction applied to both samples can be found
in Sarajedini et al. (2007) and Anderson et al. (2008) for the ACS
survey and Stetson (2000, 2005), respectively. The purpose
of this study is to compare the converted and band photometry
of the ACS observations with their counterparts from Stetson and
hence particular care has to be taken when matching the photometry of
individual stars, given the high stellar density within the globular
clusters. In this section we will present the details of the matching
procedure.
To match the photometric data for each of the clusters
we use the ACS images, the Stetson source catalogs with RA and DEC
coordinates and the IRAF333IRAF is distributed by the National
Optical Astronomy Observatories, which are operated by the
Association of Universities for Research in Astronomy, Inc., under
cooperative agreement with the National Science Foundation. task
tfinder. The latter is used to adjust the plate solution of the
ACS images to correspond with the RA and DEC coordinates given by
Stetson. The required input information includes: the pixel scale of
the ACS images (0), the observation equinox (J2000.0), and the
world coordinates and pixel coordinates of the reference pixel within
the ACS image.
| Cluster | Num | rmsRA[arcsec] | rmDEC[arcsec] | Num |
|---|---|---|---|---|
| E 0003 | 50 | 0.0215775 | 0.0205797 | 207 |
| NGC 0104 | 12 | 0.0094098 | 0.0157275 | 36 |
| NGC 0288 | 19 | 0.0106115 | 0.0111964 | 108 |
| NGC 0362 | 23 | 0.0515514 | 0.0383049 | 118 |
| NGC 1261 | 14 | 0.0049360 | 0.0084422 | 49 |
| NGC 1851 | 19 | 0.0216507 | 0.0147235 | 54 |
| NGC 2298 | 17 | 0.0079661 | 0.0105671 | 86 |
| NGC 2808 | 15 | 0.0133545 | 0.0175066 | 148 |
| NGC 3201 | 18 | 0.0129494 | 0.0053085 | 66 |
| NGC 4147 | 38 | 0.0409929 | 0.0286021 | 255 |
| NGC 4590 | 23 | 0.0141201 | 0.0055300 | 44 |
| NGC 4833 | 24 | 0.0281217 | 0.0208677 | 35 |
| NGC 5053 | 23 | 0.0163323 | 0.0304663 | 35 |
| NGC 5139 | 19 | 0.0198540 | 0.0154449 | 49 |
| NGC 5272 | 27 | 0.0197264 | 0.0111676 | 46 |
| NGC 5286 | 20 | 0.0294617 | 0.0171257 | 26 |
| NGC 5466 | 12 | 0.0688927 | 0.0221558 | 9 |
| NGC 5904 | 46 | 0.0165915 | 0.0132720 | 260 |
| NGC 5927 | 19 | 0.0170713 | 0.0138404 | 14 |
| NGC 6093 | 6 | 0.0311338 | 0.0022479 | 6 |
| NGC 6171 | 7 | 0.0111846 | 0.0030558 | 8 |
| NGC 6205 | 21 | 0.0168024 | 0.0200496 | 105 |
| NGC 6341 | 40 | 0.0235042 | 0.0145158 | 631 |
| NGC 6352 | 21 | 0.0183443 | 0.0204583 | 75 |
| NGC 6362 | 13 | 0.0182156 | 0.0153341 | 18 |
| NGC 6397 | 25 | 0.0243064 | 0.0083323 | 112 |
| NGC 6441 | 23 | 0.0255059 | 0.0174784 | 83 |
| NGC 6541 | 30 | 0.0335179 | 0.0484386 | 77 |
| NGC 6752 | 21 | 0.0178754 | 0.0121514 | 46 |
| NGC 6809 | 41 | 0.0297873 | 0.0173643 | 149 |
| NGC 6838 | 19 | 0.0247012 | 0.0084462 | 25 |
| NGC 7078 | 44 | 0.0373419 | 0.0167781 | 239 |
| NGC 7089 | 32 | 0.0404868 | 0.0290307 | 83 |
| NGC 7099 | 35 | 0.0279548 | 0.0169936 | 50 |
The new plate solution is then used in
IRAF/wcsctran to convert the RA and DEC values of the Stetson
catalogs into corresponding xy-pixel coordinates in the ACS
images. This requires that a number () of stars in the Stetson
catalog are unmistakably identified in the ACS images, and are widely
distributed over the field of view. Table 1 gives the
number of stars in each cluster used to calculate the new plate
solution (column 2), as well as how much the original RA and DEC for
each star deviates from the one derived from the new plate solution
and the xy-pixel position. There are no multiple matches in any of the merged catalogs, only the
best fitting pair of ACS and Stetson detections are included in the
data base.
Although the ACS and Stetson globular cluster samples have 43 objects
in common only 34 were suitable for our study. The remaining 9 GCs (NGC 5024, NGC 5986, NGC 6101, NGC 6121, NGC 6218, NGC 6254,
NGC 6584, NGC 6656 and NGC 6723) do not overlap sufficiently in their
field of view to re-calculate the plate solution and hence to derive
their xy-pixel position with the required accuracy. We note that in
the final catalog, containing both ACS and Stetson
photometry, the RA and DEC coordinates are based on the high quality
ACS astrometry. The Stetson world-coordinates are used as a starting
point to obtain ACS pixel coordinates only.
To match the ACS and Stetson photometry we use TOPCAT (e.g., Taylor, 2005) and compare the xy-pixel coordinates of each detected star using the match option ‘2-D Cartesian’. We consider a star to match between both catalogs if the separation between the ACS and Stetson coordinates is not greater than 1.5 ACS pixel, i.e. 0075. The limit is based on the accuracy of the RA and DEC coordinates (see Table 1, column 3 and 4) obtained with tfinder, which is less than 005 in RA and DEC, corresponding to approximately 1 ACS pixel in each dimension. The 2D-pixel positions of matched objects should therefore differ by no more than 1.5 ACS pixels. Limiting the maximum pixel offset in such a way will inevitably reduce the number of matched stars in the combined ACSStetson catalog, but it will also reduce the probability of mismatches in the more crowded, central regions of an individual cluster.
For each cluster in our sample we derived the number of stars with 1
or more neighbors within the matching radius (as applied in the
catalog matching), which we consider bonafide candidates for mismatches. The ratio
between those stars and the total number of stars in the original ACS
catalog is a measure for the possible false matches. Obviously, this mismatch
rate depends on the position of a star, or its local stellar
density. Given that the corresponding Stetson stars, due to the lower
spatial resolution of the data, are mostly found in the outer regions
of the ACS FOV we can assume that the number of mismatches in the
combined ACS Stetson catalogs is much lower. We find that no cluster
has more than 4 stars with close neighbors. This ratio is higher for NGC 6441
(4.36), but as we will describe in Section 3.1, this
cluster will be excluded from further analysis. Including the high
accuracy of the transformed pixel coordinates (see Table 1) we assume that the closet match, as
found by TOPCAT, has a low risk of being a mismatch.
The photometric offset, as used in the further analysis, is always
calculated as the difference between the transformed ACS magnitudes
and its Stetson counterpart: - and
-, respectively.
3 Photometric offsets Relative to Cluster Properties
Following the matching of the photometric catalogs, we apply one additional selection criterion to the stellar sample of each globular cluster. Based on the ACS photometry, we reject all stars that were saturated on the ACS images. Even though (Gilliland, 2004) has shown that 1% photometry can be achieved for saturated stars on the ACS chips, we have decided to be conservative and eliminate these stars from the comparisons presented in this paper. As shown in Table 2, this reduces the total number of stars in NGC 6093 from 6 to only 2. Therefore, we will exclude this cluster from later analyses due to its low number statistics. For comparison we also derived the photometric offset between the two data sets, as well as the correlation coefficients for the complete matched cataloges, i.e. without applying any selection criteria. Although the mean offset for both filters is smaller, its standard deviation increases. Without going more into detail we find all correlations studied here to be weaker than for the selected sample, and will focus on the selected sample for the remainder of this study.
| Number | Nmatch | [M/H] | Age2 | l [deg]3 | b [deg]3 | |||||
|---|---|---|---|---|---|---|---|---|---|---|
| E 0003 | -0.1345 | 0.0293 | -0.0990 | 0.0254 | 2074 | -0.69 | 1.02 | 0.15 | 292.27 | -19.02 |
| NGC 0104 | -0.0252 | 0.1062 | -0.0548 | 0.1002 | 19 | -0.64 | 1.05 | 0.09 | 305.90 | -44.89 |
| NGC 0288 | -0.0452 | 0.0477 | -0.0687 | 0.0517 | 100 | -0.92 | 0.83 | 0.03 | 152.28 | -89.38 |
| NGC 0362 | -0.0610 | 0.1633 | -0.0634 | 0.1724 | 100 | -0.87 | 0.81 | 0.05 | 301.53 | -46.25 |
| NGC 1261 | -0.0290 | 0.1120 | -0.0462 | 0.0633 | 38 | -0.86 | 0.79 | 0.05 | 270.54 | -52.13 |
| NGC 1851 | -0.0662 | 0.0667 | -0.0925 | 0.0861 | 52 | -0.81 | 0.75 | 0.04 | 244.51 | -35.04 |
| NGC 2298 | -0.0351 | 0.0607 | -0.0498 | 0.0473 | 71 | -1.49 | 0.99 | 0.05 | 245.63 | -16.01 |
| NGC 2808 | -0.0641 | 0.0865 | -0.0894 | 0.0837 | 108 | -0.89 | 0.85 | 0.02 | 282.19 | -11.25 |
| NGC 3201 | -0.0225 | 0.0640 | -0.0521 | 0.0311 | 36 | -1.02 | 0.81 | 0.03 | 277.23 | 8.64 |
| NGC 4147 | -0.0278 | 0.0412 | -0.0272 | 0.0371 | 232 | -1.28 | 0.89 | 0.03 | 252.85 | 77.19 |
| NGC 4590 | -0.0197 | 0.0304 | -0.0413 | 0.0199 | 26 | -1.78 | 0.91 | 0.04 | 299.63 | 36.05 |
| NGC 4833 | -0.0568 | 0.0722 | -0.0815 | 0.0701 | 33 | -1.49 | 0.98 | 0.05 | 303.61 | -8.01 |
| NGC 5053 | -0.0285 | 0.0615 | -0.0477 | 0.0203 | 27 | -1.76 | 0.96 | 0.04 | 335.69 | 78.94 |
| NGC 5139 | -0.0321 | 0.0941 | -0.0721 | 0.1137 | 19 | -1.13 | 0.89 | 0.05 | 309.10 | 14.97 |
| NGC 5272 | -0.0438 | 0.0427 | -0.0586 | 0.0451 | 27 | -1.12 | 0.89 | 0.04 | 42.21 | 78.71 |
| NGC 5286 | -0.0183 | 0.0598 | -0.0506 | 0.0469 | 21 | -1.19 | 0.98 | 0.05 | 311.61 | 10.57 |
| NGC 5466 | -0.0450 | 0.0263 | -0.0460 | 0.0301 | 7 | -1.98 | 1.07 | 0.05 | 42.15 | 73.59 |
| NGC 5904 | -0.0727 | 0.0825 | -0.0815 | 0.0655 | 208 | -0.90 | 0.83 | 0.02 | 3.86 | 46.80 |
| NGC 5927 | -0.0584 | 0.0689 | -0.0547 | 0.1161 | 9 | -0.50 | 1.01 | 0.11 | 326.60 | 4.86 |
| NGC 6093 | 0.0650 | 0.1273 | 0.0140 | 0.1061 | 2 | -1.25 | 0.98 | 0.05 | 352.67 | 19.46 |
| NGC 6171 | -0.0364 | 0.0346 | -0.0397 | 0.0235 | 8 | -0.81 | 1.13 | 0.08 | 3.37 | 23.01 |
| NGC 6205 | -0.0152 | 0.0665 | -0.0411 | 0.0727 | 51 | -1.11 | 0.90 | 0.04 | 59.01 | 40.91 |
| NGC 6341 | -0.0191 | 0.0446 | -0.0342 | 0.0438 | 564 | -1.94 | 1.03 | 0.05 | 68.34 | 34.86 |
| NGC 6352 | -0.0434 | 0.0394 | -0.0582 | 0.0340 | 61 | -0.56 | 1.02 | 0.10 | 341.42 | -7.17 |
| NGC 6362 | -0.0028 | 0.0276 | 0.0080 | 0.0257 | 14 | -0.85 | 1.07 | 0.06 | 325.55 | -17.57 |
| NGC 6397 | -0.0395 | 0.0244 | -0.0373 | 0.0248 | 112 | -1.54 | 0.99 | 0.04 | 338.17 | -11.96 |
| NGC 6441 | -0.0803 | 0.0631 | 0.1311 | 0.0842 | 49 | -0.46 | 0.85 | 0.09 | 353.53 | -5.01 |
| NGC 6541 | -0.0678 | 0.0671 | -0.0791 | 0.0670 | 77 | -1.31 | 1.01 | 0.04 | 349.48 | -11.09 |
| NGC 6752 | -0.0460 | 0.0452 | -0.0451 | 0.0466 | 36 | -1.02 | 0.92 | 0.04 | 336.49 | -25.63 |
| NGC 6809 | -0.0600 | 0.0525 | -0.0861 | 0.0619 | 149 | -1.32 | 0.96 | 0.05 | 8.80 | -23.27 |
| NGC 6838 | -0.0254 | 0.0298 | -0.0275 | 0.0390 | 22 | -0.59 | 1.11 | 0.10 | 56.74 | -4.56 |
| NGC 7078 | -0.0050 | 0.0891 | -0.0159 | 0.1108 | 123 | -1.80 | 1.01 | 0.04 | 65.01 | -27.31 |
| NGC 7089 | -0.0424 | 0.0769 | -0.0671 | 0.0767 | 60 | -1.09 | 0.91 | 0.05 | 53.38 | -35.78 |
| NGC 7099 | -0.0415 | 0.0339 | -0.0477 | 0.0301 | 49 | -1.70 | 1.01 | 0.04 | 27.18 | -46.83 |
| Average | -0.0396 | 0.0629 | -0.0471 | 0.0610 |
3.1 Observational Properties: Magnitude, Color & Photometric Errors
A comparison between the GC color-magnitude diagrams for selected Globular Clusters444All plots and matched ACS-Stetson catalogs are available on request. is shown in Figure 1, where black symbols represent the transformed ACS and band data, while red symbols correspond to their Stetson counterparts. In general we find that some clusters show very good agreement between the space-based and ground-based photometry (e.g., NGC 4147, NGC 5904, NGC 6397), as well as some for which either the or band photometry show a significant offset (e.g., E 3), reaching up to 0.3 mag. The specific offsets become easier to follow when we plot star-by-star differences between the transformed and observed magnitudes in both filters, shown for the selected clusters in Figures 2 and 3. For example, in the case of E 3, the matched photometric catalog contains 207 stars following the selection criteria as described in Section 2.

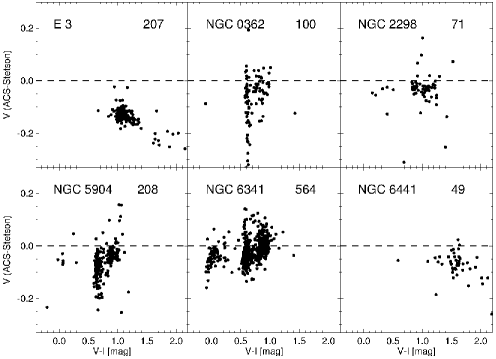
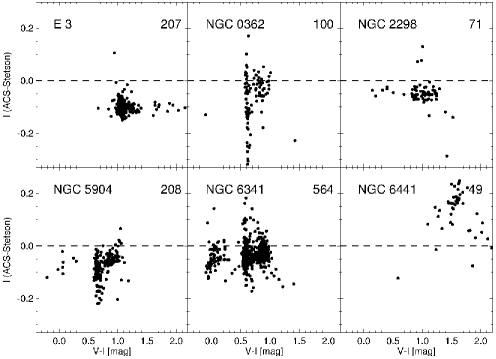
The difference between the transformed ACS -band and the Stetson
photometry shows a clear negative trend with color, whereas no
such trend is seen in the -band diagram. On the other hand,
NGC 6441 features a negative slope in the vs.
relation and a positive one in vs. . The
transformed -band photometry is also brighter than its Stetson
counterpart, with the difference increasing as color increases. In
contrast, the ACS-- band is fainter, the effect being stronger for
redder stars. This trend differs from that of all of the other
clusters, for which the ACS -band follows the trend of the
band being the brighter one. At this point, we are unable to trace the
reason for this unusual behavior, but note that the original source
catalog by Stetson is based on the fewest number of observations. We
therefore exclude NGC 6441 from the correlation analysis.
We combine the data for all of the clusters and compare the transformed ACS magnitudes with their Stetson counterparts. Figure 4 shows the complete sample with the transformed ACS color and the photometric offset in both filters. For both filters we find a population of stars that do not follow the general trend, i.e. showing a larger photometric offset than the bulk of the stars with the same color. These stars are plotted as open diamonds and belong almost exclusively to E 3. The resulting correlation coefficients between the offset and the color (as given by Stetson) of the individual stars (excluding E 3), are 0.02 for the relation and -0.06 for the relation.
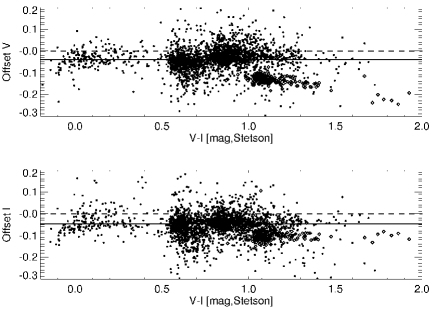
In general, the transformed -band magnitudes are brighter than their Stetson counterparts, and show a smaller spread around the ‘zero’ line as compared with the -band. The mean offset for the complete stellar sample (in total 2461 stars) and their standard deviations (again excluding E 3) are calculated as (; =0.0703) and (; =0.0711), which is in agreement with the result based on the average offset for 34 MWGCs.
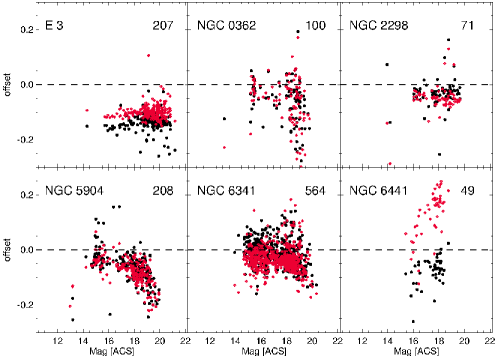
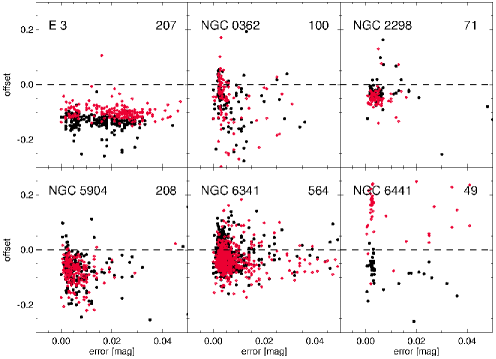
Before we discuss the correlation between the photometric offsets and
globular cluster properties, we need to consider the possibility that
differences in the photometry are due to the magnitude of the stars
and/or the photometric accuracy. Figures 5 and
6 show, for each cluster separately, the photometric
offset in both filters as a function of the ACS magnitudes and of the
corresponding photometric errors. As in the color plots, we
find a wide range of features. Some, e.g. NGC 0104, NGC 2808 show
the largest offset for the brighter, although not saturated stars, and
despite the fact that they have the smallest photometric errors. In
contrast, we find that the brighter stars in NGC 5904 and NGC 6809
show smaller photometric offsets as compared with the fainter
ones. However, in general there is no significant systematic
correlation between the photometric errors and the photometric
offsets.
3.2 Integrated and Resolved Color, Metallicity, Mass, Composite Populations
Our sample of MWGCs allows us to search for correlations between the
photometric offsets and globular cluster properties such as
metallicity, integrated color, horizontal branch morphology, and
globular cluster mass. For our analysis, we use the mean difference
between the transformed ACS magnitude and its counterpart as given by
Stetson (2000, 2005). In addition, we also investigate the
correlations between different GC parameters and the spread of the
offset, i.e., the standard deviation, in particular to assess the
significance of the correlation between the offset and globular
cluster parameters. In all of the following figures, open symbols
represent the (mean) photometric offset, whereas filled symbols
represent the standard deviation . A large open triangle marks
NGC 2419, whose photometry was originally used to derive the standard transformation
equations. In the discussion of our results we will also include
, the probability (non-directional) that the
Pearson correlation coefficient between the photometric offset
and a given cluster parameter, could also be based on an uncorrelated sample. Hence,
the higher the probability, which we will call the significance level,
the less significant is the correlation. We note that is the
number of data points ( 31), and depends on the cluster
parameter, e.g., E 3 does NOT have an integrated value.
All of the correlations and related quantities for the -band are listed
in Table 3 and those for the -band are in Table 4.
| Parameter | Prob | stddevV | |
|---|---|---|---|
| -0.119 | 0.255 | 0.0284 | |
| -0.3038 | 0.091 | 0.2243 | |
| HBR | -0.0234 | 0.451 | -0.2767 |
| -0.0668 | 0.363 | -0.1949 | |
| Mass | -0.0229 | 0.903 | 0.4700 |
| Parameter | Prob | stddevI | |
|---|---|---|---|
| -0.0905 | 0.299 | -0.0543 | |
| -0.2391 | 0.187 | 0.2651 | |
| HBR | -0.0769 | 0.343 | -0.2748 |
| -0.1748 | 0.178 | -0.2024 | |
| Mass | -0.3089 | 0.091 | 0.5351 |
3.2.1 Integrated / Resolved Color
In Figure 7 we show the and
offsets as a function of the integrated color of each cluster
and the corresponding correlation coefficients. We are interested in
this correlation since the integrated color is based only on
observations and does not include any stellar population models, but
also because it depends on the cluster metallicity. We would therefore
expect the correlations between photometric offset and either
integrated color and metallicity to be conform. The colors
were corrected for galactic extinction, where both, and
were taken from (Harris, 1996, on-line edition
2010). The latter was converted into using the
prescription by Cardelli, Clayton & Mathis (1989) and Barmby et al. (2000):
=1.26*.
The linear correlation coefficient between
the photometric offset and the integrated color, as well as
the corresponding significance levels are given in Table
3 and Table 4.
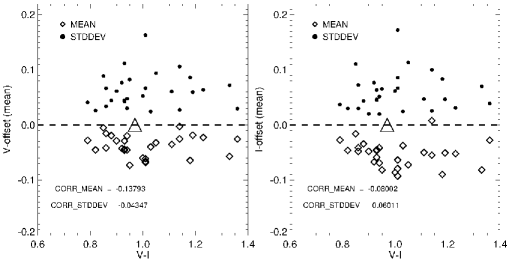
There is no significant correlation between the integrated color and the photometric offset in our sample, the same is valid for uncorrected colors. However, based on the offset in the -band (see Figure 7, right panel) clusters bluer than NGC 2419 show a much stronger correlation compared to the complete color range. Selecting only clusters with , the correlation coefficients are ; = 0.0277 for the -band and ; = 0.0002 for the -band.
In comparison, there is no significant correlation between magnitude offset and
integrated cluster color for objects redder then NGC 2419.
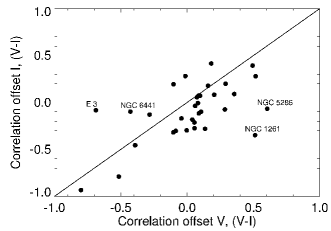
Since the integrated globular cluster color depends on the underlying stellar populations, and also on a proper correction for galactic extinction, the weak correlations between integrated color and photometric offset become understandable. In contrast, when we compare the correlation coefficients for both the - and - band filters within an individual cluster, as shown in Figure 8, we find them to be consistent. That is to say, a correlation between -band offset and resolved individual (stellar) color is mirrored by a correlation between -band offset and color. The correlation between the two filters was derived to be 0.6138, with a high level of significance (=).
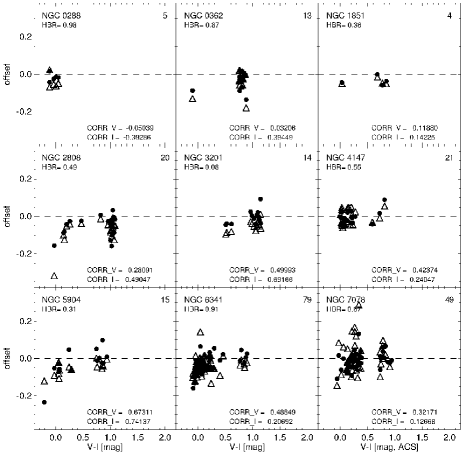
In Figure 9 we select only the HB stars, because they cover
a wide range of color, and also belong to the same
evolutionary phase. We select only clusters with a well defined
Horizontal Branch, e.g., NGC 0288, NGC 0362, NGC 1851, NGC 2808,
NGC 3201, NGC 4147, NGC 5904, NGC 6341, and NGC 7078. We find
that the correlation between the photometric offset and the
color of the individual stars varies significantly. Interestingly, the
strongest correlation between photometric offset and is found
in clusters with the most evenly populated Horizontal Branches, i.e.,
HBR0. For example, for NGC 5904 (HBR=0.31) and NGC 3201
(HBR= 0.05), the correlation coefficients were estimated to be
[, ], and
[ , ], respectively. In contrast, clusters
with a very blue or very red Horizontal Branch, e.g., NGC 0288, or
NGC 0362, show very little correlation between the photometric offset
and the color. We note that these are also the globular
clusters for which the HB structure implies a second parameter spread,
given their very different HBs despite their similar metallicities
(see Section 3.2.2.)
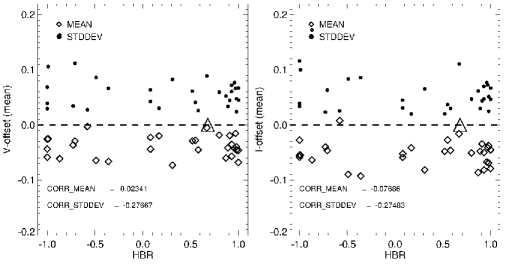
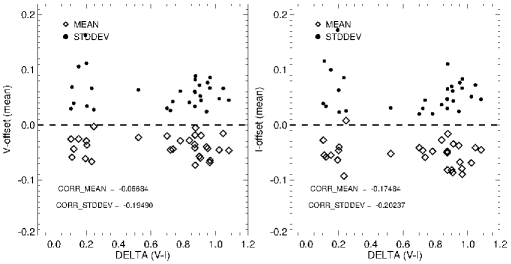
The Horizontal Branch morphology is one of the most discerning globular cluster parameters, i.e. revealing differences in the chemical composition beyond the matellicity, e.g. in NGC 0288 and NGC 0362 (see above). Therefore, we also examined the correlation between the photometric offset for each cluster and the Horizontal Branch structure. To do so we use the Horizontal Branch Ratio calculated as from Harris (1996) (Figure 10). In this formulation, and denote the numbers of stars on the or side of the RR Lyrae gap, whereas represents the number of on the Horizontal Branch (Zinn, 1986; Lee, 1990). Although the quantification of the Horizontal Branch structure via the HBR is a valuable parameter, in the case of very blue (e.g., NGC 0288, NGC 6341) or very red (e.g., NGC 0362) Horizontal Branches, the HBR can become insensitive to the HB morphology (Catelan et al., 2001, and references therein). Therefore we repeat the correlation test and in Figure 11 show the median color difference between the HB and the RGB (Dotter et al., 2010). The correlation coefficients in both cases are in the range of 0.02 and 0.17, and can therefore be considered to be negligible.
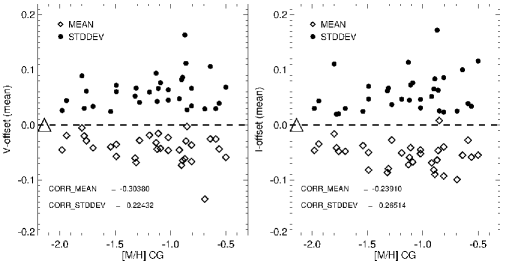
3.2.2 Metallicity
As stated by Sirianni et al. (2005), transforming accurately between ACS filters and ground-based filters can be complicated, with potential dependencies on the stellar spectrum, metallicity, and other stellar parameters. The metallicity is likely to be important, but not the only factor playing a role in the filter transformation equations. It is also one of the main parameters affecting the integrated cluster color (see Section 3.2.1), as well as the HB structure (see previous section). The clusters in our sample have metallicities ranging from (NGC 5466) up to (NGC 5927), excluding NGC 6441 with . In Figure 12 we show the difference in the two filter offsets, and , as a function of the metallicity for each globular cluster. The global metallicities [M/H] were taken from Marín-Franch et al. (2009) and calculated from [Fe/H] iron abundances using the prescription by Salaris et al. (1993). Based on the correlation coefficients as given in Table 3 and Table 4, we conclude that there is a small if any correlation between the - and -band photometric offsets and the cluster metal abundance.
3.2.3 Mass
Recent studies have shown that galactic globular clusters are not single stellar populations in the strictest sense, a fact first established for the most massive globular clusters. Although two of the more prominent cases, NGC 1851 and NGC 5139, are also part of this study, it should be noted that NGC 2419 is also among the more massive clusters in the Milky Way and has indeed been found to host a second generation of He-enriched stars (Di Criscienzo et al., 2011). We also note that the value for the NGC 2419 mass, given by Gnedin & Ostriker (1997), 1.6106M⊙, differs significantly (up to 50) from the values published by Brüns & Kroupa (2011), and references therein, which range from 0.9 to 1.19 106M⊙ therefore placing the target clusters in relative context to NGC 2419 is difficult. However, in Figure 13 we show the photometric offset in the two filter bands as a function of the total cluster mass (Gnedin & Ostriker, 1997, and references therein).
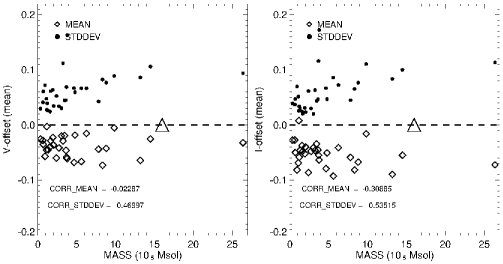
The correlation coefficients suggest that there is no statistically significant correlation between the photometric offsets and the masses of the globular clusters. There is a slight tendency for more massive clusters to exhibit a greater dispersion in their magnitude offsets compared with lower mass clusters; however, this could also be a result of the possibility that the photometry of more massive clusters is more likely to be subject to the effects of crowding than that of less massive clusters.
4 Extreme Cases of Photometric Offsets
Our photometric sample is very diverse. Some clusters contain only RGB stars (e.g., NGC 0104, NGC 5139, NGC 6093), whereas others include MS, SGB, RGB as well as HB stars (e.g., NGC 0288, NGC 5904, NGC 6341). The extreme cases, showing the largest discrepancy between the observed and transformed photometry, or the largest spread in photometric offset, are hence of special interest. The largest offset in both the and bands is found for the cluster E 3. Based on the color magnitude diagram (see Figure 1), the E 3 sample may include field stars and hence not represent a single metallicity, used in the correlation test, i.e. although not being cluster stars but assumed to have the E 3 metallicity, integrated color and HBR. If those stars are indeed contaminants and not cluster stars including them in the analysis will affect the mean offset and consequetially the results of the correlation tests. This may also be true for several other target clusters, not due to contamination by field stars, but because they do not follow the ’single stellar population’ paradigm as shown by Piotto (2009), and references therein. In our sample these are NGC 0104 (Anderson et al., 2009; Di Criscienzo et al., 2010), NGC 0288 (Piotto et al., 2007; Roh et al., 2011), NGC 1851 (Han et al., 2009), and NGC 5139 (e.g., Lee et al., 1999; Pancino et al., 2000; Bedin et al., 2004; Bellini et al., 2010, see also Figure 14), which all have been found to host multiple Main Sequence, Sub-Giant Branch and/or Red Giant Branch populations. However, in our analysis here the respective stellar samples are too small to show a significant effect, e.g., an increased spread in the photometric offset.
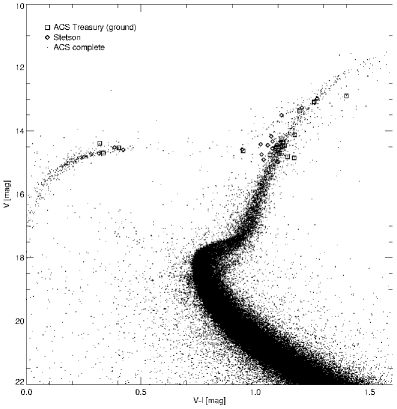
Figure 14 shows the color magnitude diagram of NGC 5139. Of the 19 stars with both ACS and Stetson photometry, only three may belong to a slightly redder RGB, i.e. be of higher metallicity than the bulk of the RGB stars. However, only one of those stars shows a photometric offset of -0.3 mag in the -band, which does not affect the mean offset or its standard deviation significantly.
The largest dispersion in photometric offset (see Table 2) is found in a different cluster, NGC 0362 (with a sample containing 100 stars). This is somewhat unexpected given that NGC 0362 has a very well defined color-magnitude diagram, with no apparent contaminants. Comparing its properties with the other clusters of our sample, NGC 0362 is by no means an exceptional cluster. Nevertheless, NGC 0362 (in combination with NGC 0288) has been the subject of many studies (Stetson, VandenBerg & Bolte, 1996, and references therein), due to their different HB morphologies despite similar metallicities and -abundances. The question remains as to why NGC 0362 displays a typical photometric zeropoint offset but an unusually large standard deviation.
With respect to the minimum discrepancy between transformed and
observed - and -band, the situation is less clear. NGC 6362,
one of the more metal-rich MWGCs () shows the smallest
photometric offsets in both filters (-band: ,
-band: 0.0080/0.0060 for mean/median offset). However, the
NGC 6362 sample contains only 14 stars, which makes this a less solid
result compared with the NGC 6205 sample, containing 51
stars. NGC 5053 with 27 stars agrees very well in the band, and
is with respect to the CMD very similar to NGC 2419, with a populated
RGB and HB in the combined ACS- and Stetson sample.
The available data set shows clearly that the filter transformation based on NGC 2419 alone indeed introduces a systematic offset between the transformed - and -band magnitudes and their observed counterparts. The correlation between the offset and various cluster parameters causes deviations between the observed and transformed magnitudes of up to 0.3 mag, depending on the filter band.
5 Summary
The transformation equations traditionally used to convert the ACS F606W and F814W filters of the Wide-Field Camera into ground-based Johnson-Cousin - and - band magnitudes are based on observations of NGC 2419, one of the most metal-poor and most massive globular clusters in the Milky Way (Harris, 1996, and references therein). In our study we confirm the existence of systematic offsets, expected due to the differences in stellar spectral energy distributions, in the converted ACS photometry and their ’original’ ground based counterparts. The latter can, in extreme cases (E 3), reach up to 0.3 mag. However, there are no statistically significant correlations between globular cluster properties, such as metallicity, and the difference between the transformed and observed magnitudes. To the extent that they exist, these correlations seem to be greater in the -band than in . The strongest correlation has been found between the photometric offset and the integrated cluster color, followed by metallicity and total mass.
The correlation between the photometric offset and the total cluster mass is less clear and varies between the two filters. We note as well, that the integrated globular cluster colors (Harris, 1996), as well as their masses (Gnedin & Ostriker, 1997, and references therein) are a compilation of different sources, and hence are less uniform.
The transformation equations by Sirianni et al. (2005) are based on
the observations of 30-60 NGC 2419 stars, depending on the filter
band. Here we provide a database of combined ACS and ground based
optical photometry (- and -band), which in some cases (e.g.,
NGC 6341) included several hundreds of stars, populating the whole
color-magnitude diagram. However, as seen in Figure 1, not
only do the number of stars vary widely, but so does the relative
coverage of the color magnitude diagram. NGC 0288, NGC 5904 and
NGC 6341 have the largest number of stars with combined ACS and
ground based photometry, as well as the widest range of evolutionary
stages, including MS, SGB, RGB, and HB. NGC 6093, which includes only
two stars on the RGB, has been excluded from the correlation
analysis. Additional tests have shown that if we restrict our sample
to only stars above the MSTO, and hence mimickin the NGC 2419 sample
used by Sirianni et al. (2005) more closely, the various linear
correlations between the photometric offset and the cluster parameters
are unchanged. In a separate series of correlation tests, we excluded
NGC 5139 from the cluster sample, given that this MWGC is known to
host various stellar populations (see Piotto, 2009, and references
therein), featuring partly different
metallicities. However, the only correlation that is significantly
affected is the one between mass and the photometric offset. This is
not surprising, given that NGC 5139 is also by far the most massive
cluster in our sample, and as a result defines the correlation at the
high mass end. In all other correlation tests,
rejecting NGC 5139 changed the results insignificantly.
As described in Section 3 we exclude saturated stars from the analysis presented here. However, the correlation test for an unselected sample, i.e. without rejecting saturated stars, finds all correlations to be weaker, with a smaller mean offset, but a larger standard deviation for both filters.
The results of this study show that there are small systematic offsets between transformed ACS and observed ground based photometry, and that these are only weakly correlated, if at all, with various cluster parameters and their underlying stellar population. As a result, investigators wishing to transform globular cluster photometry from the Sirianni et al. (2005) ground-based , system onto the Stetson (2000) system simply need to add –0.040 (0.012) to the magnitudes and –0.047 (0.011) to the magnitudes. The quoted errors in each case represent the average value of the standard errors of each mean offset. This in turn means that the transformed ACS colors match the ground-based values from Stetson (2000) to within 0.01 mag. We note that these offsets are the average of the mean offset for all clusters in our sample (see also Table 2). In contrast to that the results in Section 3.1 are the mean offset for all individual stars, excluding E 3 and NGC 6441. However, within the photometric errors the average and mean offset are in agreement.
References
- Anderson et al. (2008) Anderson, J., Sarajedini, A., Bedin, L. R. and King, I. R. and Piotto, G. et al. 2008, AJ, 135, 2055
- Anderson et al. (2009) Anderson, J., Piotto, G., King, I.R., Bedin, L.R., Guhathakurta P. 2009, ApJ, 697, 58
- Barmby et al. (2000) Barmby, P., Huchra, J. P., Brodie, J. P., Forbes, D. A., Schroder, L. L. et al. 2000, AJ, 119, 727
- Baumgart et al. (2009) Baumgardt, H., Côté, P., Hilker, M., Rejkuba, M., Mieske, S. et al. 2009, MNRAS, 396, 2051
- Bedin et al. (2004) Bedin, L. R., Piotto, G., Anderson, J., Cassisi, S., King, I. R. 2004, ApJ, 605, 125
- Bellini et al. (2010) Bellini, A., Bedin, L. R., Piotto, G. et al. 2010,AJ, 140, 631
- Brüns & Kroupa (2011) Brüns, R.C. & Kroupa, P. 2011, ApJ, 729, 69
- Buonanno (1993) Buonanno, R. 1993, ASP Conference Series, 48, 131
- Cardelli, Clayton & Mathis (1989) Cardelli, J. A., Clayton, G. C., Mathis, J. S. 1989, ApJ, 345, 245
- Carretta & Gratton (1997) Carretta, E. and Gratton, R. G 1997, A&AS, 121, 95
- Carretta et al. (2013) Carretta, E., Gratton, R.G., Bgragalia, A., D’Orazi, V. ,Lucatello, S. et al. 2013, ApJ, 769, 40
- Catelan et al. (2001) Catelan, M., Bellazzini, M., Landsman, W. B., Ferraro, F. R., Fusi Pecci, F. et al. 2001, AJ, 122, 3171
- Côté et al. (2004) Côté, P., Blakeslee, J. P., Ferrarese, L., Jordán, A., Mei, S. 2004, ApJS, 153, 223
- Da Costa et al. (2009) Da Costa, G.S., Held, E.V. Saviane, I, Gullieuszik, M. 2009, MNRAS, 705, 1481
- Dieball et al. (2009) Dieball, A., Knigge, C., Maccarone, T. J., Long, K. S., Hannikainen, D. C. et al. 2009, MNRAS, 394, L56
- Di Criscienzo et al. (2010) Di Criscienzo, M., Ventura, P., D’ Antona, F., Milone, A., Piotto G. 2010, MNRAS, 408, 999
- Di Criscienzo et al. (2011) Di Criscienzo, M., D’Antona, F., Milone, A.P., Ventura, P., Caloi, V. et al. (2011), MNRAS, accepted
- Dotter et al. (2010) Dotter, A., Sarajedini, A., Anderson, J., Aparicio, A., Bedin, L. R. 2010, ApJ, 708, 698
- Fusi Pecci & Bellazzini (1997) Fusi Pecci, F. & Bellazzini, M. 1997, in “The Third Conference on Faint Blue Stars”, eds. Philip, Liebert, Saffer & Hayes, publ. by L. Davies Press, 255
- Gilliland (2004) Gilliland, R. 2004, ACS/ISR 2004-01, CCD Gains, Full Well Depths, and Linearity up to and Beyond Saturation
- Gnedin & Ostriker (1997) Gnedin, O. Y., Ostriker, J. P. 1997, ApJ, 474, 223
- Gratton et al. (2010) Gratton, R. G., Carretta, E., Bragaglia, A., Lucatello, S., D’Orazi, V. 2010, A&A, 517, 81
- Han et al. (2009) Han, S.-I., Lee, Y.-W., Joo, S.-J., Sohn, S. T., Yoon, S.-J. 2009, ApJ, 707, 190
- Harris (1996) Harris, W.E. 1996, AJ, 112, 1487, 2010 edition
- Jordán et al. (2007) Jordán, A., Blakeslee, J. P., Côté, P., Ferrarese, L., Infante, L. 2007, ApJS, 169, 213
- Lee (1990) Lee, Y.-W. 1990, ApJ, 363, 159
- Lee (1993) Lee, Y.-W. 1993, ASP Conference Series, 48, 142
- Lee et al. (1999) Lee, Y.-W., Joo, J.-M., Sohn, Y.-J. et al. 1999, Nature, 402, 55
- Marín-Franch et al. (2009) Marín-Franch, A., Aparicio, A., Piotto, G., Rosenberg, A., Chaboyer, B. et al. 2009, ApJ, 694, 1498
- Milone et al. (2010) Milone, A. P., Piotto, G., Bedin, L. R., Bellini, A., Marino, A. F. et al. 2010, SF2A-2010: Proceedings of the Annual meeting of the French Society of Astronomy and Astrophysics, 319
- Pancino et al. (2000) Pancino, E., Ferraro, F. R., Bellazzini, M., Piotto, G., Zoccali, M. 2000, ApJ, 534, L83
- Pavlovsky et al. (2004) Pavlovsky, C., et al. 2005, ”ACS Data Handbook”, Version 4.0, (Baltimore: STScI)
- Piotto et al. (2005) Piotto, G., Villanova, S., Bedin, L. R. et al. 2005, ApJ, 621, 777
- Piotto et al. (2007) Piotto, G., Bedin, L. R., Anderson, J., King, I. R., Cassisi, S. 2007, ApJ, 661, 53
- Piotto (2009) Piotto, G. 2009, Proceedings IAU Symposium, 258, 233
- Roh et al. (2011) Roh, D.-G., Lee, Y.-W., Joo, S.-J. et al. 2011, ApJ, 733, 45
- Rood, Whitney & D’Cruz (1997) Rood, R.T., Whitney, J. & D’Cruz, N. 1997, in ’Advances in Stellar Evolution, eds. R.T. Rood & A. Renzini, Cambridge University Press, 74
- Salaris et al. (1993) Salaris, M., Chieffi, A., Straniero, O. 1993, ApJ, 414, 580
- Sarajedini, Charboyer & Demarque (1997) Sarajedini, A., Chaboyer, B. & Demarque, P. 1997, PASP, 109, 1321
- Sarajedini et al. (2007) Sarajedini, A., Bedin, L. R., Chaboyer, B., Dotter, A. and Siegel, M. 2007, AJ, 133, 1658
- Sirianni et al. (2005) Sirianni, M., Jee, M. J., Benítez, N., Blakeslee, J. P., Martel, A. R. 2005, PASP, 117, 1049
- Stetson, VandenBerg & Bolte (1996) Stetson, P., VandenBerg, D. A., & Bolte, M. 1996, PASP, 108, 560
- Stetson (2000) Stetson, P. B. 2000, PASP, 112, 925
- Stetson (2005) Stetson, P. B. 2005, PASP, 117, 563
- Suntzeff (1988) Suntzeff, N. B. and Kraft, R. P. and Kinman, T. D 1988, AJ, 95, 91
- Taylor (2005) Taylor, M. B. 2005, Astronomical Society of the Pacific Conference Series, 347, 29
- Zinn (1985) Zinn, R. 1985, ApJ, 293,424
- Zinn (1986) Zinn, R. 1986, Proceedings of the Meeting ’Stellar Populations’, Baltimore, MD, May 20-22, 1986, Cambridge and New York, Cambridge University Press, 73