email: mhenze@sciops.esa.int 33institutetext: INAF-Napoli, Osservatorio Astronomico di Capodimonte, Salita Moiariello 16, I-80131 Napoli, Italy 44institutetext: International Centre for Relativistic Astrophysics, Piazzale della Repubblica 2, I-65122 Pescara, Italy 55institutetext: Departament de Física i Enginyeria Nuclear, EUETIB, Universitat Politècnica de Catalunya, c/ Comte d’Urgell 187, 08036 Barcelona, Spain 66institutetext: Institut d’Estudis Espacials de Catalunya, c/Gran Capità 2-4, Ed. Nexus-201, 08034, Barcelona, Spain 77institutetext: Department of Astrophysics, Astronomy and Mechanics, Faculty of Physics, University of Athens, Panepistimiopolis, GR15784 Zografos, Athens, Greece 88institutetext: Institut de Ciències de l’Espai (CSIC-IEEC), Campus UAB, Fac. Ciències, E-08193 Bellaterra, Spain 99institutetext: Department of Physics and Astronomy, Clemson University, Clemson, SC 29634-0978, USA
X-ray monitoring of classical novae in the central region of M 31
III. Autumn and winter 2009/10, 2010/11, and 2011/12††thanks: Partly based on observations with XMM-Newton, an ESA Science Mission with instruments and contributions directly funded by ESA Member States and NASA
Abstract
Context. Classical novae (CNe) represent the major class of supersoft X-ray sources (SSSs) in the central region of our neighbouring galaxy M 31.
Aims. We performed a dedicated monitoring of the M 31 central region, which aimed to detect SSS counterparts of CNe, with XMM-Newton and Chandra between Nov and Mar of the years 2009/10, 2010/11, and 2011/12.
Methods. We systematically searched our data for X-ray counterparts of CNe and determined their X-ray light curves and also their spectral properties in the case of XMM-Newton data. Additionally, we determined luminosity upper limits for all previously known X-ray emitting novae, which are not detected anymore, and for all CNe in our field of view with recent optical outbursts.
Results. In total, we detected 24 novae in X-rays. Seven of these sources were known from previous observations, including the M 31 nova with the longest SSS phase, M31N 1996-08b, which was found to fade below our X-ray detection limit 13.8 yr after outburst. Of the new discoveries, several novae exhibit significant variability in their short-term X-ray light curves with one object showing a suspected period of about 1.3 h. We studied the SSS state of the most recent outburst of a recurrent nova, which had previously shown the shortest time ever observed between two outbursts ( yr). The total number of M 31 novae with X-ray counterpart was increased to 79, and we subjected this extended catalogue to detailed statistical studies. Four previously indicated correlations between optical and X-ray parameters could be confirmed and improved. Furthermore, we found indications that the multi-dimensional parameter space of nova properties might be dominated by a single physical parameter, and we provide interpretations and suggest implications. We studied various outliers from the established correlations and discuss evidence of a different X-ray behaviour of novae in the M 31 bulge and disk.
Conclusions. Exploration of the multi-wavelength parameter space of optical and X-ray measurements is shown to be a powerful tool for examining properties of extragalactic nova populations. While there are hints that the different stellar populations of M 31 (bulge vs disk) produce dissimilar nova outbursts, there is also growing evidence that the overall behaviour of an average nova might be understood in surprisingly simple terms.
Key Words.:
Galaxies: individual: M 31 – novae, cataclysmic variables – X-rays: binaries1 Introduction
This is the third in a series of papers analysing data from X-ray monitoring campaigns for classical novae (CNe) in the central region of our neighbour galaxy M 31. In the first two papers, we presented the results of earlier campaigns from Jun 2006 to Mar 2007 (Henze et al. 2010b, hereafter Paper I), Nov 2007 until Feb 2008, and Nov 2008 until Feb 2009 (both in Henze et al. 2011d, hereafter Paper II). This work presents the results of another three monitoring seasons with XMM-Newton and Chandra during the autumn and winter of the years 2009/10, 2010/11 and 2011/12.
Classical nova events occur in binary systems of the cataclysmic variable (CV) type, which are those experiencing mass transfer from the main sequence or red giant secondary star onto the primary white dwarf (WD) component of the system (for recent reviews see Bode & Evans 2008). The nova outburst is triggered by a thermonuclear runaway in the accreted (hydrogen) matter. The optical nova, the phenomenological discovery of a “new star” where none was known before, is the product of the rapidly expanding hot envelope creating a massively enlarged pseudo-photosphere within hours to a few days. At its optical maximum, a nova can be from seven to 16 magnitudes brighter than in quiescence (see Strope et al. 2010, and references therein).
After the optical maximum, the CNs photosphere recedes towards inner, hotter layers and the peak of emission shifts to shorter wavelengths. The speed of decline of the optical magnitude is one of the main observable parameters of the CN outburst. Payne-Gaposchkin (1964) first established (but see also Gerasimovic 1936; McLaughlin 1939) a detailed system of nova speed classes based on the time (in days) needed for the CN light curve to decay by two or three magnitudes below maximum magnitude ( or ). The decline times have been found to be connected to the CNs peak magnitude (the maximum magnitude to rate of decline, or MMRD, relationship; see Della Valle & Livio 1995) and to the expansion velocity () of the ejected envelope (Della Valle et al. 2002). These results showed that brighter novae tend to evolve faster in the optical and exhibit larger ejection velocities. The main driver behind these relationships was believed to be the WD mass (Livio 1992).
The receding of the nova photosphere and the accompanying hardening of its emission peak ultimately give rise to a supersoft X-ray source (SSS) with an effective temperature of less than 100 eV and no emission above 1 keV (Parmar et al. 1998). The SSS is powered by stable hydrogen burning within the part of the accreted envelope that was not ejected during the outburst. This phase of the nova outburst is believed to occur generally (e.g. Hachisu & Kato 2006); however, it can only be observed when the ejected matter becomes optically thin to supersoft X-rays (Starrfield 1989; Krautter 2002).
In this paper (as in Paper II), we define the turn-on time of the SSS () as the time in days after the optical outburst at which the CN became visible in (soft) X-rays. Therefore, is an observational parameter that depends on the detection limit of the specific X-ray observation. However, our homogeneous monitoring strategy (see Sect. 2) provided detection limits that were consistently sufficiently low to detect practically all realistic post-nova SSS phases, given that no strong additional absorption was present. This justifies using in the statistical comparisons described in Sect. 5.
The SSS phase is fuelled by the remaining hydrogen and its end indicates the cessation of the (stable) residual burning and the disappearance of the nova towards quiescence. The SSS turn-off time () is defined in some (theoretical) studies as the time the hydrogen burning switches off (e.g. Hachisu & Kato 2006, 2010). Here, as in Papers I & II, we define observationally as a drop in the SSS luminosity below the X-ray detection limit. This limit only allows us to follow the decreasing X-ray emission of a nova in M 31 until it declines to a certain luminosity, usually 1–2 orders of magnitude below the peak. The SSS light curves of Galactic novae typically decline by several orders of magnitude and can be followed for longer (e.g. Osborne et al. 2011). Nevertheless, our is expected to extend beyond the actual hydrogen burning switch-off by a certain amount of time. This time span is relatively short, because the luminosity decline happens quickly compared to the SSS phase duration (e.g. Wolf et al. 2013), but it will be non-negligible in some cases. This should be kept in mind when comparing our data to other (theoretical) studies.
Both time scales, and , are measured in days after the optical outburst. Hachisu & Kato (2006) found a “universal decline law”, based on models describing free-free emission and an optically thick wind, and used it to study the multi-wavelength evolution of Galactic nova outbursts.
A nova outburst constitutes a surface eruption and ejection of a part of the accreted material. The WD itself is largely unaffected by this event (it is believed that a certain extent of mixing between core and envelope is necessary; see e.g. Casanova et al. 2010), and after a while, the resumed accretion can lead to another nova outburst. If two or more eruptions of the same nova have been observed within about a hundred years time, the object is called a recurrent nova (RN). This arbitrary, phenomenological definition arises from the current look-back time of modern professional astronomy. It is in debate if the WD grows in mass with every nova outburst and thus will ultimately exceed the Chandrasekhar mass, exploding as a type Ia supernova (SN Ia) (see e.g. Della Valle & Livio 1996; Yaron et al. 2005; Gilfanov & Bogdán 2010; Hachisu et al. 2012; Kato & Hachisu 2012; Shafter 2013)
If CNe were found to contribute significantly to the yet elusive group of SN Ia progenitors, then another open question would gain additional importance: whether the CNe properties vary depending on the underlying stellar population. Motivated by early attempts to employ the light curves of CNe for extragalactic distance measurements (see e.g. Livio 1992), it became important to study any potential impact the characteristics of the host galaxy could have on these light curves and other observable parameters. The subject remains controversial. Some studies have suggested that the Hubble type of a galaxy has no significant influence on its luminosity-specific nova rate (e.g. Hatano et al. 1997; Shafter et al. 2000), while other studies argued in favour of nova rates dominated by old (e.g. Ciardullo et al. 1987; Capaccioli et al. 1989) or young (e.g. Della Valle & Livio 1994; Yungelson et al. 1997) stellar populations of the bulge or disk component of a galaxy, respectively.
The existence of two distinct nova populations was first suggested by Duerbeck (1990) and Della Valle et al. (1992) from observations of Galactic novae. Fast novae with d appeared to be associated mostly with the Galactic disk, while slower novae were concentrated primarily in the bulge or considerably above the Galactic plane. Later, Della Valle & Livio (1998) studied spectroscopic nova populations based on the work of Williams (1992), who had classified novae as either showing Fe II lines and low expansion velocities (“Fe II novae”) or He and N lines, often with strong Ne lines, and high expansion velocities (“He/N novae”). Della Valle & Livio (1998) reported that novae in the Galactic bulge mostly belong to the Fe II type, whereas disk novae tend to exhibit He/N type characteristics. Recent photometric and spectroscopic observations of novae in the bulge-dominated galaxy M 31 and the disk dominated galaxy M 33 are consistent with this result (Shafter et al. 2011d, 2012).
Our large neighbour galaxy, M 31 (distance 780 kpc; Holland 1998; Stanek & Garnavich 1998), with its relatively low Galactic foreground extinction ( cm, Stark et al. 1992) is an obvious and excellent target for extragalactic nova surveys. Over the last century, beginning essentially with the seminal work of Hubble (1929), more than 900 nova detections have been reported in M 31 (937 candidate outbursts as of Jun 2013; see the online catalogue111http://www.mpe.mpg.de/m31novae/opt/m31/index.php of Pietsch et al. 2007d, hereafter PHS2007). Systematic discoveries of larger sets of M 31 novae in X-ray data began with Pietsch et al. (2005a, hereafter PFF2005), who correlated X-ray catalogues from ROSAT, XMM-Newton, and Chandra with optical nova data and found that these objects constitute the major class of SSSs in M 31. Another successful archival study by PHS2007 motivated a dedicated monitoring project, where the first results were reported in Papers I & II. For this project, the results of the most recent monitoring campaigns, their implications, and interpretations, are the subject of this work.
For an analysis of individual nova discoveries (X-ray spectra, light curves), several of which showed interesting features, we refer the reader to Sect. 3. Those primarily interested in the discussion of the extended sample of M 31 novae with X-ray counterpart (parameter correlations, population studies) might find it useful to skip directly to Sect. 5.
2 Observations and data analysis
This work is based on XMM-Newton and Chandra observations of the central area of M 31 that were dedicated to the monitoring of SSS states of novae (PI: W. Pietsch). We report on the analysis of three observation campaigns carried out during Nov 2009 to Feb 2010, Nov 2010 to Mar 2011, and Nov 2011 to Mar 2012. Within these campaigns, the individual observations were separated by about ten days. The last campaign included a single Chandra observation at the beginning of Jun 2012. Additionally, we made use of two XMM-Newton target of opportunity (ToO) observations of the M 31 disk nova M31N 2008-05d (Henze et al. 2012a) to constrain the X-ray parameters of a few objects (see Sect. 3).
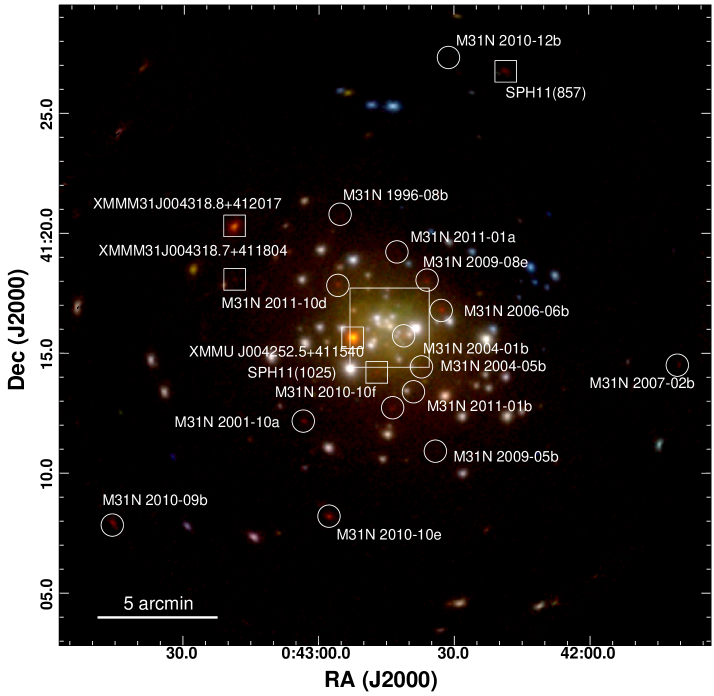
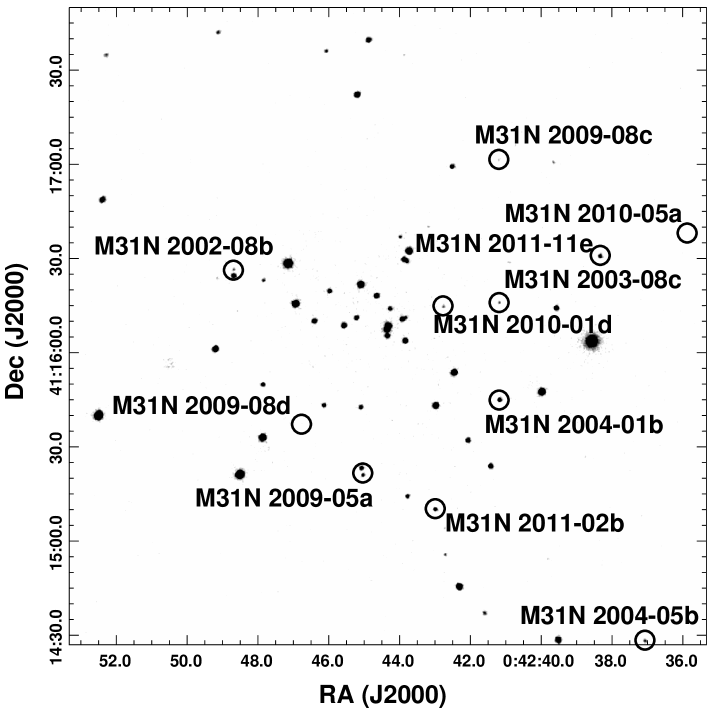
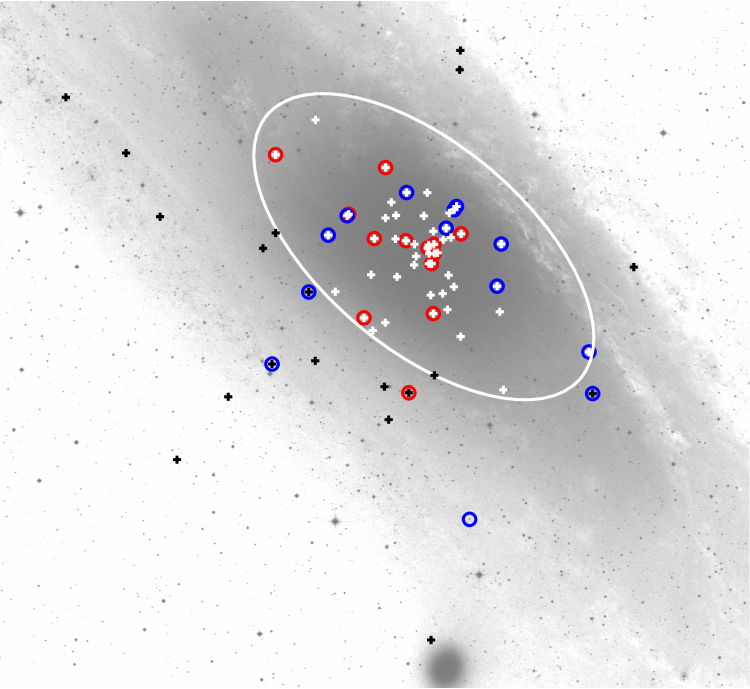
In total, 39 individual monitoring observations have been obtained with an unscreened exposure of the order of 20 ks each. Their details are listed in Table 1. Hereafter, the three campaigns are named 2009/10, 2010/11, and 2011/12, respectively. In Fig. 1, we show an XMM-Newton image which was merged from all EPIC exposures and covers most of the area ( in diameter) of the monitoring. It includes all detected objects except of those in the innermost of M 31 (shown in Fig. 2).
We used exactly the same instrumental setup as in Papers I & II: XMM-Newton EPIC with pn in full frame mode and thin filter (MOS 1 and 2 with medium filter) and Chandra in HRC-I configuration. Although the HRC-I, a micro-channel plate detector, does not allow for the spectral fitting of the detected sources, it provides the largest field of view of all Chandra detectors, which was more important for establishing a dense monitoring of a relatively large area. The HRC-I also offers a good soft energy response. While XMM-Newton provided a good spectral resolution and count rates, which allow for spectroscopic analysis (see Fig. 1), the superb spatial resolution of Chandra did let us probe the innermost region around the M 31 core (see Fig. 2) and discover many novae that fell victim to source confusion in the XMM-Newton images.
Our data analysis had as its starting point the XMM-Newton observation data files (ODF) and Chandra level 2 event files. These data were reprocessed using XMMSAS v11 (XMM-Newton Science Analysis System; Gabriel et al. 2004)222http://xmm.esac.esa.int/external/xmm_data_analysis/ and CIAO v4.4 (Chandra Interactive Analysis of Observations; Fruscione et al. 2006)333http://cxc.harvard.edu/ciao/ with the calibration database (CALDB) version 4.4.7 and the latest calibration files. The analysis differed from the standard reduction chains and was described in detail for XMM-Newton in Paper I and for Chandra in Hofmann et al. (2013). These papers also described the creation of merged images that were used for each campaign to increase detection sensitivity.
Source lists, derived from XMMSAS emldetect and CIAO wavdetect output, were correlated against the most recent version of the MPE online M 31 optical nova catalogue. The correlation took into account the positional uncertainties from optical and X-ray detections. All luminosities given in this work were derived assuming a generic SSS spectrum with a black body temperature of 50 eV and Galactic foreground absorption ( cm) and not on the basis of spectral analysis. Consequently, they are named “equivalent luminosities” (““ in source tables). We strongly advise not to quote these luminosities out of context. They should only be used to discuss relative changes of source flux within the monitoring campaigns.
Spectral analysis was performed in XSPEC v12.7 (Arnaud 1996) using the single pixel events (and FLAG = 0) from the XMM-Newton EPIC pn data because of the instrument’s superior low-energy response. For a few objects, EPIC MOS data were also used, where we selected events with FLAG = 0 and PATTERN . All spectral models use the Tübingen-Boulder ISM absorption model (TBabs in XSPEC) with the photoelectric absorption cross-sections from Balucinska-Church & McCammon (1992) and ISM abundances from Wilms et al. (2000).
X-ray light curves were analysed after transforming the photon arrival times to the bary-centre of the solar system, using the XRONOS tasks of HEASARCs software package FTOOLS (Blackburn 1995)444http://heasarc.gsfc.nasa.gov/ftools/. Additionally, we checked the Chandra light curves for indications of variability using the CIAO tool glvary, which applies the algorithm of Gregory & Loredo (1992) to classify source variability. The statistical analysis in Sect. 5 was performed within the R software environment (R Development Core Team 2011).
Independently from the correlations with the optical nova catalogue, we used a hardness ratio criterion to search for SSSs in the XMM-Newton data. The following formula, which was used in Papers I & II to define hardness ratios (HR) and their errors (EHR), was adopted from Pietsch et al. (2005b):
| (1) |
for 1,2, where and denote count rates and corresponding errors in band as derived by emldetect. In PFF2005, these hardness ratios were used to classify sources as SSSs if they fulfilled the conditions and . In this work, we used the same criteria mainly to find SSSs without a nova counterpart (see Sect. 3.4). The XMM-Newton EPIC energy bands used here were (0.2 – 0.5) keV, (0.5 – 1) keV and (1 – 2) keV ( 1 – 3).
3 Results
In total, we detected 24 X-ray counterparts of optical novae in this work. Seven of these sources were already X-ray active in the previous monitoring data presented in Paper II (see Sect. 3.1 and Table 2). Of those, all three SSS counterparts that were already active during the 2006/7 campaign (and before, see Paper I) were observed to turn-off during 2009 – 2012. We detected 17 novae in X-rays for the first time (see Sect. 3.2 and Table 3). The positions of all objects are indicated in Figs. 1 and 2.
Tables 2 and 3 contain X-ray measurements for all novae detected with a significance above (for XMM-Newton, in the (0.2–1.0) keV band, combining all EPIC instruments). Three novae. which were active SSSs at the end of the 2008/9 campaign and were described in Paper II but were no longer detected, are listed in Table 4 with their detection upper limits. In addition, we give upper limits for all novae, which had their optical outburst within a year before or during the individual campaigns in Tables LABEL:tab:novae_ulim8, LABEL:tab:novae_ulim9 and LABEL:tab:novae_ulim10, respectively. In case of XMM-Newton, whenever possible, these upper limits were derived from the EPIC pn data, because this instrument has the highest sensitivity for soft X-rays. Five SSSs without a nova counterpart, which were already discussed in Papers I & II, have also been detected in these campaigns. They are indicated in Fig. 1 and summarised briefly in Sect. 3.4 and Table 8.
Tables 2 – LABEL:tab:novae_ulim10 contain the following information: the name; coordinates; outburst date of the optical nova; the distance between optical and X-ray source (if detected); the X-ray observation and its time lag with respect to the optical outburst; the unabsorbed equivalent X-ray luminosity or its upper limit in the (0.2–1.0) keV band, which assumes a 50 eV black body spectrum with Galactic foreground absorption; and comments.
3.1 X-ray counterparts of optical novae in M 31 known previously
Seven novae from previous campaigns were detected in this monitoring (see Table 2). Among them, there were three sources that were already active prior to Paper I and have been found to experience the end of their exceptionally long SSS phases before the end of 2011/12. These sources were: M31N 1996-08b, M31N 2001-10a, and M31N 2004-05b. The SSS turn-off of another early nova, M31N 1997-11a, is discussed in Sect. 3.3.
Nova M31N 1996-08b was still active in 2009/10 but was not detected anymore in the following two campaigns. This allowed us to estimate an SSS turn-off time of about 13.8 yr ( d d) after outburst, which is the longest ever observed for any M 31 nova. In the Galaxy, the current record holder is nova V723 Cas (see Ness et al. 2008), which was still observed as a SSS for more than 14 years after outburst in 2009 (Schaefer & Collazzi 2010) and has not turned off as of May 2013 (Henze et al., in prep.). Another Galactic nova with a long SSS phase was GQ Mus (SSS turn-off after 10 years; Shanley et al. 1995; Schaefer & Collazzi 2010).
Nova M31N 2001-10a experienced its SSS turn-off between the 2010/11 and 2011/12 monitoring campaigns. By chance, the source was in the field of view of an XMM-Newton ToO observation in Aug 2011 (see Henze et al. 2012a), where it was not detected. Therefore, the end of the SSS phase could be constrained to about 9.6 yr ( d d) after its discovery in the optical. No significant differences have been found between the X-ray spectra extracted from the campaings of 2009/10, 2010/11, and those discussed in Paper II. Therefore, we use the best-fit values given in Paper II in our analysis in Sect. 5.
Nova M31N 2003-08c was still active at the end of the monitoring, albeit only in merged observations at a very low luminosity (see Table 2). Owing to its proximity to the M 31 centre, this source was only detected in the Chandra HRC-I observations.
Nova M31N 2004-01b could still be detected in the Chandra HRC-I observations of all campaigns. In Paper II, no XMM-Newton EPIC spectra had been extracted because of the position of the nova which was very close to the M 31 centre and to a bright persistent X-ray source nearby (see Figs. 1 and 2). Here, the merged XMM-Newton data from all three campaigns with the 2008/9 observations from Paper II allowed us to extract a sufficient number of counts for spectral modelling. The merged spectrum can be fitted using an absorbed black body model with best-fit parameters = cm and eV. This classifies the source as an SSS. Fits to merged spectra extracted from individual campaigns resulted in best-fit parameters that agreed within the errors, which, however, were relatively large ( values of (10 – 20) eV). We took great care in extracting the background spectra used in the analysis but cannot rule out that nearby sources and a (soft) diffuse emission component might influence the derived source spectrum. This has to be taken into account when interpreting the spectral parameters.
Nova M31N 2004-05b was detected again in the 2009/10 campaign, where it appeared to experience a significant drop in luminosity (see Table 2). Since the source was not detected anymore in 2010/11, we might have observed its gradual SSS turn-off during the 2009/10 observations. Nevertheless, we took a conservative approach and estimated that the turn-off happened between the 2009/10 and 2010/11 campaigns.
Nova M31N 2006-06b was active almost throughout the three campaigns but appeared to have turned off during the last Chandra observations in Feb till May 2012 (see Table 2). We merged these last four HRC-I observations for better statistics but could not detect the object. A reasonably low upper limit is provided by observation 13279 in Feb 2012. Therefore, we assume that the SSS turn-off occurred between the last detection in XMM-Newton observation 0674210401 and this upper limit (see Table 2). Comparing the best-fit black body temperatures for the combined X-ray spectra extracted from the 2009/10 and 2010/11 observations with those from Paper II suggests a cooling of the source, but the errors are large and the difference is not significant (kT eV eV). Therefore, we merged all existing spectra and derived best-fit values of = () cm and eV, which have errors that are a factor 2 smaller than for the previous estimate in Paper II.
Nova M31N 2007-02b was still detected during the 2009/10 campaign but had turned off by the time of the 2010/11 observations. As in Paper II, this source was located at large off-axis angles and only detected in those XMM-Newton pointings, where the roll angle allowed it to be in the EPIC field of view. We fitted the combined XMM-Newton X-ray spectrum, based on those observations where the source was detected, using an absorbed black body model. The resulting best-fit parameters were compatible within the errors with the values derived by Paper II based on two observing campaigns. Therefore, we fitted the old and new spectra simultaneously to arrive at new best-fit parameters of eV and = () cm.
3.2 X-ray counterparts of optical novae in M 31 discovered in this work
We discovered 17 new X-ray counterparts of M 31 novae, which are described below. Their (equivalent-luminosity) light curves can be found in Table 3.
3.2.1 M31N 2002-08b
The optical nova was discovered by Lee et al. (2012) on 2002-08-26.56 UT. The optical light curves shown by Lee et al. (2012) suggest a relatively slow decline.
A faint X-ray counterpart was first detected in the Chandra observations of 2009/10. This source was located within the inner 2′ of M 31, which is close to a known persistent source (see Fig. 2). Therefore, XMM-Newton was not able to resolve it and only Chandra data were available to study its evolution. Although the object was detected in several individual Chandra observations, we only quote the more reliable detections based on merged data in Table 3.
We revisited the earlier observational data from Paper II and confirmed that the X-ray source was not significantly detected in the 2008/9 campaign. There was, however, a possible source visible to the eye in the merged data of that campaign. This candidate object was below the detection threshold. Its position was close to the detections of the nova in the later data. By carefully comparing the suspected source with the actual detections of the current campaign, we found a positional offset, which caused us to conclude that this dubious source, whether real or merely a result of background fluctuations, was not identical with the nova. Its presence probably influenced the upper limit given in Table 3 for the 2008/9 campaign (”mrg2“), which has a larger value than the value for the merged data from the 2007/8 campaign (included as ”mrg1“ in Table 3) where there were no suspicious sources visible.
As a result of this investigation, we estimated that the nova experienced the beginning of its SSS phase between the 2008/9 and 2009/10 monitoring campaigns. The source appeared to be still active at the end of the 2011/12 monitoring.
3.2.2 M31N 2009-05a
The optical nova was discovered by K. Hornoch555http://www.cbat.eps.harvard.edu/CBAT_M31.html#2009-05a on 2009-05-17.043 UT and confirmed in H data by Pietsch et al. (2009). A relatively faint X-ray counterpart was first discovered in the 2010/11 campaign and remained active until the end of the monitoring (see Table 3). Owing to its position near a persistent X-ray source, this object was only detected in the Chandra observations.
The source was not detected in X-rays until the second observation of the 2010/11 campaign. It always remained close to the detection threshold (see Table 3). We assume that its SSS phase began between the 2009/10 and 2010/11 campaigns (see Table 3). The source was still detected at the end of the 2011/12 monitoring.
3.2.3 M31N 2009-05b
The optical nova was discovered by K. Hornoch666http://www.cbat.eps.harvard.edu/CBAT_M31.html#2009-05b on 2009-05-17.043 UT and confirmed by Pietsch et al. (2009) in H observations. A faint X-ray counterpart was detected in the first Chandra observation of 2009/10 174 d after discovery. No previous X-ray observations of sufficient depth were available to constrain the SSS turn-on time further. We estimated that the SSS phase ended between the first and second campaign.
Based on the merged XMM-Newton data of 2009/10, we fitted the XMM-Newton EPIC pn spectrum of the source with an absorbed black body model, resulting in best-fit parameters eV and = () cm. Despite the relatively large errors, owing to a low-count spectrum, this source can be clearly classified as an SSS.
3.2.4 M31N 2009-08c
The optical nova candidate was discovered by K. Hornoch777http://www.cbat.eps.harvard.edu/CBAT_M31.html#2009-08c on 2009-08-12.423 UT (see also Henze et al. 2009a). The optical light curve appeared to evolve relatively slowly with a decline of only mag by Sep 9 2009 28 d after discovery (see Medvedev et al. 2009). An X-ray counterpart was clearly detected in the last observation of the 2009/10 campaign. No source was visible in the previous Chandra observation, leading to a well constrained SSS turn-on time. The source was still faintly detected in the first two pointings of the 2010/11 monitoring but its luminosity declined steadily. We estimated that the SSS turn-off happened between the last Chandra detection in observation 12111 and observation 12114, which provided a sufficiently low upper limit for us to reason that the source had turned off (see Table 3).
3.2.5 M31N 2009-08d
The optical nova was discovered by K. Hornoch888http://www.cbat.eps.harvard.edu/CBAT_M31.html#2009-08d on 2009-08-12.423 UT (see also Henze et al. 2009a). Shafter et al. (2011d) found a moderately fast decline (in the system of Payne-Gaposchkin 1964) for the optical light curve of d in the band. The object was classified as an Fe II nova in the system of Williams (1992) by Di Mille et al. (2009), who gave an H FWHM of 1300 km s. A faint X-ray counterpart was found in the merged Chandra HRC-I data of the 2009/10 monitoring at the detection limit. Nothing was found at this position in the merged observations of 2010/11.
3.2.6 M31N 2009-08e
The optical nova was discovered independently by K. Nishiyama & F. Kabashima999http://www.cbat.eps.harvard.edu/CBAT_M31.html#2009-08e and Ovcharov et al. (2009) on 2009-08-25.6293 UT. A very slowly declining light curve ( d d) was reported by Shafter et al. (2011d) based on band data. Observations by the Palomar Transient Factory (PTF; Law et al. 2009) confirmed the slow decline in the optical (Cao et al. 2012). The nova was confirmed spectroscopically by Medvedev et al. (2009) as an Fe II nova with an H FWHM of 1230 km s. It was detected as an ultraviolet (UV) source in Swift observations at about 58 d after discovery (Henze et al. 2009b).
An X-ray counterpart was found as a faint source in the last Chandra observation of 2009/10. After being detected throughout the 2010/11 campaign, the object had disappeared in 2011/12. We estimated that the SSS turn-on happened between the last XMM-Newton observation of 2009/10 and the first Chandra detection. The combined X-ray spectrum extracted from the XMM-Newton data of 2010/11 (about 150 counts) could be fitted by a black body with best-fit eV and = () cm. This classifies the source as a SSS.
3.2.7 M31N 2010-01d
The nova candidate was discovered close to the M 31 centre by Pietsch & Henze (2010) in the XMM-Newton optical monitor (OM) UV data taken on 2010-01-15.52 UT. Optical band detections of the object were reported by Hornoch et al. (2010c) and showed that its light curve had declined relatively fast by about two magnitudes within 15 days after the first detection on 2010-01-16.795 UT. However, the optical peak was not well constrained with the closest non-detection on 2010-01-02.799 UT, so that the decay from maximum might have been faster.
Owing to its position near the M 31 centre, an X-ray counterpart was only detected in Chandra data. The source was visible from the first observation of the 2011/12 monitoring to the last Chandra observation in May 2012. Therefore, we can only give a lower limit for its SSS turn-off time.
3.2.8 M31N 2010-05a
The optical nova was discovered by Hornoch et al. (2010d) on 2010-05-28.062 UT and spectroscopically confirmed as an Fe II nova (Hornoch et al. 2010b). It was independently discovered by Nishiyama & Kabashima (2010a). The object evolved slowly with a time of about 53 d (see measurements given in Hornoch et al. 2010a). Pietsch et al. (2010g) reported H detections of the nova in Oct 2010. The nova was also found in Swift UV observations during Jul and Aug 2010, displaying a slowly declining light curve (Henze et al. 2010a). A very faint X-ray counterpart was only detected in the merged Chandra data of 2010/11. Nothing was found in the 2011/12 campaign (see Table 3).
3.2.9 M31N 2010-09b
The optical nova was discovered by Nishiyama et al. (2010). Pietsch et al. (2010f) confirmed the discovery and tightly constrained the time of outburst using a pre-discovery detection on 2010-09-30.412 UT and an upper limit on 2010-09-29.958 UT. Cao et al. (2012) published a well sampled PTF band light curve and reported a fast rise (within two days) and decay ( d). Two optical spectra have been obtained for this nova. The first was taken within a day of discovery, on 2010-10-01.39 UT, showing features of an Fe II nova with an H FWHM of 1300 km s (Shafter et al. 2010b). The second spectroscopic observation by Shafter et al. (2010c), which was five days later on 2010-10-06.40 UT, revealed a significantly evolved spectrum with broader Balmer lines (H FWHM of 3600 km s). Although the latter spectrum showed some resemblance to those of hybrid novae Shafter et al. (2010c) reported that the initial classification as an Fe II nova was confirmed.
An X-ray counterpart was detected in XMM-Newton observations of 2010/11 near the edge of the field of view. Due to its large off-axis angles in the Chandra observations, the source was only detected in the merged data of this campaign, thereby not allowing us to put additional constraints on the SSS turn-on or turn-off time scales. M31N 2010-09b is likely to belong to the disk nova population of M 31; members of which were severely under-represented in the catalogue of Paper II. Therefore, we triggered an XMM-Newton ToO observation in Aug 2011 to constrain the SSS turn-off time and/or X-ray spectrum of the source. In Table 3, we show that the SSS phase of the nova had already ended by the time of the ToO (which, however, detected another interesting disk nova: M31N 2008-05d, see Henze et al. 2012a).
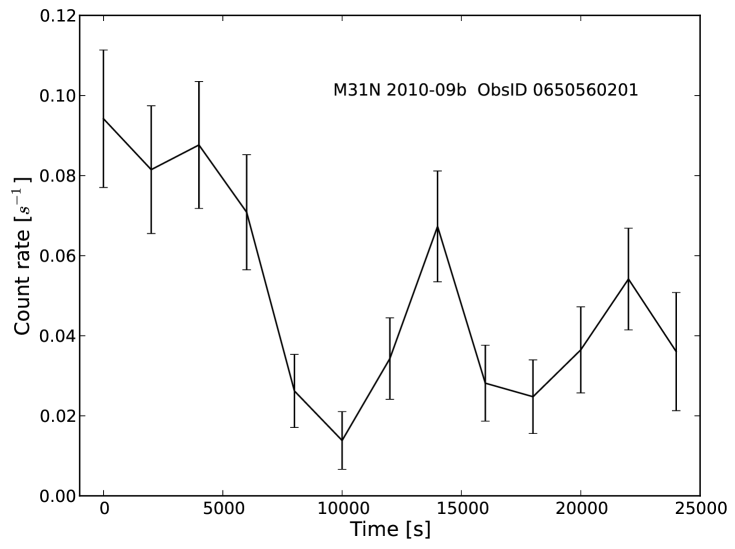
We fitted the XMM-Newton EPIC pn and MOS spectra of the source simultaneously and derived best-fit black body parameters of eV and = () cm. This classifies the source as an SSS. The resulting black body is large and might lead to an underestimation of the source temperature, which therefore should be interpreted with care. Because of the location of the source at the edge of the EPIC field of view (see Fig. 1) it was not always detected by all detectors in all observations, thereby limiting the number of source counts for spectroscopy.
The EPIC pn keV light curve during XMM-Newton observation 0650560201 (87 d after outburst) showed strong variability, which is plotted in Fig. 3. On top of a declining trend, two broad dips can be identified with durations of about 6 ks each. There is no strong evidence of periodic behaviour. We did not find an energy dependence for the light curve nor a significant difference between the SSS spectra during and out of the dips. Nevertheless, these dips might indicate absorption effects as suspected for M31N 2008-05d (Henze et al. 2012a), which arise possibly even from a re-establishing accretion disk (see also Ness et al. 2012). In this case, M31N 2010-09b might be seen at high inclination. Of the other detections, only the MOS 2 data of ObsID 0650560401 suggested some (non significant) variability.
3.2.10 M31N 2010-10e
The optical nova was discovered by Hornochova et al. (2010) on 2010-10-30.703 UT. Its light curve declined fast. Comparing the measurements by Hornochova et al. (2010) to the PTF data reported in Cao et al. (2012) suggests that the first PTF detection (on 2010-11-01.158) took place close to maximum light and that d, which is the value that we adopted for our catalogue.
Pietsch et al. (2010b) pointed out that the position of the object coincides (sub-arcsecond agreement) with three historical nova outbursts (see Rosino 1973; Lee et al. 2012), which had already been discussed as multiple outbursts of a RN. However, due to the short gap of only five years between the first two outbursts, Sharov & Alksnis (1989) had suggested that the object might instead be a U Geminorum dwarf nova system in the Galactic foreground. The question was solved when Shafter et al. (2010a) obtained an optical spectrum of the outburst, which clearly showed the object to be a He/N nova in M 31 with extremely broad Balmer emission lines (H FWHM of 8100 km s). Therefore, M31N 2010-10e was identified as the fourth recorded outburst of the RN M31N 1963-09c (discovered by Rosino (1973); the other two outbursts were M31N 1968-09a and M31N 2001-07b). Between its first two detected outbursts, this nova showed the shortest recurrence time ever observed (about five years) with the Galactic RN U Sco in second place with about 10 yr (see Schaefer et al. 2010).
An X-ray counterpart was first discovered by Pietsch et al. (2010d) in dedicated, high-cadence ToO monitoring observations with the Swift satellite only 15 d after outburst (with a non-detection two days earlier). Pietsch et al. (2010d) also described a declining UV light curve. They classified the X-ray source as an SSS and reported indications for flux variability on time scales of hours. Due to the relatively large off-axis angle and the initial faintness of the source, our Chandra observations only detected the SSS on day 34 (see Table 3). Fading rapidly, the source had disappeared during the XMM-Newton monitoring. With the Swift observations, our monitoring provides accurate constraints on the duration of the SSS phase of this exceptional nova.
A simultaneous fit of the XMM-Newton EPIC pn spectra extracted from the three observations, where the source was detected (see Table 3) gave the following best-fit black body parameters: eV and = () cm. The relatively high SSS temperature supports the interpretation of a high-mass WD in the RN system.
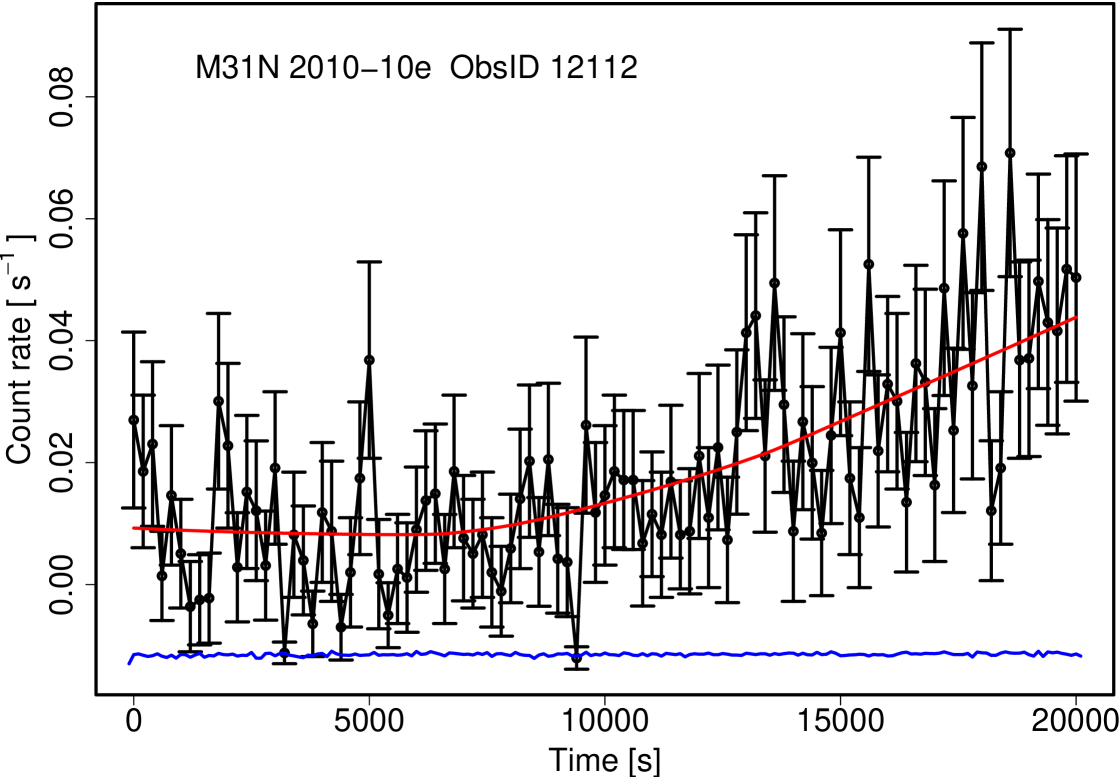
The light curve of M31N 2010-10e during the Chandra observation 12112 showed strong variability (glvary index of 9). The plot in Fig. 4 reveals that the count rate of the source gradually increased by a factor of about four (see smoothed red curve) after the first ks. This brightening can be attributed to the nova since the background light curve of the entire observation was very stable (blue curve). No variability was found in the short-term light curves of other observations of the source.
3.2.11 M31N 2010-10f
3.2.12 M31N 2010-12b
The optical nova candidate was discovered by Pietsch et al. (2010c) and several other observers independently (Koishikawa 2010; Pietsch et al. 2010a; Nishiyama & Kabashima 2010b; Sun & Gao 2010, all in CBET #2582). The first detection was on 2010-12-10.359. Cao et al. (2012) reported a very fast d based on a PTF monitoring light curve.
A faint X-ray counterpart with a very short turn-on time was found in XMM-Newton observations of 2010/11. After being at the detection limit for the remaining XMM-Newton observations of this campaign, the source was no longer detected in the last observations of 2010/11 (see Table 3). However, owing to the large off-axis angles the source had in the Chandra observations of 2010/11, those measurements did not provide sufficient sensitivity to claim that the source had disappeared. Although the faintness of the source in the last XMM-Newton () detection (day 56, see Table 3) indicates that it might have faded below the on-axis detection limit not long thereafter, we take the more conservative approach and assume that the turn-off took place between 2010/11 and 2011/12.
We attempted modelling the X-ray spectrum extracted from XMM-Newton observation 0650560301 (see Table 3), which only had about 60 source counts (but considerably more than for the other observations). The best-fit parameters of a black body model show large errors, eV and = () cm, but nevertheless allow us to classify the source as SSS.
3.2.13 M31N 2011-01a
The optical nova was discovered independently by Nishiyama & Kabashima (2011); Yusa (2011); Hornoch et al. (2011); and Sun & Gao (2011) with the first detection on 2011-01-07.39 UT. Henze et al. (2011b) reported a noteworthy brightening to mag on 2011-01-11.20 UT. The nova was detected in H by Henze et al. (2011a). Arai (2011) obtained an optical spectrum, showing the object to be an Fe II nova with an H FWHM of about 1300 km s. After not being detected in 2010/11, a faint X-ray counterpart was found in the merged XMM-Newton and Chandra data of the 2011/12 campaign (see Table 3).
3.2.14 M31N 2011-01b
The optical nova candidate was discovered by K. Hornoch on 2011-01-16.725 UT. The object was announced on the CBAT transient objects confirmation page (TOCP)101010http://www.cbat.eps.harvard.edu/unconf/tocp.html under the designation PNV J00423907+4113258. On this web site, also a confirming detection was posted by X. Gao.
The discovery of an X-ray counterpart was first announced by Henze et al. (2011c) based on the Chandra data of 2010/11 with additional Swift observations in Jun 2011. Henze et al. (2011c) classified the source as SSS, based on Swift XRT spectra, and gave a preliminary light curve, which showed the fast SSS turn-on (within a month after discovery) and covered the evolution until day 150 after outburst. Here, we extend the light curve until the end of the SSS phase.
Nothing was found at the position of the nova in the 2011/12 campaign. With a serendipitous detection in an XMM-Newton ToO observation in Aug 2011 (Henze et al. 2012a), we were able to constrain the turn-off (see Table 3). The ToO observation also provided an X-ray spectrum that could be fitted using a black body model with best-fit parameters eV and = () cm. We confirm the classification of the object as SSS by Henze et al. (2011c) and the relatively high source temperature that was estimated based on Swift data.
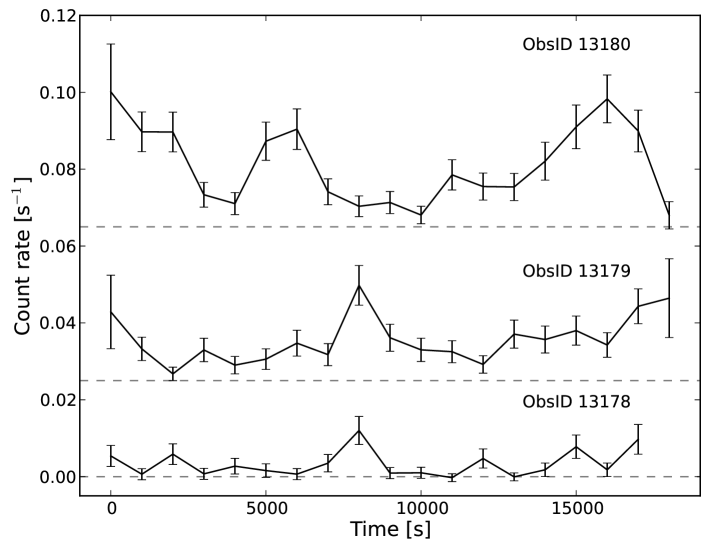
The short-term light curves of the nova during the three Chandra observations indicated variability (see Fig. 5). The plots show that the variability and the average luminosity of the object increased with each observation (see also Table 3). While the first two light curves had an glvary variability index of six (already to be interpreted as definitely variable) for the 13180 observation, this index increased to eight.
3.2.15 M31N 2011-02b
The optical nova candidate was discovered by K. Hornoch on 2011-02-23.784 UT with an band magnitude of mag and announced on the CBAT TOCP (see above) as PNV J00424296+4115104. Unfortunately, the optical outburst is not well confined because there only exists a non-detection upper limit on 2011-02-09.735 UT, which is 14 d before the first detection (K. Hornoch, priv. comm.).
Constraining the outburst date would be of particular importance as a relatively bright X-ray counterpart was detected only 4 d after discovery in a Chandra observation of 2010/11 (see Table 3). Such an extremely fast SSS turn-on would be unprecedented. Even when assuming that the outburst occurred immediately after the last non-detection, this would result in a turn-on time of d (since the source could have been X-ray active even earlier), which places M31N 2011-02b among the SSSs with the fastest turn-on ever observed in M 31. However, novae that are fast SSSs usually also show a rapid decline of the optical light curve (see Sect. 5.2). Therefore, it is unlikely that its optical brightness would have taken 14 d to decay by only two or three magnitudes to mag unless M31N 2011-02b had been exceptionally bright in outburst ( mag). This suggests a significantly shorter SSS turn-on time than 18 d.
In the last Chandra observation of 2010/11, which occured ten days after the first detection, the luminosity of the X-ray counterpart had declined significantly (see Table. 3). No X-ray source was detected at the position of the nova in the 2011/12 campaign.
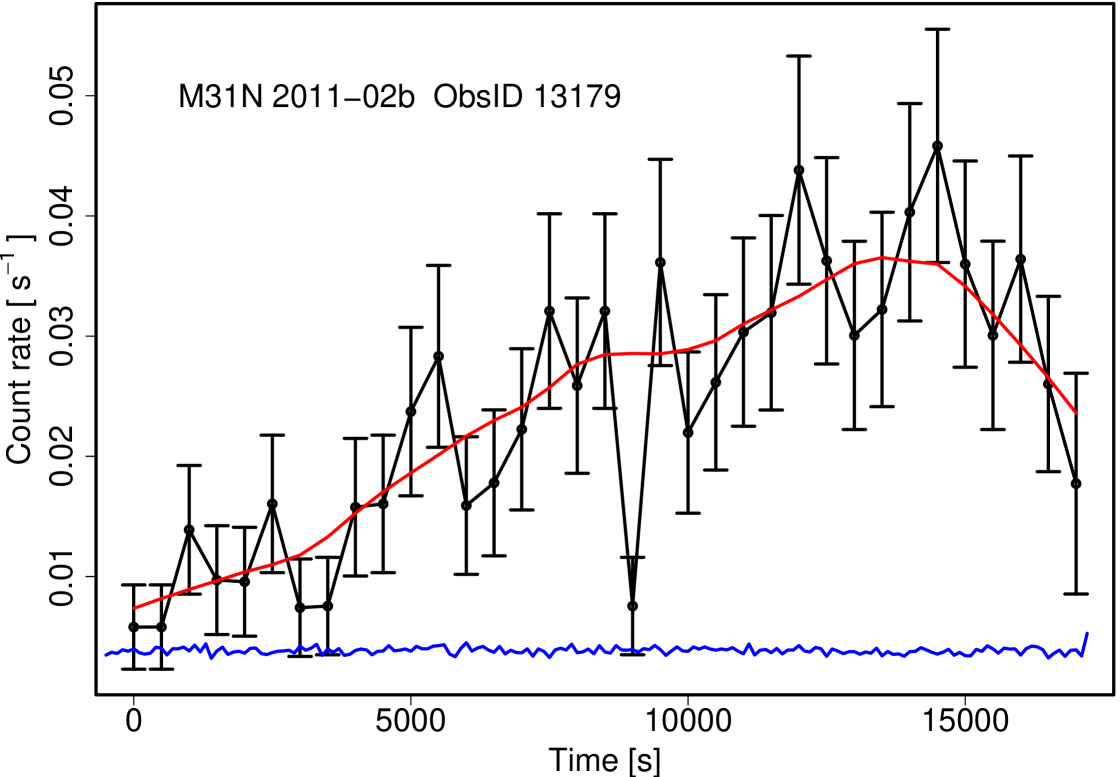
During the Chandra observation 13179, we observed strong short-term variability (glvary index of 9) while the source was brightest in X-rays (see Table 3). As shown in Fig. 6, the X-ray count rate increased by a factor of about five gradually during the observation. Towards the end of the exposure, a drop in luminosity is suggested in the last 2-3 ks. The X-ray background was quiet during the entire observation.
Unpublished optical photometry, which was made available to us by K. Hornoch, showed that the magnitude of the object had declined by mag within nine days after discovery. Assuming a steady decline rate from maximum, this suggests a of d. However, the sparse optical data available did not agree with a smooth decline but indicated a brief re-brightening after an initial fall of mag in three days. This latter scenario therefore suggests a d, which nevertheless is still too slow to explain the X-ray observations in the context of the population statistics presented in Table 9 and discussed in Sect. 5.2.
To agree with the average behaviour displayed by most novae in the current catalogue, M31N 2011-02b would need to have had a d, which would result in a very fast d and d (see Eqns. 4 and 6). However, such short time scales have not been observed before and consequently, any prediction would require an extension of the estimated parameter correlations beyond the ranges for which they were established (see Fig. 8). The analysis is further complicated by the fact that the SSS turn-off is not well constrained (see Table 3) but might very well have happened only a few days after the last detection (extrapolating from the observed speed of the decline in luminosity).
It appears that M31N 2011-02b truly has been an exceptional nova, and its behaviour does not fit the correlations displayed by the parameters of the general sample (see e.g. Fig. 8). However, due to the uncertain outburst date, we deliberately refrain from estimating SSS turn-on and turn-off time scales and using them in the statistical analysis in Sect. 5.
3.2.16 M31N 2011-10d
The optical nova was discovered by Ovcharov et al. (2011) on 2011-10-19.715 UT. Follow-up detections were reported on the CBAT TOCP (see above). Initial optical spectroscopy was carried out at about 1.5 d after discovery by Shafter et al. (2011a) who confirmed the object as a nova in M 31. They classified it as an Fe IIb (hybrid) nova and reported moderately broad Balmer lines with an H FWHM of about 3300 km s. A second optical spectrum was obtained by Barsukova et al. (2011) at about 7 d after discovery. They classified the nova as an Fe II type and described strong emission lines with P Cygni profiles and two distinct absorption components. Shafter et al. (2011b) obtained a third optical spectrum at about 10 d after discovery, which featured narrow emission lines (H FWHM of 900 km s) and emerging He I emission. These properties led Shafter et al. (2011b) to revise their initial classification and conclude that the object might be an (unusual) Fe II type nova.
A faint X-ray counterpart was detected in Chandra observation 13230 in Dec 2011 (see Table 3). The source might have been visible (with less than significance) in the previous observation 12329 . After being active during all XMM-Newton pointings of the 2011/12 campaign and appearing as a faint detection in Feb 2011 Chandra data, the source seems to have turned off by Mar 2012.
We fitted the spectrum extracted from the combined 2011/12 XMM-Newton observations and derived best-fit black body parameters of eV and = () cm. Therefore, this source can be classified as an SSS.
3.2.17 M31N 2011-11e
The optical nova was discovered by K. Hornoch and J. Vrastil on 2011-11-19.704 UT and announced on the CBAT TOCP as PNV J00423831+4116313 (see there for confirmation detections). An optical spectrum was obtained by Shafter et al. (2011c), who classified the object as a slowly-evolving Fe II type nova with narrow, unresolved Balmer features (H FWHM km s).
An X-ray counterpart was first detected in a Chandra observation in Feb 2012. Owing to the position of the nova close to the M 31 centre, there was possible source confusion in some of the preceding XMM-Newton observations, which resulted in not very reliable upper limits (see Table 3). We took a conservative approach and assumed the XMM-Newton observation 0674210501 as the last upper limit. The source was not detected anymore in the last Chandra pointing of the 2011/12 campaign.
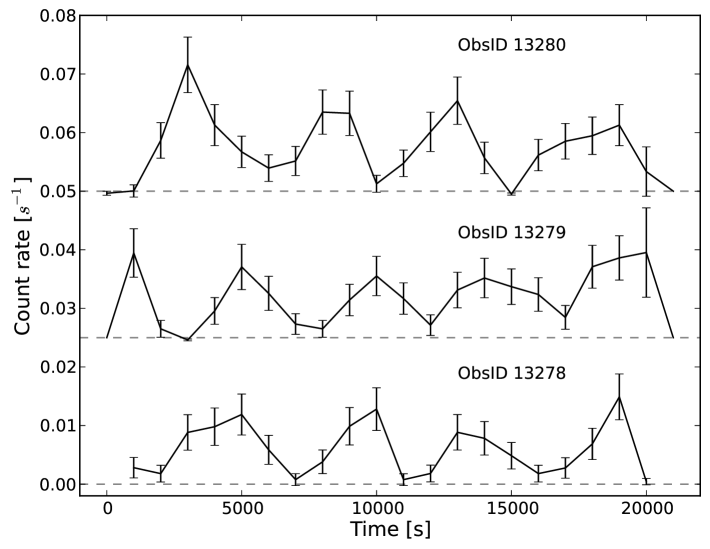
During all three Chandra observations where it was detected (see Table 3), the glvary output for the source light curve strongly indicated variability. In Fig. 7, we show the respective light curves. Fourier analysis suggested a periodic signal, and we used the XRONOS tool efsearch to determine the following best fit periods: 13278: h; 13279: h; and 13280: h. These results indicate that there were no significant changes in periodicity during the 20 d between the first and last detection. Assuming that the suspected frequency was stable, we estimated an average period of h.
Only one previous M 31 nova did show a similar suspected periodicity in its X-ray light curve: M31N 2006-04a with h (in Paper I). Note that the period found in the SSS flux of nova M31N 2007-12b, as discussed by Pietsch et al. (2011), was considerably shorter ( s). While the result in Paper I was based on three possible cycles in a single XMM-Newton observation, the observation of a consistent behaviour during three consecutive observations strongly increases the likelihood for an actual period for M31N 2011-11e.
3.3 Upper limits for non-detected X-ray emission of optical novae
Of the 10 novae that were still active at the end of Paper II, three were not detected in the present campaigns, namely M31N 1997-11a, M31N 2008-05a, and M31N 2008-06a. The two latter objects did turn-on during the 2008/9 campaign of Paper II; therefore, their relatively fast turn-off (about 400 d, see Table 9) is not surprising. Nova M31N 1997-11a displayed a remarkably long SSS phase. It showed a slow, gradual decline in X-ray luminosity during the three campaigns as discussed in Papers I & IIand finally, twelve years after the optical outburst, it was not detected anymore in the 2009/10 observations. We estimate an SSS turn-off time of yr ( d d), which makes M31N 1997-11a one of very few novae visible for more than a decade in X-rays. Upper limits for the three CNe are given in Table 4.
Additionally, we estimated upper limits for all novae not detected in X-rays and with optical outbursts between Oct 2008 and Feb 2010, between Oct 2009 and Mar 2011, and from Oct 2010 to May 2012 for the 2009/10, 2010/11, and 20011/12 campaigns, respectively. These values assume a confidence level of and are listed in Tables LABEL:tab:novae_ulim8, LABEL:tab:novae_ulim9, and LABEL:tab:novae_ulim10. We did not consider objects from the PHS2007 MPE online catalogue, which were found not to be novae, but variable sources of other kinds.
3.4 Non-nova supersoft sources
We conducted a search for SSSs without a nova counterpart in the XMM-Newton data based on the hardness ratio criterion described in Sect. 2. Five sources were found, which were all known before as SSSs or candidate SSSs in the M 31 catalogues of Pietsch et al. (2005b) and Stiele et al. (2008, 2011). Table 8 lists these objects and gives the corresponding source identifiers in the catalogue of Stiele et al. (2011). The five sources are identified in Fig. 1.
4 Novae with X-ray counterpart in M 31 - the updated catalogue
In Table 9, we present the updated catalogue of all M 31 novae with a detected X-ray counterpart. This catalogue contains 79 objects; 38 of which were discovered in the dedicated monitoring project described here and in Papers I & II. It supersedes the catalogue published in Paper II. In addition to presenting the new novae described in Sect. 3.2, the current version of the catalogue includes the improvements listed in the following paragraph.
For 32 novae detected by XMM-Newton, we carried out new, systematic fitting of their SSS spectra resulting in updated black body temperatures. We also included new optical spectroscopic and photometric information for many novae from the systematic study of Shafter et al. (2011d). The catalogue contains two more new novae, which were not found in our monitoring: (i) the disk nova M31N 2008-05d, which was discovered by Henze et al. (2012a) in XMM-Newton ToO observations, and (ii) M31N 2012-05c, the SSS counterpart of which was found by Henze et al. (2012b) in XMM-Newton observations tracking the evolution of an ultraluminous X-ray transient in M 31 (see Middleton et al. 2013).
As in Paper II, the catalogue in Table 9 contains the following information: (a) For the optical nova, we include the name, date of outburst detection, maximum observed magnitude in a certain filter (not necessarily the peak magnitude of the nova), decay time in the R band, classification as belonging to the old/young stellar population (see Sect. 5.3), spectroscopic nova type in the classification scheme of Williams (1992), and the maximum measured expansion velocity of the ejected envelope (half of the FWHM of the H line). (b) For the X-ray counterpart, we include the turn-on and turn-off times, a flag for SSS classification, and the effective black body temperatures as inferred from the X-ray spectra. (c) It also includes derived parameters: the ejected and burned masses as computed according to Sect. 5.1; and (d) references. Note that not all parameters are known for all objects.
5 Discussion
Throughout this section, the results reported in Paper II constitute the starting points of our discussion. We expand them using new methods and approaches for the enlarged M 31 nova sample presented in Table 9.
5.1 Derived nova parameters
We estimated the amount of hydrogen mass ejected () and burned () in each nova outburst based on the X-ray time scales. Using the same assumptions as in Paper II, we can describe the absorption generated by the expanding nova shell using the following formula:
| (2) |
Here, is the ejected hydrogen mass, g the mass of the hydrogen atom and a geometric correction factor (defined in Paper I assuming a spherically symmetric shell based on Della Valle et al. (2002)). We assumed that the SSS turn-on at happens when decreases to cm. Following Paper II, we used the (updated) correlation between the expansion velocity of the shell () and , as modelled in Eqn. 7, to eliminate from the model in favour of the much more frequently measured .
The ejected hydrogen masses, as given in Table 9, were computed using Eqn. 2. They assume an inverse prediction of expansion velocities and their uncertainties based on Eqn. 7 with the respective turn-on times. The inverse prediction was performed using the R package chemCal, which implements the calculation of confidence intervals presented in Slutsky (1998). A note of caution: this prediction extends the relation between turn-on time and expansion velocity beyond the parameter ranges for which it was established in Eqn. 7. This applies mainly to objects with very long SSS turn-on times ( d), where the uncertainties in their ejected masses might be underestimated. Measured expansion velocities were used in the case of novae for which they were known.
We estimated the mass of hydrogen burned in the WD atmosphere after the nova outbursts () as in Papers I & II. This formula contains the bolometric luminosity , SSS turn-off time , the hydrogen fraction of the burned material , and the energy released by processing hydrogen erg g (Sala & Hernanz 2005).
Contrary to Papers I & II, here we included an estimate for the bolometric luminosity of an individual nova derived from its turn-off time. This was based on an approximation of the plateau luminosity during the constant bolometric luminosity phase by Sala & Hernanz (2005). We used their equation 2, which describes CO WDs, because these objects are expected to be intrinsically more frequent in our sample. There is, however, little difference between the CO model of Sala & Hernanz (2005) and an ONe model with comparable metallicity (see their figure 6).
This luminosity approximation uses the WD mass, which we estimated following the models of Hachisu & Kato (2006). We took the model data given for WD mass and turn-off time in their Table 3 ( is called there ), because the chemical composition of this model (”CO nova 2“) is similar to the CO WD scenario of Sala & Hernanz (2005). In particular, both models assume a hydrogen fraction of , which we consequently also used for our estimate. In Sect. 5.2.2 below, we discuss a discrepancy between our data and a vs model by Hachisu & Kato (2006). However, this difference does not necessarily affect the vs WD mass model, which only serves as a first order approximation at this stage. We parametrised the model data of Hachisu & Kato (2006) using a broken power law in the plane. The resulting fit describes a dependency between luminosity and the logarithm of the turn-off time and is used in the following equation:
| (3) |
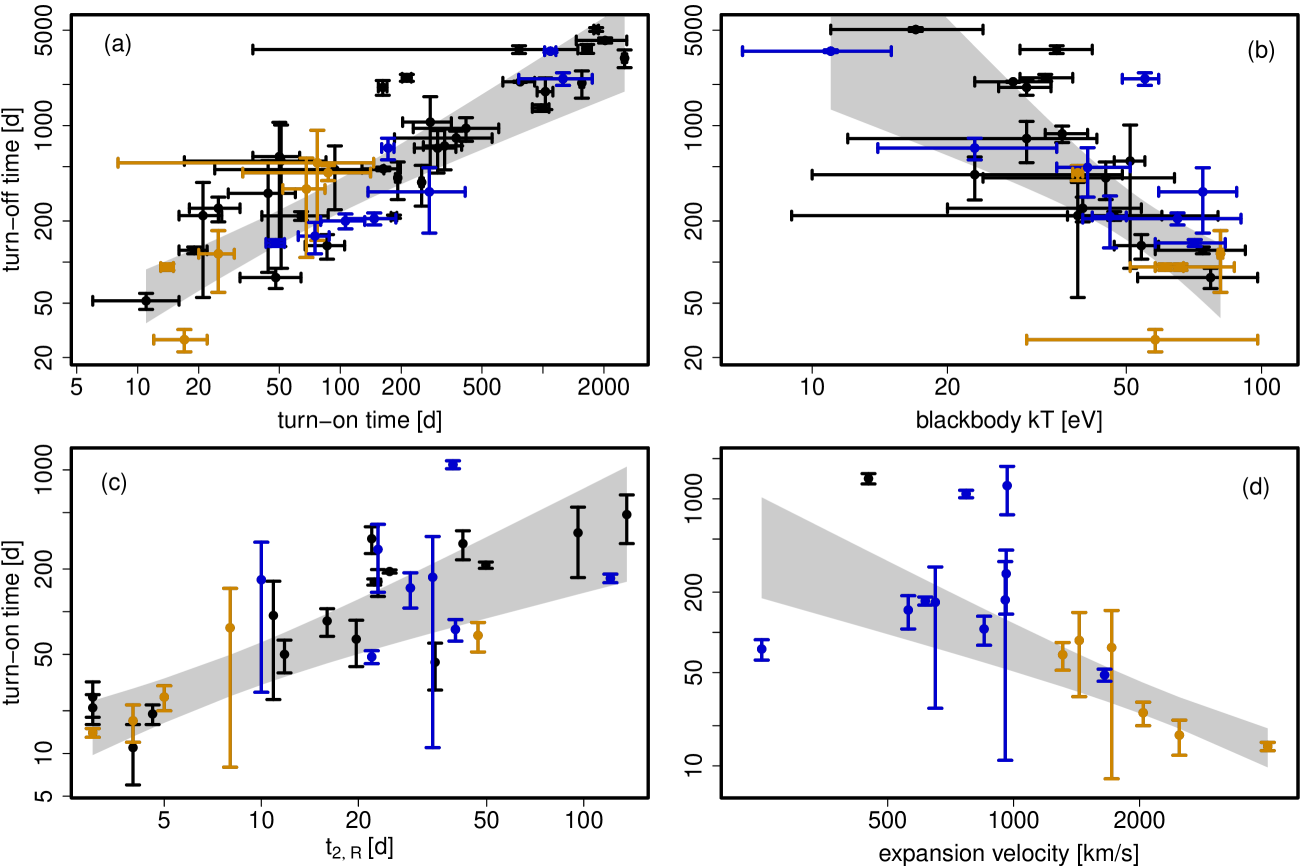
5.2 Correlations and Relationships between nova parameters
5.2.1 The correlations from Paper II revisited
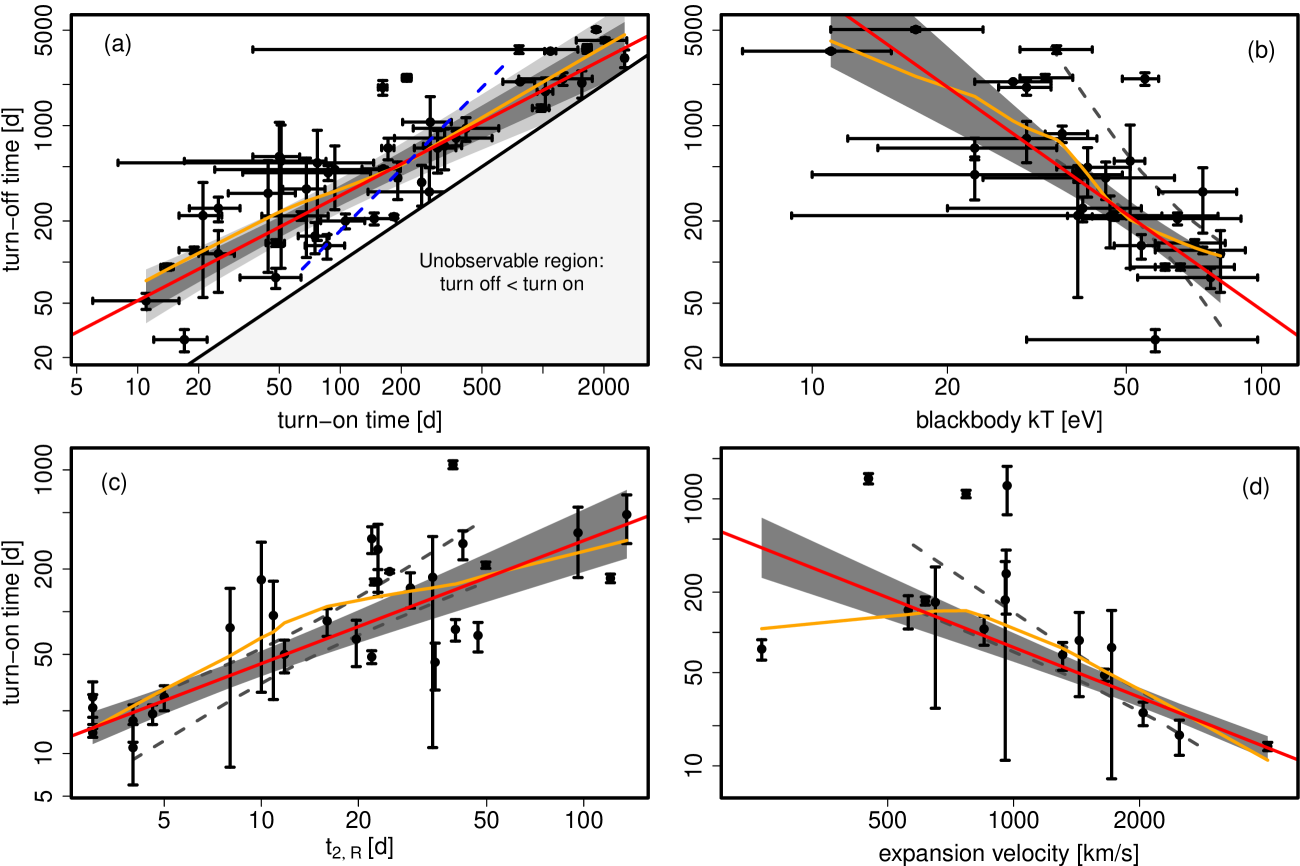
In Fig. 8, we show updated double-logarithmic scatterplots for the four parameter correlations found in Paper II. Using the extended catalogue, all correlations are still present and we could reduce the uncertainty of the fit for most of them. Figure 8 also compares the old and new confidence contours. We further included in each plot a smoothed representation of the scattered values to estimate the appropriateness of the power law fit. This smooth curve was estimated based on the LOWESS algorithm (Cleveland 1981), which computes a robust locally weighted regression.
For this analysis, we only used those novae in Table 9 for which the respective parameters were sufficiently well constrained, where their uncertainties were smaller than the values themselves. Furthermore, we estimated the best fits via a robust least squares regression method due to the presence of obvious outliers in all of the correlations. This fitting process (rlm in R’s MASS package with default parameters) employed an M estimator (see e.g. Feigelson & Babu 2013). Although there is no strong heteroscedacity left in the logarithmic variables, we continued to use weighted fits. All models in Fig. 8 have been found to be stable using bootstrapping tests.
Furthermore, we confirmed the presence of strong correlations in the original, untransformed variables by computing the Spearman rank correlation coefficients for the four pairs of variables shown in Fig. 8. This is a non-parametric coefficient that does not assume a linear relation. Its absolute values for the correlations in Fig. 8 a – d are: , , and . All four Spearman coefficients indicate correlations that are significant on the 99% confidence level and beyond (p-values of 2, 3, 3 and 6). In the following, we discuss the correlations in detail.
The correlation between the SSS turn-on () and turn-off () time is displayed in Fig. 8a. This plot contains the largest number of objects and shows the tightest correlation with a Pearson index of 0.86. Error bars for both time scales generally bridge the last detection and first post-SSS non detection with the parameter estimate at the midpoint in-between. Observing the turn-off of several novae with exceptionally long SSS phases provided us with stronger constraints towards the upper end of the relation. The best-fit power law index did not change with respect to Paper II but the overall errors became slightly smaller:
| (4) |
The plot shows that the simple power law fit (red) follows the smoothed curve (orange) remarkably well over the entire parameter range. The remaining small deviations between the two curves might be explained by outliers (see below) or by a different behaviour of bulge and disk novae (see Sect. 5.3).
The light grey-shaded area in the lower right corner of the plot shows the “unobservable” region of . Note that objects in this region would not be forbidden, because physically indicates the time at which the expanding nova envelope becomes transparent to soft X-rays and is the time scale on which the H-burning ends. Recall that both time scales start at the optical outburst. It cannot be assumed a priori that there is no parameter configuration for which the H-burning ceases before the ejected matter becomes optically thin to X-rays. Of course, these objects could never be observed. It remains an open question as to which extent the non-detection of some novae might be caused by such a self-absorption (but see for instance Nielsen et al. 2013, for a recent discussion on SSSs obscured by circumbinary material).
While this condition of not being able to populate the lower right corner of Fig. 8a restricts the parameter space, we argue that it does in no way presuppose the correlation. There is no obvious bias that would stop novae from entering the upper left corner of the plot nor hinder us from detecting them. These objects would necessarily be characterised by short and long times. This means that they should be visible for considerably longer times than any of the novae that are actually found as SSS. However, there is no detection of such objects even in the hundreds of kilo-seconds in our accumulated data. Therefore, we assume that the correlation we found is not caused by observational biases.
We found one possible source of distortions to the power law model: Our conservative strategy in estimating the times for SSSs that disappeared between monitoring seasons. For those objects, we assumed a at the midpoint between the campaigns. Very fast SSSs often turn-off during the campaign (however, see the discussion for M31N 2011-02b above). For long lasting SSSs, overestimating by a few hundred days (i.e. the typical time between campaigns) does not make a big difference. However, adding such an offset to the turn-off times of medium fast novae could have a pronounced impact on the correlation.
Indeed, we see a group of objects above the power law fit with d and large error bars in Fig. 8a. These are mainly novae from the early archival campaigns by PFF2005 and PHS2007 (e.g. M31N 2001-10f, M31N 2004-11e) for which the assumption of a at the midpoint between observations might be an overestimate. This is a good example of how the identification of population trends can help to detect irregularities. However, without further knowledge of nova SSS light curves, which is a study beyond the scope of this paper, we have to consider the current individual estimates to be sufficiently cautious.
There are two novae clearly above the general data scatter: both M31N 2000-07a and M31N 2004-05b lie well outside the 99.9% confidence region in Fig. 8a towards longer values. Both sources are located on the upper end of the vs confidence contours in Fig. 8b, suggesting that their might indeed be unusually long rather than their being too short. The optical outburst of M31N 2004-05b is not well defined (discovery after visibility window re-opened), but the X-ray time scales for both objects are sufficiently long to be essentially independent of a few months shift of the nova outburst. Also, an earlier around 2100 d (see Sect. 3.1) would not alter the result significantly. Interestingly, both sources appeared to have experienced significant long-term variations in temperature and became significantly hotter towards the end of their SSS phase (see PHS2007 and Paper I). In Paper II, we speculated that prolonged SSS turn-off times could be explained by re-established accretion fuelling the H-burning on the WD beyond the expected duration.
The correlation between the black body temperature () and is the subject of Fig. 8b. Temperature error bars are . Note that, due to a typing error, equation 3 in Paper II (which modelled this relation for the earlier data) did not agree with the corresponding correlation plot. It should have been reading . We wish to thank J. Osborne for pointing this mistake out to us. The relation stated in Paper II did not take into account nova M31N 2007-12d (the fastest nova in the old and new correlation). The best-fit temperature of this nova does seem to deviate even more strongly in the updated plot (see Fig. 8b). All other objects agree reasonably well within the errors with the simple power law fit. This is also indicated by the way in which the power law approximates the smoothed curve. The updated model with a milder slope and reduced errors is given here:
| (5) |
The correlation of the R band light curve decay time by two magnitudes () and is visualised in Fig. 8c. In comparison to Paper II, the slope of the power law fit and its overall uncertainties were significantly reduced. New data in both X-rays and the optical (from the photometric catalogue of Shafter et al. (2011d)) populated the fast end of the correlation. There remains considerable scatter, in particular towards the slower novae. Since the estimated time depends on how close to the actual peak the maximum magnitude was measured and to a certain extent on the shape of the light curve, some of the scatter might arise from a necessarily non-continuous observational coverage. Nevertheless, the smoothed curve is reasonably well approximated by the best fit power law:
| (6) |
The correlation between the expansion velocity of the ejected envelope () as determined from optical spectra and is shown in Fig. 8d. Here, the overall trend is still clearly visible, but the updated plot contains more scatter and significant outliers. This suggests a more complicated relation between the two parameters than was assumed in Paper II. Variances in density, composition, and geometrical shape of the ejected envelope are likely to create a scatter around this correlation. The smoothed curve is strongly attached to a single object with the lowest measured expansion velocity. This source might also influence the power law fit towards a milder slope. The current, robust model takes this data point into account and reads as follows:
| (7) |
In contrast to Paper II, we have included nova M31N 2003-08c in modelling this relation (the left-most object above the power law fit in Fig. 8d). Previously, the SSS turn-on time of this object was considered potentially unreliable. Now, the robust model is better capable of taking this nova into account without overestimating its influence.
The smoothed curve and, to a minor extend, the robust fit are influenced by the object with the lowest expansion velocity. This nova is M31 2011-11e, which is discussed in Sect. 3.2.17 as a potential high-inclination system, because of its apparently periodic X-ray light curve. With an asymmetric ejecta geometry, this inclination could lead to deviations from general population trends. Future extensions of the M 31 nova catalogue might be able to identify clusters of such objects and take them properly into account when modelling the average nova behaviour.
5.2.2 The correlations in the context of literature results
We compared the correlations and power law fits, as described in Sect. 5.2.1, with results published in the literature. The similarities and differences we found are given here.
Concerning the relation between and , Fig. 8a reveals that our fit for M 31 novae differs significantly from the theoretical prediction formula found by Hachisu & Kato (2010) for the SSS phases of Galactic novae. The result from Hachisu & Kato (2010), as based on their optically thick wind theory and the “universal decline law” (Hachisu & Kato 2006), is shown as a blue dashed line with a range of validity between d and d. This line lies outside the light grey-shaded confidence region (i.e. the 99.9% level) of our power law fit. This comparison might be affected by systematic differences in the definition of the theoretical and observational time scales. For very faint SSSs, the detectability, and therefore, the turn-off time, depends on the detection limit of the specific observation or group of observations. In some cases, our observational estimate of , by the time the X-ray luminosity drops below the detection limit, could be longer than the theoretical used by Hachisu & Kato (2010), which is the time of the actual hydrogen-burning switch-off. However, it is not clear whether these effects could have such a strong impact.
When we combine the relation found between SSS turn-on time and optical decay time (; see Eqn. 6) with the estimate on the mass of the ejected envelope in Eqn. 2 (), we find that . This connection between the optical decay time and the ejected envelope mass, as derived from X-ray data, agrees well with a similar relationship based on optical data of Galactic novae (Della Valle et al. 2002, see their Figure 5 and the corresponding equation in their Section 6).
Considering the relation between the two optical parameters ( and ), by combining Eqns. 6 and 7, produces a result that agrees within the errors with what was found by Shafter et al. (2011d) based on their spectroscopic and photometric survey of M 31. This indicates that the subset of M 31 novae with SSS phase does not seem to behave differently from the larger sample studied by these authors.
Vanlandingham et al. (2001) already suggested a correlation between SSS turn-off times (which they estimated using UV observations) and the rate in Galactic CN data. These authors did not provide a fit to their correlation but it appears steeper than for M 31 novae, where we estimated a power law index . However, it is not clear from their paper, which optical filter was used to observe the light curves that gave the times and whether it was the same filter for all objects. We also note that these authors studied only ONe novae, which are expected to be a minor fraction in our sample. We prefer to use the vs relation because it is the cleaner and better correlation in our sample and provides an intuitive physical interpretation.
Greiner et al. (2003) published a relation for Galactic novae between and with a power law index of ( without uncertainties in the plot of their Figure 4). With (Eqn. 4) and (Eqn. 7), we found , which is considerably flatter. However, both relations might still be comparable within the (partly unknown) errors. Furthermore, Fig. 8(d) features some apparent outliers towards long turn-on times, which might suggest the need for a steeper power law model.
A very recent paper by Wolf et al. (2013) simulated accreting WD properties using the Modules for Experiments in Stellar Astrophysics code (MESA, Paxton et al. 2011; Denissenkov et al. 2013). They also studied nova outbursts and found that the observed - data we published in Paper II agreed with their simulations. However, we found in Sect. 5.2.1 that the slope of the corresponding power law model became flatter in the light of new data and might not be so similar to the results of Wolf et al. (2013) for the slow novae. The simulation by Wolf et al. (2013) also produced a relationship between WD mass and ejected mass, which is tightly connected to the SSS turn-on and turn-off times (their Figure 14). These results agreed with the - correlation from Paper II, which has been confirmed here.
Finally, Schwarz et al. (2011) recently published a comprehensive study of the SSS properties of Galactic novae, which was mainly based on Swift data. A detailed comparison between novae in M 31 and the Galaxy is beyond the scope of this work. This analysis will be the subject of an upcoming paper (Henze et. al., in prep.).
5.2.3 Towards a multi-dimensional interpretation
In Fig. 8, it can be seen that the five parameters , , , and are all correlated with each other in a way such that novae that are fast in the optical also evolve quickly in X-rays and produce hot SSSs. The evidence that novae with short times show fast ejection velocities had already been observed in large optical samples (e.g. Shafter et al. 2011d, see Sect. 5.2.2 above). Our multi-wavelength data now suggests that novae might only populate a narrow strip in the five-parameter space of Fig. 8.
This is consistent with the result of a preliminary multi-dimensional analysis, which we describe in the following. We carried out a principal component analysis (PCA) on the X-ray parameters , , and . The PCA is an exploratory tool to reduce the parameter space of a multi-variate data set by finding new, uncorrelated variables (the so-called principal components; PCs) along axes of maximum variance in the original data. This process can be thought of geometrically, as a rotation that aligns the new axes with the spread of the data.
There are 33 novae for which the three X-ray parameters are known. The PCA input consisted of the log-transformed and standardised variables, thereby correcting for the different physical scales and the potential non-normality of the original parameter distributions (Shapiro-Wilk test: a normal distribution of the transformed variables cannot be excluded). The result shows that about 80% of the total variance in the data could be attributed to the first PC (PC1). This indicates that there is a single hidden parameter, which is proportional to PC1, that dominates the behaviour of novae in the X-ray parameters.
These results have to be considered preliminary, because the sample size is still relatively small. A PCA relies on correlations, which could be spurious in a small sample, and although there seems to be no general consensus, the minimum recommend sample size appears to be around 50 objects. However, we found that the PCA results were stable under bootstrapping tests: percent of variance were attributed to PC1; the composition of which (i.e. the linear combinations of the original variables) was stable as well. We obviously cannot draw any conclusions beyond this first principal component but the clear dominance of PC1 indicates that most of the multi-parameter behaviour of our nova sample might be understood in surprisingly simple terms.
Nevertheless, this type of analysis clearly reveals the shortcomings of our data set. The relatively large number of objects in our catalogue easily hides that we only have measurements of a few parameters for many of them. We also considered a PCA of the full parameter space of Fig. 8 but there were too few (only eleven) objects for which all five parameters had been measured. Additional data is necessary before confident conclusions can be drawn from such a multi-dimensional analysis.
If the initial impression of our preliminary analysis should be confirmed by future studies, what would this indicate? The correlations that are obvious in Fig. 8 do not allow us to conclude that there are direct causal links between the various parameters. Indeed, it would be hard to understand how, for example, the SSS turn-on time could influence the turn-off time in Fig. 8a because the two time scales depend on different physical processes (see Sect. 5.1). The natural explanation for such a correlation is the existence of a third, “hidden” parameter (not directly measured in the data) that determines both of the correlated parameters.
Previous theoretical and observational studies provided several good candidates for this fundamental parameter, which are most prominently the WD mass (e.g. Livio 1992; Della Valle & Livio 1995; Della Valle 2002; Hachisu & Kato 2006), the chemical composition of the WD (e.g. Sala & Hernanz 2005; Hachisu & Kato 2006), the metallicity of the accreted material (e.g. Shafter et al. 2011d; Kato et al. 2013) or the accretion rate (e.g. Nomoto 1982; Yaron et al. 2005). All of these parameters appear to have a significant impact on the nova characteristics. This makes it difficult to reconcile all of the previous studies with our new results, which suggest that one of these parameters in the M 31 sample dominates the observable nova properties.
At this early stage, we resist the temptation to speculate which of the candidate parameters might dominate in our data, but it should be emphasised once again that the surprisingly small scatter around the vs relation in Fig. 8a indicates that the influences of other underlying characteristics, which are unrelated to the dominating parameter, appear to be minor in our M 31 nova sample. Note, however, that we present indications for differences between bulge and disk novae that might be related to a physical parameter of secondary importance in Sect. 5.3.
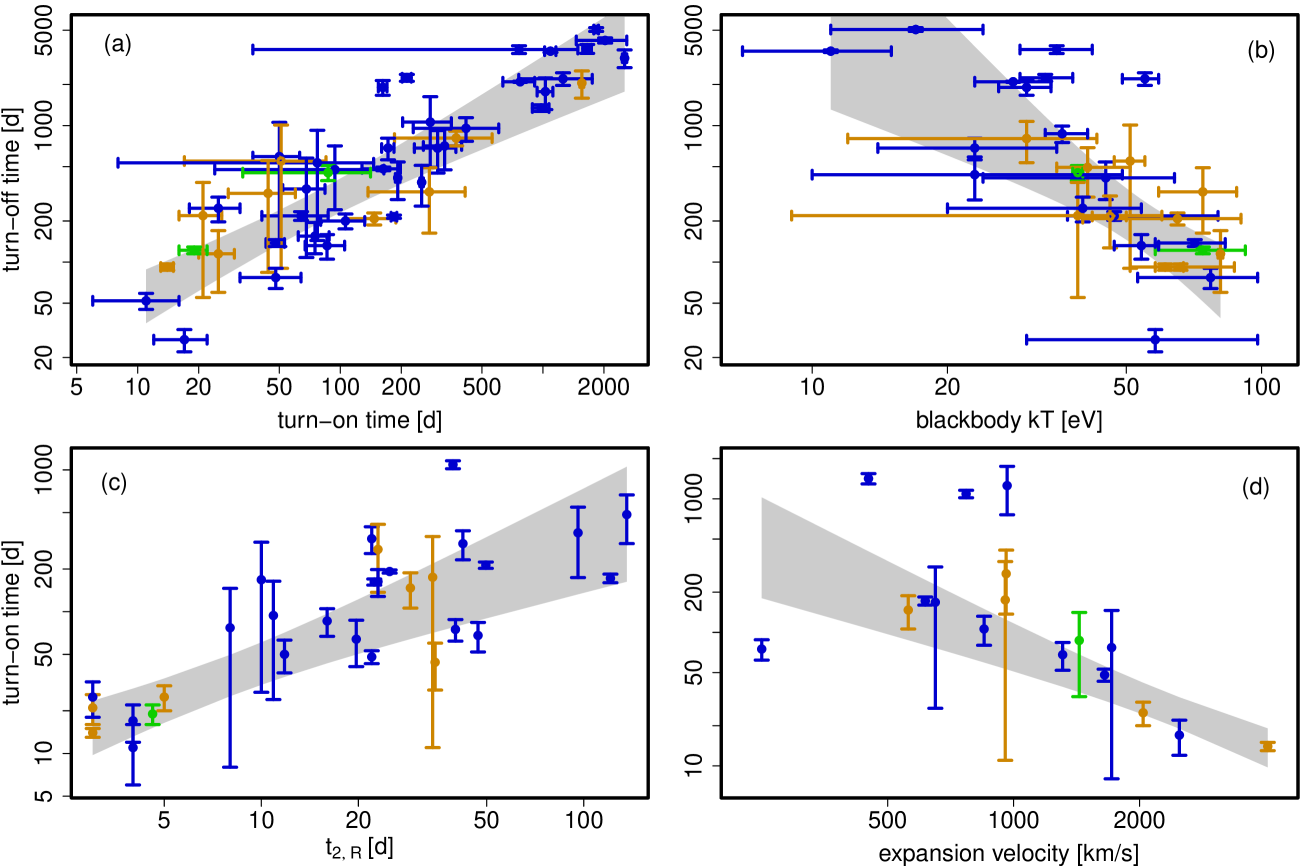
5.3 Population estimates
In this section, we discuss whether there are significant differences in the X-ray parameters of various sub-samples of novae. We distinguish between (i) Fe II vs He/N novae (according to their optical spectra in the system of Williams 1992), (ii) bulge vs disk novae, and (iii) novae with massive vs less massive WDs. The latter two groups of sub-samples are defined below.
In Fig. 9, which is based on Fig. 8, we show how members of the two spectral classes He/N and Fe II are distributed within the correlations, as discussed in Sect. 5.2.1. Unsurprisingly, both spectral types separate strongly in their optical parameters and particular . The dichotomy in the latter case is one of the defining differences between those two classes (Williams 1992).
Nevertheless, Fig. 9d underlines the finding that short SSS turn-on times are connected to He/N novae with high ejection velocities. Della Valle & Livio (1998) reported that Galactic He/N novae tend to be associated with the disk stellar population, which is generally younger and more massive. Therefore, a short SSS turn-on should indicate a high WD mass. The two spectral classes of novae separate reasonably well in the X-ray parameter space as well, thus underlining the close interconnection between the behaviour of novae in both wavelength regimes. On average, He/N novae (orange in Fig. 9) tend to be faster and hotter in X-rays. This supports the view that the two classes are related to fundamental parameters of the nova system.
For the classification of novae in bulge vs disk and high-mass vs low-mass subgroups, we used the same approach as in Paper II. The (projected) M 31 bulge was defined as an ellipse with a semi-major axis of 700″, an ellipticity of 0.5, and a position angle of (based on Beaton et al. 2007). Note that the two GC novae (M31N 2007-06b and M31N 2010-10f) have been excluded from this analysis because their environment is different from both bulge and disk (Henze et al. 2013; Kato et al. 2013). High mass WDs are defined as , which corresponds to d, and low mass WDs as , for d. See Paper II for details. In Fig. 10, the spatial distributions of the four sub-groups are shown, which are overlaid on an optical image of M 31 with a large ellipse indicating the bulge-disk boundary.
In Fig. 11 we show how bulge vs disk novae arrange themselves in the five-parameter space of Fig. 8. Here, the picture is less clear than for the He/N vs Fe II novae. While there appears to be clustering in the black body parameter with disk novae that are on average hotter than bulge novae, the difference is not significant. This is visualised in Fig. 12a, which compares the distributions for both sub-samples. While in Paper II, we found that the average black body temperatures of the two samples were significantly different on the 95% confidence level; this result is not confirmed in the extended sample (using a Wilcoxon rank sum test). This might indicate that the earlier result was due to chance, which is not unlikely given our 95% confidence criterion.
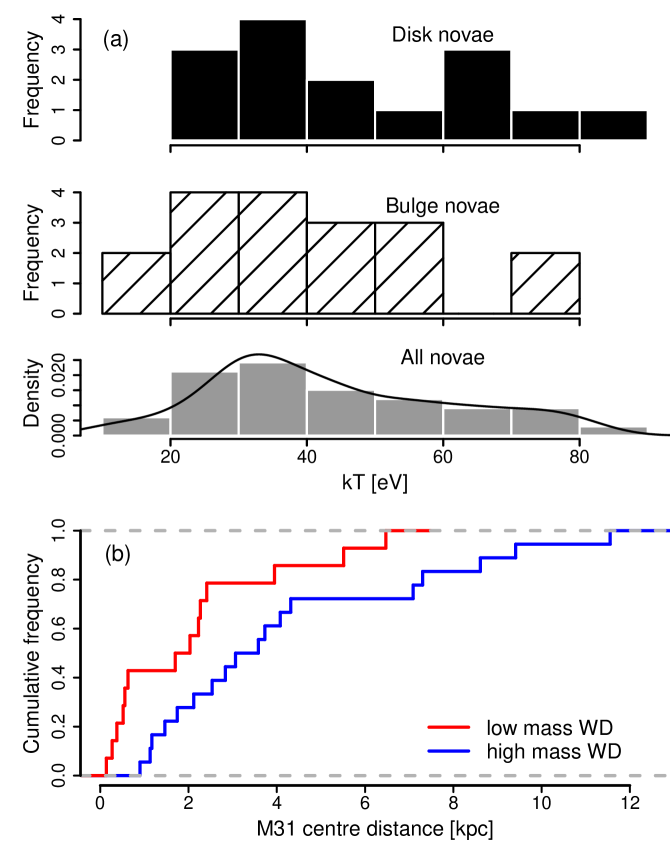
On the other hand, a related finding from Paper II is confirmed in this work. This result focused on the distances from the M 31 centre of high-mass vs low-mass WDs, which are plotted in Fig 12b (using the same colours as for Fig 10). The plot indicates a difference between the (empirical cumulative) distributions for the two samples, and a Wilcoxon test confirms the significance of this result on the (predefined) 95% confidence level. With a p-value of 0.009, the significance even exceeds the 99% confidence limit. Based on their recent spectroscopic and photometric survey of M 31 novae Shafter et al. (2011d) reported “a weak dependence of speed class on position in M 31, with the spatial distribution of the fastest novae slightly more extended […]”. Since optically fast novae also show a rapid SSS (Eqn. 6), the method of Shafter et al. (2011d) is very similar to our comparison in Fig. 12b.
In view of these contrasting results, it remains puzzling that no compelling evidence can be found in favour of or against a dependence of the parameters of novae on their position in M 31. Clearly, the high inclination of M 31 (; see e.g. Beaton et al. 2007) leads to projection effects, which complicate an accurate positional classification for most novae. To overcome this difficulty, it would be necessary to specifically observe novae in the outer disk of M 31 for which an association with the bulge can be excluded. Presently, disk novae are still significantly under-represented in our catalogue.
Furthermore, we have now found that bulge and disk novae are separated at a modestly significant level in the vs diagram, which is much more than in Paper II, where such a trend was merely suggested. Repeating the weighted robust linear regression (in log space) for vs (see Fig. 8a) separately for the bulge and disk novae, we found a significant difference. The model slope for bulge novae () turned out to be significantly steeper than for disk novae (). These slopes agree with what was found in Paper II but the uncertainties now have been reduced sufficiently for an analysis of variance to yield a significance on the 95% confidence level (p-value of 0.016). The result is visualised in Fig. 13, and we found its (95%) significance to be robust against the removal of outliers. Future studies should test this significance. Again, both GC novae were excluded in this analysis.
Such a difference in slopes for the vs relation in different populations is not predicted by current theoretical models. Could it be explained by observational biases that affect disk novae differently than bulge novae? Since a disk nova would not necessarily have been detected in our M 31 centre monitoring, which is in contrast to the majority of bulge novae, it could be possible for the less frequent and more irregular observational coverage to create a bias.
However, our sample only contained objects with measured SSS turn-off times and relatively well constrained errors in both time scales (see Sect. 5.2). This incidentally means that all disk novae considered in Fig. 13 are located within the field of view of the central monitoring. Also, the average (median) uncertainties for the SSS turn-on and turn-off time scales were comparable for the bulge and disk sub samples.
Another possible way of distorting the measured and times of disk novae with respect to bulge novae is via absorption within M 31. On average, objects in the disk suffer a considerably higher extinction than those in the bulge (see e.g. Montalto et al. 2009). The impact on the observed SSS duration is difficult to quantify without a detailed knowledge of SSS light curves (an analysis which is beyond the scope of this paper). However, we can assume qualitatively that the SSS durations would be shortened with presumably a slightly later detection on the rise in luminosity (i.e. a longer ) and an earlier because the declining source flux would fall below the detection threshold sooner.
Such behaviour is not consistent with the observations in Fig. 13. For short turn-on times, the turn-off times of disk novae appear to be on average longer than for bulge novae with comparable . This discrepancy increases slightly if we assume that the disk turn-on times might be delayed. For longer turn-on times, disk novae seem to turn-off earlier as SSSs, but it is difficult to imagine how absorption alone could act selectively only on slow novae. Overall, we did not find evidence of an obvious observational bias that could explain Fig. 13.
5.4 Completeness simulation
In Paper II, we carried out a simulation to determine the intrinsic fraction of M 31 novae with SSS phase based on our monitoring. Here, we repeated this analysis by also including the three monitoring campaigns discussed in this paper (see Table 1). This means that the simulation was based on 85 individual observations from eight different monitoring seasons (presented in PFF2005, PHS2007, Papers I & II, and this work). The XMM-Newton ToO observations described in Henze et al. (2012a) were not included here because they were not aimed at the M 31 centre.
The details of the simulation are outlined in Paper II. In short, we assumed a theoretically observable WD mass distribution for novae (mainly determined by short recurrence times of intrinsically less frequent high-mass systems) and translated it into an expected SSS turn-on time distribution (following Hachisu & Kato 2006). This was used to estimate an SSS visibility distribution based on Eqn. 4. We then took all M 31 novae within our field of view since 1995 (correcting for XMM-Newton source confusion in the innermost part of M 31) and, based on the visibility distribution, we randomly assigned and times to them. A certain fraction of these novae was then checked against our observations to see if they would have been detected (i.e. their SSS visibility covers at least one observation). By varying this fraction , we adjusted the expected number of detected novae to match the actual number of detections in each campaign using a Markov Chain Monte Carlo procedure. The that led to the closest agreement with the observed nova counts (using a likelihood criterion) was accepted as the most likely intrinsic fraction of novae with SSS phase. For the resulting Markov chain, we excluded the burn-in data and applied a generous thinning to remove auto-correlation within the chain.
Additionally, we incorporate the asymmetry of the positional distribution of SSS counterparts in this work, as discussed in Paper II. This asymmetry can be seen in Fig. 10, where most of the novae detected in X-rays are projected onto the far (east) side of M 31. The effect is probably caused by additional foreground absorption by the M 31 disk. Therefore, we excluded optical novae from the near side of the M 31 disk from the simulation (and adjusted the number of actually detected SSSs accordingly). In total, this simulation was based on 234 novae.
The results are shown in Fig. 14, which plots the distribution of the SSS fraction . The median of this distribution is at 0.81 with the 95% confidence limit at 0.62, and it can be approximated by a Gaussian truncated at 1 with a standard deviation of 0.1. Given our assumptions, we can therefore say that the intrinsic fraction of novae with SSS state is larger than 62% with 95% confidence. The most likely value is at 81%. Still, we cannot exclude that all novae experience an SSS phase and that the relatively low detection fraction is caused by the inevitably incomplete observational coverage.
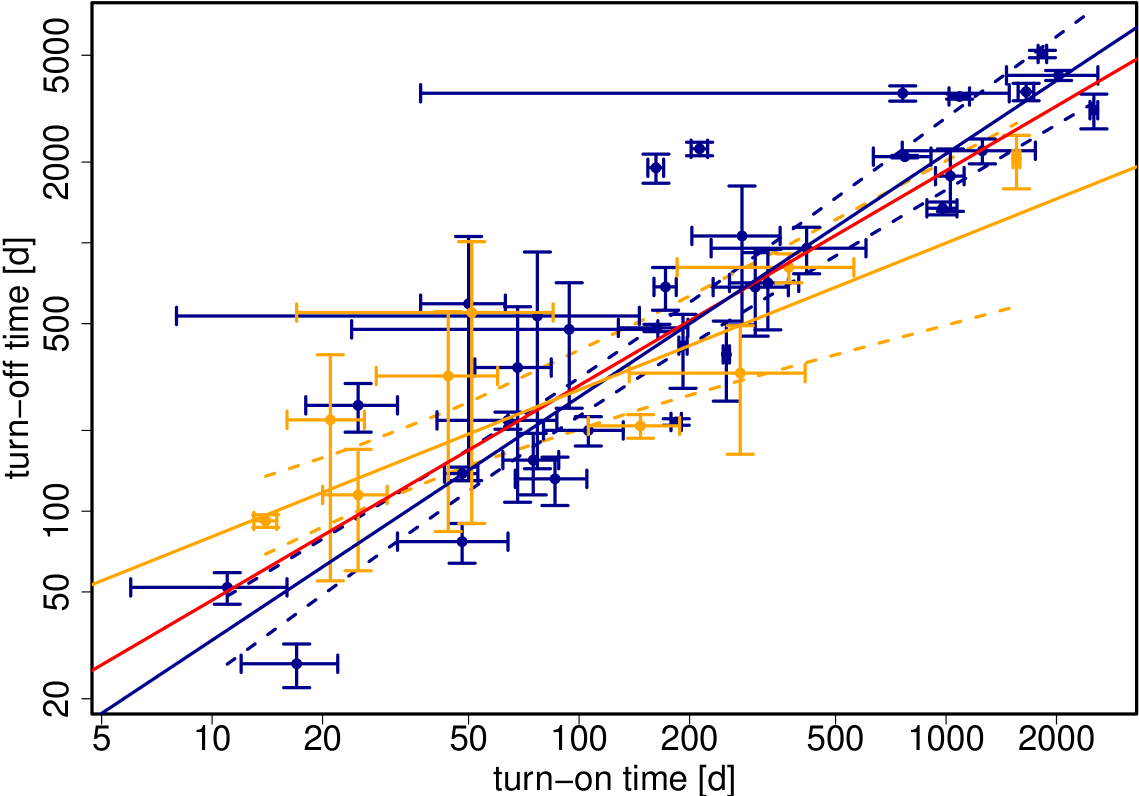

A mechanism that could stop M 31 novae from being detected in X-rays is the self-absorption of the SSS flux by the ejected material (i.e. ). The correlation plot in Fig. 8a provides no strong suggestion of a continuum distribution that may spread into the unobservable region.
6 Summary
This paper presents the results of dedicated monitoring observations of the M 31 central area with XMM-Newton and Chandra. We discovered 17 new X-ray counterparts of optical novae and detected 24 novae in total. Several individual objects were discussed in detail because they either displayed particularly interesting spectral long-term evolutions or showed X-ray light curves that featured noteworthy variability on time scales of hours.
Within the bigger picture, our new results increased the total number of M 31 novae with X-ray detection to 79. A thorough analysis of the extended catalogue yielded several interesting results: A number of correlations between optical and X-ray parameters, as first seen in M 31 data in Paper II, was shown to be stable, and the uncertainties of the corresponding power law models were reduced considerably. We found evidence of multi-parameter relations dominated by a single physical parameter. We suggested interpretations and implications from this behaviour. The well-defined power law relationships allowed us to examine various outliers. We found that there still is evidence of different X-ray characteristics of bulge vs disk novae in M 31 although not all population results from Paper II could be confirmed. Last but not least, we cannot exclude that all optical M 31 novae show a SSS state based on a simple simulation, although our observations suggest that 20% of them might not.
Finally, we wish to emphasise the unique role that M 31 has always played and will hopefully also play in the future for large scale surveys and population studies of novae. The size and proximity of our neighbour galaxy make it an ideal target for studying a nova sample homogeneous in distance but diverse in properties. The coming decades undoubtedly will see large scale optical surveys becoming more popular, and nova discoveries in nearby galaxies will increase in frequency. In the past years, we have seen the fraction of M 31 novae with spectroscopic follow-up increase sharply, and several different groups are now providing optical spectra soon after discovery. It is a golden age for nova studies, and if X-ray observations can keep up with their optical counterparts, then the discovery potential will be high.
Acknowledgements.
We thank the anonymouos referee for comments that helped to improve the paper. We wish to thank A. W. Shafter and S. N. Shore for fruitful discussions of preliminary results. We acknowledge the use of Swift information for the Galactic nova V723 Cas, based on monitoring observations obtained by J.-U. Ness and G. Schwarz. The X-ray work is based in part on observations with XMM-Newton, an ESA Science Mission with instruments and contributions directly funded by ESA Member States and NASA. The XMM-Newton project is supported by the Bundesministerium für Wirtschaft und Technologie / Deutsches Zentrum für Luft- und Raumfahrt (BMWI/DLR FKZ 50 OX 0001) and the Max-Planck Society. M. Henze acknowledges support from the BMWI/DLR, FKZ 50 OR 1010, and from an ESA fellowship. M. Hernanz acknowledges the Spanish MICINN project AYA2011-24704 and FEDER funds. GS acknowledges MICINN grants AYA2010-15685 and AYA2011-23102, Government of Catalonia grant 2009SGR-1002, and the ESF EUROCORES Program EuroGENESIS through the MICINN grant EUI2009-04167.References
- Alksnis et al. (2008) Alksnis, A., Smirnova, O., & Zharova, A. V. 2008, Astronomy Letters, 34, 563
- Ansari et al. (2004) Ansari, R., Aurière, M., Baillon, P., et al. 2004, A&A, 421, 509
- Arai (2011) Arai, A. 2011, Central Bureau Electronic Telegrams, 2631, 7
- Arnaud (1996) Arnaud, K. A. 1996, in Astronomical Society of the Pacific Conference Series, Vol. 101, Astronomical Data Analysis Software and Systems V, ed. G. H. Jacoby & J. Barnes, 17–+
- Baernbantner & Riffeser (2006) Baernbantner, O. & Riffeser, A. 2006, The Astronomer’s Telegram, 808, 1
- Balucinska-Church & McCammon (1992) Balucinska-Church, M. & McCammon, D. 1992, ApJ, 400, 699
- Barsukova et al. (2011) Barsukova, E., Fabrika, S., Hornoch, K., et al. 2011, The Astronomer’s Telegram, 3725, 1
- Beaton et al. (2007) Beaton, R. L., Majewski, S. R., Guhathakurta, P., et al. 2007, ApJ, 658, L91
- Blackburn (1995) Blackburn, J. K. 1995, in Astronomical Society of the Pacific Conference Series, Vol. 77, Astronomical Data Analysis Software and Systems IV, ed. R. A. Shaw, H. E. Payne, & J. J. E. Hayes, 367–+
- Bode et al. (2009) Bode, M. F., Darnley, M. J., Shafter, A. W., et al. 2009, ApJ, 705, 1056
- Bode & Evans (2008) Bode, M. F. & Evans, A. 2008, Classical Novae, ed. Bode, M. F. & Evans, A.
- Burwitz et al. (2007) Burwitz, V., Pietsch, W., Updike, A., et al. 2007, The Astronomer’s Telegram, 1238, 1
- Cao et al. (2012) Cao, Y., Kasliwal, M. M., Neill, J. D., et al. 2012, ApJ, 752, 133
- Capaccioli et al. (1989) Capaccioli, M., Della Valle, M., Rosino, L., & D’Onofrio, M. 1989, AJ, 97, 1622
- Casanova et al. (2010) Casanova, J., José, J., García-Berro, E., Calder, A., & Shore, S. N. 2010, A&A, 513, L5+
- Ciardullo et al. (1987) Ciardullo, R., Ford, H. C., Neill, J. D., Jacoby, G. H., & Shafter, A. W. 1987, ApJ, 318, 520
- Cleveland (1981) Cleveland, W. S. 1981, The American Statistician, 35, 54
- Darnley et al. (2006) Darnley, M. J., Bode, M. F., Kerins, E., et al. 2006, MNRAS, 369, 257
- Darnley et al. (2004) Darnley, M. J., Bode, M. F., Kerins, E., et al. 2004, MNRAS, 353, 571
- Della Valle (2002) Della Valle, M. 2002, in American Institute of Physics Conference Series, Vol. 637, Classical Nova Explosions, ed. M. Hernanz & J. José, 443–456
- Della Valle et al. (1992) Della Valle, M., Bianchini, A., Livio, M., & Orio, M. 1992, A&A, 266, 232
- Della Valle & Livio (1994) Della Valle, M. & Livio, M. 1994, A&A, 286, 786
- Della Valle & Livio (1995) Della Valle, M. & Livio, M. 1995, ApJ, 452, 704
- Della Valle & Livio (1996) Della Valle, M. & Livio, M. 1996, ApJ, 473, 240
- Della Valle & Livio (1998) Della Valle, M. & Livio, M. 1998, ApJ, 506, 818
- Della Valle et al. (2002) Della Valle, M., Pasquini, L., Daou, D., & Williams, R. E. 2002, A&A, 390, 155
- Denissenkov et al. (2013) Denissenkov, P. A., Herwig, F., Bildsten, L., & Paxton, B. 2013, ApJ, 762, 8
- di Mille et al. (2003) di Mille, F., Ciroi, S., Botte, V., & Boschetti, C. S. 2003, IAU Circ., 8231, 4
- Di Mille et al. (2009) Di Mille, F., Ciroi, S., Navasardyan, H., et al. 2009, The Astronomer’s Telegram, 2171, 1
- Dimai & Manzini (2005) Dimai, A. & Manzini, F. 2005, The Astronomer’s Telegram, 421, 1
- Drake et al. (2003) Drake, J. J., Wagner, R. M., Starrfield, S., et al. 2003, ApJ, 584, 448
- Duerbeck (1990) Duerbeck, H. W. 1990, in Lecture Notes in Physics, Berlin Springer Verlag, Vol. 369, IAU Colloq. 122: Physics of Classical Novae, ed. A. Cassatella & R. Viotti, 34–+
- Feigelson & Babu (2013) Feigelson, E. D. & Babu, G. J. 2013, Statistical Methods for Astronomy, ed. T. D. Oswalt & H. E. Bond, 445
- Fiaschi et al. (2002) Fiaschi, M., Di Mille, F., Cariolato, R., Swift, B., & Li, W. D. 2002, IAU Circ., 7794, 1
- Fiaschi et al. (2003) Fiaschi, M., Tiveron, D., & Cardullo, A. 2003, IAU Circ., 8226, 2
- Filippenko & Chornock (2001) Filippenko, A. V. & Chornock, R. 2001, IAU Circ., 7738, 3
- Filippenko & Chornock (2002) Filippenko, A. V. & Chornock, R. 2002, IAU Circ., 7825, 3
- Filippenko et al. (1999) Filippenko, A. V., Chornock, R. T., Coil, A. L., Leonard, D. C., & Li, W. D. 1999, IAU Circ., 7272, 2
- Fruscione et al. (2006) Fruscione, A., McDowell, J. C., Allen, G. E., et al. 2006, in Society of Photo-Optical Instrumentation Engineers (SPIE) Conference Series, Vol. 6270, Society of Photo-Optical Instrumentation Engineers (SPIE) Conference Series
- Gabriel et al. (2004) Gabriel, C., Denby, M., Fyfe, D. J., et al. 2004, in Astronomical Society of the Pacific Conference Series, Vol. 314, Astronomical Data Analysis Software and Systems (ADASS) XIII, ed. F. Ochsenbein, M. G. Allen, & D. Egret, 759–+
- Gerasimovic (1936) Gerasimovic, B. P. 1936, Popular Astronomy, 44, 78
- Gilfanov & Bogdán (2010) Gilfanov, M. & Bogdán, Á. 2010, Nature, 463, 924
- Gregory & Loredo (1992) Gregory, P. C. & Loredo, T. J. 1992, ApJ, 398, 146
- Greiner et al. (2003) Greiner, J., Orio, M., & Schartel, N. 2003, A&A, 405, 703
- Hachisu & Kato (2006) Hachisu, I. & Kato, M. 2006, ApJS, 167, 59
- Hachisu & Kato (2010) Hachisu, I. & Kato, M. 2010, ApJ, 709, 680
- Hachisu et al. (2012) Hachisu, I., Kato, M., & Nomoto, K. 2012, ApJ, 756, L4
- Hatano et al. (1997) Hatano, K., Branch, D., Fisher, A., & Starrfield, S. 1997, ApJ, 487, L45
- Henze et al. (2007) Henze, M., Burwitz, V., Pietsch, W., et al. 2007, The Astronomer’s Telegram, 1336, 1
- Henze et al. (2008a) Henze, M., Burwitz, V., Pietsch, W., et al. 2008a, The Astronomer’s Telegram, 1580, 1
- Henze et al. (2009a) Henze, M., Kaduk, F., Burwitz, V., et al. 2009a, The Astronomer’s Telegram, 2165, 1
- Henze et al. (2011a) Henze, M., Lutz, K., Pietsch, W., et al. 2011a, The Astronomer’s Telegram, 3486, 1
- Henze et al. (2008b) Henze, M., Meusinger, H., & Pietsch, W. 2008b, A&A, 477, 67
- Henze et al. (2011b) Henze, M., Pietsch, W., Burwitz, V., et al. 2011b, Central Bureau Electronic Telegrams, 2631, 6
- Henze et al. (2008c) Henze, M., Pietsch, W., Burwitz, V., et al. 2008c, The Astronomer’s Telegram, 1602, 1
- Henze et al. (2010a) Henze, M., Pietsch, W., & Haberl, F. 2010a, The Astronomer’s Telegram, 2787, 1
- Henze et al. (2011c) Henze, M., Pietsch, W., Haberl, F., & Burwitz, V. 2011c, The Astronomer’s Telegram, 3441, 1
- Henze et al. (2013) Henze, M., Pietsch, W., Haberl, F., et al. 2013, A&A, 549, A120
- Henze et al. (2010b) Henze, M., Pietsch, W., Haberl, F., et al. 2010b, A&A, 523, A89 [Paper I]
- Henze et al. (2012a) Henze, M., Pietsch, W., Haberl, F., et al. 2012a, A&A, 544, A44
- Henze et al. (2011d) Henze, M., Pietsch, W., Haberl, F., et al. 2011d, A&A, 533, A52 [Paper II]
- Henze et al. (2012b) Henze, M., Pietsch, W., Haberl, F., & Middleton, M. 2012b, The Astronomer’s Telegram, 4511, 1
- Henze et al. (2009b) Henze, M., Pietsch, W., Haberl, F., & Orio, M. 2009b, The Astronomer’s Telegram, 2274, 1
- Henze et al. (2009c) Henze, M., Pietsch, W., Haberl, F., et al. 2009c, A&A, 500, 769
- Henze et al. (2009d) Henze, M., Pietsch, W., Sala, G., et al. 2009d, A&A, 498, L13
- Hofmann et al. (2013) Hofmann, F., Pietsch, W., Henze, M., et al. 2013, A&A, 555, A65
- Holland (1998) Holland, S. 1998, AJ, 115, 1916
- Hornoch (2003) Hornoch, K. 2003, IAU Circ., 8248, 2
- Hornoch et al. (2010a) Hornoch, K., Corral-Santana, M., Casares, J., et al. 2010a, Central Bureau Electronic Telegrams, 2411, 1
- Hornoch et al. (2010b) Hornoch, K., Khan, R., Bird, J., et al. 2010b, Central Bureau Electronic Telegrams, 2319, 1
- Hornoch et al. (2010c) Hornoch, K., Kubanek, P., Gorosabel, J., et al. 2010c, Central Bureau Electronic Telegrams, 2187, 3
- Hornoch et al. (2011) Hornoch, K., Mikulecka, B., & Wolf, M. 2011, Central Bureau Electronic Telegrams, 2631, 4
- Hornoch et al. (2012) Hornoch, K., Vrastil, J., & Hornochova, P. 2012, The Astronomer’s Telegram, 4096, 1
- Hornoch et al. (2010d) Hornoch, K., Wolf, M., Hornochova, P., et al. 2010d, Central Bureau Electronic Telegrams, 2305, 1
- Hornochova et al. (2010) Hornochova, P., Hornoch, K., Wolf, M., Kusnirak, P., & Pejcha, O. 2010, Central Bureau Electronic Telegrams, 2573, 1
- Hubble (1929) Hubble, E. P. 1929, ApJ, 69, 103
- Kaaret (2002) Kaaret, P. 2002, ApJ, 578, 114
- Kato & Hachisu (2012) Kato, M. & Hachisu, I. 2012, Bulletin of the Astronomical Society of India, 40, 393
- Kato et al. (2013) Kato, M., Hachisu, I., & Henze, M. 2013, ApJ, 779, 19
- Koishikawa (2010) Koishikawa, M. 2010, Central Bureau Electronic Telegrams, 2582, 1
- Krautter (2002) Krautter, J. 2002, in American Institute of Physics Conference Series, Vol. 637, Classical Nova Explosions, ed. M. Hernanz & J. José, 345
- Lang et al. (2006) Lang, F., Lerchster, M., & Fliri, J. 2006, The Astronomer’s Telegram, 821, 1
- Law et al. (2009) Law, N. M., Kulkarni, S. R., Dekany, R. G., et al. 2009, PASP, 121, 1395
- Lee et al. (2012) Lee, C.-H., Riffeser, A., Seitz, S., et al. 2012, A&A, 537, A43
- Livio (1992) Livio, M. 1992, ApJ, 393, 516
- McLaughlin (1939) McLaughlin, D. B. 1939, Popular Astronomy, 47, 538
- Medvedev et al. (2009) Medvedev, A., Barsukova, E., Valeev, A., et al. 2009, The Astronomer’s Telegram, 2213, 1
- Middleton et al. (2013) Middleton, M. J., Miller-Jones, J. C. A., Markoff, S., et al. 2013, Nature, 493, 187
- Montalto et al. (2009) Montalto, M., Seitz, S., Riffeser, A., et al. 2009, A&A, 507, 283
- Nedialkov et al. (2002) Nedialkov, P., Orio, M., Birkle, K., et al. 2002, A&A, 389, 439
- Nelson et al. (2008) Nelson, T., Liu, J. F., di Stefano, R., et al. 2008, The Astronomer’s Telegram, 1672, 1
- Ness et al. (2008) Ness, J., Schwarz, G., Starrfield, S., et al. 2008, AJ, 135, 1328
- Ness et al. (2012) Ness, J.-U., Schaefer, B. E., Dobrotka, A., et al. 2012, ApJ, 745, 43
- Nielsen et al. (2013) Nielsen, M. T. B., Dominik, C., Nelemans, G., & Voss, R. 2013, A&A, 549, A32
- Nishiyama & Kabashima (2010a) Nishiyama, K. & Kabashima, F. 2010a, Central Bureau Electronic Telegrams, 2305, 2
- Nishiyama & Kabashima (2010b) Nishiyama, K. & Kabashima, F. 2010b, Central Bureau Electronic Telegrams, 2582, 3
- Nishiyama & Kabashima (2011) Nishiyama, K. & Kabashima, F. 2011, Central Bureau Electronic Telegrams, 2631, 1
- Nishiyama et al. (2010) Nishiyama, K., Kabashima, F., Sun, G., Yusa, T., & Pietsch, W. 2010, Central Bureau Electronic Telegrams, 2472, 1
- Nomoto (1982) Nomoto, K. 1982, ApJ, 253, 798
- Orio & Nelson (2008) Orio, M. & Nelson, T. 2008, The Astronomer’s Telegram, 1390, 1
- Osborne et al. (2011) Osborne, J. P., Page, K. L., Beardmore, A. P., et al. 2011, ApJ, 727, 124
- Ovcharov et al. (2009) Ovcharov, E., Valcheva, A., Georgiev, T., et al. 2009, The Astronomer’s Telegram, 2176, 1
- Ovcharov et al. (2011) Ovcharov, E., Valcheva, A., Kostov, A., Nikolov, Y., & Nedialkov, P. 2011, The Astronomer’s Telegram, 3693, 1
- Ovcharov et al. (2008) Ovcharov, E., Valcheva, A., Latev, G., et al. 2008, The Astronomer’s Telegram, 1563, 1
- Parmar et al. (1998) Parmar, A. N., Kahabka, P., Hartmann, H. W., Heise, J., & Taylor, B. G. 1998, A&A, 332, 199
- Paxton et al. (2011) Paxton, B., Bildsten, L., Dotter, A., et al. 2011, ApJS, 192, 3
- Payne-Gaposchkin (1964) Payne-Gaposchkin, C. 1964, The galactic novae (New York: Dover Publication, 1964)
- Pietsch et al. (2007a) Pietsch, W., Burwitz, V., Greiner, J., et al. 2007a, The Astronomer’s Telegram, 1009, 1
- Pietsch et al. (2006a) Pietsch, W., Burwitz, V., Greiner, J., et al. 2006a, The Astronomer’s Telegram, 850, 1
- Pietsch et al. (2006b) Pietsch, W., Burwitz, V., Rodriguez, J., & Garcia, A. 2006b, The Astronomer’s Telegram, 805, 1
- Pietsch et al. (2007b) Pietsch, W., Burwitz, V., Updike, A., et al. 2007b, The Astronomer’s Telegram, 1257, 1
- Pietsch et al. (2005a) Pietsch, W., Fliri, J., Freyberg, M. J., et al. 2005a, A&A, 442, 879 [PFF2005]
- Pietsch et al. (2006c) Pietsch, W., Fliri, J., Freyberg, M. J., et al. 2006c, A&A, 454, 773
- Pietsch et al. (2005b) Pietsch, W., Freyberg, M., & Haberl, F. 2005b, A&A, 434, 483
- Pietsch et al. (2007c) Pietsch, W., Greiner, J., Haberl, F., & Sala, G. 2007c, The Astronomer’s Telegram, 1116, 1
- Pietsch et al. (2007d) Pietsch, W., Haberl, F., Sala, G., et al. 2007d, A&A, 465, 375 [PHS2007]
- Pietsch & Henze (2010) Pietsch, W. & Henze, M. 2010, The Astronomer’s Telegram, 2435, 1
- Pietsch et al. (2010a) Pietsch, W., Henze, M., Burwitz, V., et al. 2010a, Central Bureau Electronic Telegrams, 2582, 2
- Pietsch et al. (2010b) Pietsch, W., Henze, M., Burwitz, V., et al. 2010b, The Astronomer’s Telegram, 3001, 1
- Pietsch et al. (2010c) Pietsch, W., Henze, M., Burwitz, V., et al. 2010c, The Astronomer’s Telegram, 3076, 1
- Pietsch et al. (2010d) Pietsch, W., Henze, M., Haberl, F., & Burwitz, V. 2010d, The Astronomer’s Telegram, 3038, 1
- Pietsch et al. (2010e) Pietsch, W., Henze, M., Haberl, F., & Burwitz, V. 2010e, The Astronomer’s Telegram, 3013, 1
- Pietsch et al. (2011) Pietsch, W., Henze, M., Haberl, F., et al. 2011, A&A, 531, A22+
- Pietsch et al. (2009) Pietsch, W., Kaduk, F., Henze, M., et al. 2009, The Astronomer’s Telegram, 2147, 1
- Pietsch et al. (2010f) Pietsch, W., Lloyd, J., Henze, M., et al. 2010f, The Astronomer’s Telegram, 2896, 1
- Pietsch et al. (2010g) Pietsch, W., Lloyd, J., Henze, M., et al. 2010g, The Astronomer’s Telegram, 2964, 1
- Quimby (2006) Quimby, R. 2006, The Astronomer’s Telegram, 887, 1
- R Development Core Team (2011) R Development Core Team. 2011, R: A Language and Environment for Statistical Computing, R Foundation for Statistical Computing, Vienna, Austria, ISBN 3-900051-07-0
- Rau et al. (2007) Rau, A., Burwitz, V., Cenko, S. B., et al. 2007, The Astronomer’s Telegram, 1242, 1
- Rector et al. (1999) Rector, T. A., Jacoby, G. H., Corbett, D. L., Denham, M., & RBSE Nova Search Team. 1999, in American Astronomical Society Meeting Abstracts, Vol. 195, American Astronomical Society Meeting Abstracts, 36.08
- Ries & Riffeser (2006) Ries, C. & Riffeser, A. 2006, The Astronomer’s Telegram, 829, 1
- Rosino (1973) Rosino, L. 1973, A&AS, 9, 347
- Sala & Hernanz (2005) Sala, G. & Hernanz, M. 2005, A&A, 439, 1061
- Schaefer & Collazzi (2010) Schaefer, B. E. & Collazzi, A. C. 2010, AJ, 139, 1831
- Schaefer et al. (2010) Schaefer, B. E., Pagnotta, A., Xiao, L., et al. 2010, AJ, 140, 925
- Schwarz et al. (2011) Schwarz, G. J., Ness, J.-U., Osborne, J. P., et al. 2011, ApJS, 197, 31
- Shafter (2007a) Shafter, A. W. 2007a, The Astronomer’s Telegram, 1341, 1
- Shafter (2007b) Shafter, A. W. 2007b, The Astronomer’s Telegram, 1332, 1
- Shafter (2013) Shafter, A. W. 2013, AJ, 145, 117
- Shafter et al. (2010a) Shafter, A. W., Bode, M. F., Darnley, M. J., Ciardullo, R., & Misselt, K. A. 2010a, The Astronomer’s Telegram, 3006, 1
- Shafter et al. (2011a) Shafter, A. W., Ciardullo, R., Bode, M. F., & Darnley, M. J. 2011a, The Astronomer’s Telegram, 3699, 1
- Shafter et al. (2011b) Shafter, A. W., Ciardullo, R., Darnley, M. J., & Bode, M. F. 2011b, The Astronomer’s Telegram, 3727, 1
- Shafter et al. (2010b) Shafter, A. W., Ciardullo, R., Darnley, M. J., Bode, M. F., & Misselt, K. A. 2010b, The Astronomer’s Telegram, 2898, 1
- Shafter et al. (2010c) Shafter, A. W., Ciardullo, R., Darnley, M. J., Bode, M. F., & Misselt, K. A. 2010c, The Astronomer’s Telegram, 2909, 1
- Shafter et al. (2000) Shafter, A. W., Ciardullo, R., & Pritchet, C. J. 2000, ApJ, 530, 193
- Shafter et al. (2006) Shafter, A. W., Coelho, E. A., Misselt, K. A., et al. 2006, The Astronomer’s Telegram, 923, 1
- Shafter et al. (2011c) Shafter, A. W., Darnley, M. J., Bode, M. F., & Ciardullo, R. 2011c, The Astronomer’s Telegram, 3778, 1
- Shafter et al. (2012) Shafter, A. W., Darnley, M. J., Bode, M. F., & Ciardullo, R. 2012, ApJ, 752, 156
- Shafter et al. (2011d) Shafter, A. W., Darnley, M. J., Hornoch, K., et al. 2011d, ApJ, 734, 12
- Shafter & Irby (2001) Shafter, A. W. & Irby, B. K. 2001, ApJ, 563, 749
- Shafter & Quimby (2007) Shafter, A. W. & Quimby, R. M. 2007, ApJ, 671, L121
- Shanley et al. (1995) Shanley, L., Ogelman, H., Gallagher, J. S., Orio, M., & Krautter, J. 1995, ApJ, 438, L95
- Sharov & Alksnis (1998) Sharov, A. S. & Alksnis, A. 1998, Astronomy Letters, 24, 641
- Sharov & Alksnis (1989) Sharov, A. S. & Alksnis, A. K. 1989, Soviet Astronomy Letters, 15, 382
- Slutsky (1998) Slutsky, B. 1998, Journal of Chemical Information and Computer Sciences, 38, 1254
- Smirnova & Alksnis (2006) Smirnova, O. & Alksnis, A. 2006, Informational Bulletin on Variable Stars, 5720, 1
- Smirnova et al. (2006) Smirnova, O., Alksnis, A., & Zharova, A. V. 2006, Informational Bulletin on Variable Stars, 5737, 1
- Stanek & Garnavich (1998) Stanek, K. Z. & Garnavich, P. M. 1998, ApJ, 503, L131
- Stark et al. (1992) Stark, A. A., Gammie, C. F., Wilson, R. W., et al. 1992, ApJS, 79, 77
- Starrfield (1989) Starrfield, S. 1989, in Classical Novae, 39
- Stiele et al. (2010) Stiele, H., Pietsch, W., Haberl, F., et al. 2010, Astronomische Nachrichten, 331, 212
- Stiele et al. (2008) Stiele, H., Pietsch, W., Haberl, F., & Freyberg, M. 2008, A&A, 480, 599
- Stiele et al. (2011) Stiele, H., Pietsch, W., Haberl, F., et al. 2011, A&A, 534, A55+
- Strope et al. (2010) Strope, R. J., Schaefer, B. E., & Henden, A. A. 2010, AJ, 140, 34
- Sun & Gao (2010) Sun, G. & Gao, X. 2010, Central Bureau Electronic Telegrams, 2582, 4
- Sun & Gao (2011) Sun, G. & Gao, X. 2011, Central Bureau Electronic Telegrams, 2631, 3
- Trudolyubov et al. (2005) Trudolyubov, S., Kotov, O., Priedhorsky, W., Cordova, F., & Mason, K. 2005, ApJ, 634, 314
- Vanlandingham et al. (2001) Vanlandingham, K. M., Schwarz, G. J., Shore, S. N., & Starrfield, S. 2001, AJ, 121, 1126
- Voss et al. (2008) Voss, R., Pietsch, W., Haberl, F., et al. 2008, A&A, 489, 707
- Warner (2002) Warner, B. 2002, in American Institute of Physics Conference Series, Vol. 637, Classical Nova Explosions, ed. M. Hernanz & J. José, 3–15
- Williams et al. (2006) Williams, B. F., Naik, S., Garcia, M. R., & Callanan, P. J. 2006, ApJ, 643, 356
- Williams (1992) Williams, R. E. 1992, AJ, 104, 725
- Wilms et al. (2000) Wilms, J., Allen, A., & McCray, R. 2000, ApJ, 542, 914
- Wolf et al. (2013) Wolf, W. M., Bildsten, L., Brooks, J., & Paxton, B. 2013, ApJ, 777, 136
- Yaron et al. (2005) Yaron, O., Prialnik, D., Shara, M. M., & Kovetz, A. 2005, ApJ, 623, 398
- Yungelson et al. (1997) Yungelson, L., Livio, M., & Tutukov, A. 1997, ApJ, 481, 127
- Yusa (2011) Yusa, T. 2011, Central Bureau Electronic Telegrams, 2631, 2
| Telescope/Instrument | ObsID | Exposure Time [ks] | Start Date | JD | Offset | ||||
|---|---|---|---|---|---|---|---|---|---|
| pn | MOS1 | MOS2 | HRC-I | [UT] | 2 450 000+ | RA [] | Dec [] | ||
| 2009/10 | |||||||||
| Chandra HRC-I | 10882 | 18.8 | 2009-11-07.23 | 5142.73 | -0.3 | 0.4 | |||
| Chandra HRC-I | 10883 | 18.3 | 2009-11-16.24 | 5151.74 | -0.4 | 0.3 | |||
| Chandra HRC-I | 10884 | 18.4 | 2009-11-27.63 | 5163.13 | -0.3 | 0.3 | |||
| Chandra HRC-I | 10885 | 18.3 | 2009-12-08.94 | 5174.44 | -0.4 | 0.2 | |||
| Chandra HRC-I | 10886 | 18.3 | 2009-12-17.90 | 5183.40 | -0.4 | 0.1 | |||
| XMM-Newton EPIC | 0600660201 | 14.4 | 18.1 | 18.1 | 2009-12-28.53 | 5194.03 | 1.7 | 0.3 | |
| XMM-Newton EPIC | 0600660301 | 13.2 | 16.7 | 16.8 | 2010-01-07.32 | 5203.82 | 1.8 | 0.3 | |
| XMM-Newton EPIC | 0600660401 | 10.0 | 16.6 | 16.7 | 2010-01-15.53 | 5212.03 | -0.3 | 1.5 | |
| XMM-Newton EPIC | 0600660501 | 10.2 | 16.3 | 16.5 | 2010-01-25.11 | 5221.61 | -0.1 | 1.4 | |
| XMM-Newton EPIC | 0600660601 | 12.0 | 16.6 | 16.5 | 2010-02-02.11 | 5229.61 | -0.4 | 1.5 | |
| Chandra HRC-I | 11808 | 17.1 | 2010-02-15.86 | 5243.36 | -0.4 | 0.0 | |||
| Chandra HRC-I | 11809 | 18.4 | 2010-02-26.27 | 5253.77 | -0.4 | 0.0 | |||
| 2010/11 | |||||||||
| Chandra HRC-I | 12110 | 20.0 | 2010-11-14.17 | 5514.67 | -0.8 | 0.2 | |||
| Chandra HRC-I | 12111 | 19.9 | 2010-11-23.18 | 5523.68 | -0.7 | 0.3 | |||
| Chandra HRC-I | 12112 | 19.9 | 2010-12-03.66 | 5534.16 | -0.6 | 0.2 | |||
| Chandra HRC-I | 12113 | 19.0 | 2010-12-12.56 | 5543.06 | -0.5 | 0.1 | |||
| Chandra HRC-I | 12114 | 20.0 | 2010-12-22.18 | 5552.68 | -0.5 | 0.2 | |||
| XMM-Newton EPIC | 0650560201 | 18.7 | 23.5 | 24.1 | 2010-12-26.43 | 5556.93 | 0.9 | 0.3 | |
| XMM-Newton EPIC | 0650560301 | 21.6 | 30.6 | 31.4 | 2011-01-04.76 | 5566.26 | -0.2 | 0.3 | |
| XMM-Newton EPIC | 0650560401 | 11.9 | 16.3 | 18.6 | 2011-01-15.01 | 5576.51 | 1.0 | 1.0 | |
| XMM-Newton EPIC | 0650560501 | 6.2 | 20.7 | 21.7 | 2011-01-25.30 | 5586.80 | 0.1 | 0.8 | |
| XMM-Newton EPIC | 0650560601 | 16.2 | 22.9 | 23.0 | 2011-02-04.00 | 5596.50 | -0.2 | 0.6 | |
| Chandra HRC-I | 13178 | 17.5 | 2011-02-17.15 | 5609.65 | -0.4 | 0.0 | |||
| Chandra HRC-I | 13179 | 17.5 | 2011-02-27.25 | 5619.75 | -0.2 | -0.1 | |||
| Chandra HRC-I | 13180 | 17.3 | 2011-03-10.12 | 5630.62 | 0.0 | -0.2 | |||
| 2011/12 | |||||||||
| Chandra HRC-I | 13227 | 20.0 | 2011-11-12.10 | 5877.60 | -0.4 | 0.1 | |||
| Chandra HRC-I | 13228 | 19.0 | 2011-11-21.22 | 5886.72 | -0.5 | 0.1 | |||
| Chandra HRC-I | 13229 | 19.6 | 2011-11-30.98 | 5896.48 | -0.2 | 0.4 | |||
| Chandra HRC-I | 13230 | 18.9 | 2011-12-11.56 | 5907.06 | -0.3 | 0.4 | |||
| Chandra HRC-I | 13231 | 19.5 | 2011-12-20.33 | 5915.83 | -0.4 | -0.2 | |||
| XMM-Newton EPIC | 0674210201 | 16.7 | 20.3 | 20.3 | 2011-12-28.05 | 5923.55 | -1.7 | 0.1 | |
| XMM-Newton EPIC | 0674210301 | 13.6 | 16.8 | 16.8 | 2012-01-07.12 | 5933.62 | 0.4 | 0.2 | |
| XMM-Newton EPIC | 0674210401 | 15.9 | 19.4 | 19.4 | 2012-01-15.62 | 5942.12 | 0.3 | 0.7 | |
| XMM-Newton EPIC | 0674210501 | 13.6 | 16.8 | 16.8 | 2012-01-21.51 | 5948.01 | -0.1 | 1.5 | |
| XMM-Newton EPIC | 0674210601 | 17.8 | 20.9 | 21.2 | 2012-01-31.10 | 5957.60 | -1.1 | 0.1 | |
| Chandra HRC-I | 13278 | 19.0 | 2012-02-17.76 | 5973.26 | -0.5 | -0.2 | |||
| Chandra HRC-I | 13279 | 18.8 | 2012-02-28.26 | 5983.76 | -0.2 | -0.3 | |||
| Chandra HRC-I | 13280 | 19.3 | 2012-03-13.21 | 5999.71 | -0.1 | -0.5 | |||
| Chandra HRC-I | 13281 | 18.9 | 2012-06-01.90 | 6080.40 | 0.4 | 0.0 | |||
Notes: : Dead-time corrected; for XMM-Newton EPIC after screening for high background.
: Start time of observations; for XMM-Newton EPIC the pn start time was used.
: Offset of image WCS (world coordinate system) to the WCS of the catalogue by Kaaret (2002).
| Optical nova candidate | X-ray measurements | ||||||
|---|---|---|---|---|---|---|---|
| Name | RA (h:m:s) | MJD | Observation | Comment | |||
| M31N | Dec (d:m:s) | (d) | (″) | ID | (d) | (10 erg s) | |
| 1996-08b | 00:42:55.20 | 50307.0 | 1.7 | mrg3 (HRC-I) | 4835.2 | ||
| +41:20:46.0 | mrg3 (EPIC) | 4886.5 | |||||
| mrg4 (HRC-I) | 5207.2 | ||||||
| mrg4 (EPIC) | 5249.4 | ||||||
| 2001-10a | 00:43:03.31 | 52185.91 | 0.1 | 10882 (HRC-I) | 2956.3 | ||
| +41:12:11.5 | 0.3 | 10883 (HRC-I) | 2965.3 | ||||
| 1.6 | 10884 (HRC-I) | 2976.7 | |||||
| 2.3 | 10885 (HRC-I) | 2988.0 | |||||
| 1.5 | 10886 (HRC-I) | 2997.0 | |||||
| 1.4 | 0600660201 (EPIC) | 3007.6 | |||||
| 0600660301 (EPIC) | 3017.4 | ||||||
| 0600660401 (EPIC) | 3025.6 | ||||||
| 0600660501 (EPIC) | 3035.2 | ||||||
| 0600660601 (EPIC) | 3043.2 | ||||||
| 0.7 | 11808 (HRC-I) | 3056.9 | |||||
| 11809 (HRC-I) | 3067.4 | ||||||
| 1.9 | 12110 (HRC-I) | 3328.3 | |||||
| 12111 (HRC-I) | 3337.3 | ||||||
| 1.0 | 12112 (HRC-I) | 3347.8 | |||||
| 0.7 | 12113 (HRC-I) | 3356.6 | |||||
| 1.8 | 12114 (HRC-I) | 3366.3 | |||||
| 1.9 | 0650560201 (EPIC) | 3370.5 | |||||
| 0650560301 (EPIC) | 3379.8 | ||||||
| 0650560401 (EPIC) | 3390.1 | ||||||
| 0650560501 (EPIC) | 3400.4 | ||||||
| 0650560601 (EPIC) | 3410.1 | ||||||
| 13178 (HRC-I) | 3423.2 | ||||||
| 2.2 | 13179 (HRC-I) | 3433.3 | |||||
| 13180 (HRC-I) | 3444.2 | ||||||
| 0655620301 (EPIC) | 3588.3 | ToO | |||||
| 2003-08c | 00:42:41.20 | 52878.0 | 0.2 | mrg3 (HRC-I) | 2264.2 | ||
| +41:16:16.0 | 0.1 | mrg4 (HRC-I) | 2636.2 | ||||
| 0.4 | mrg5 (HRC-I) | 2999.1 | |||||
| 2004-01b | 00:42:41.18 | 53005.74 | 0.2 | 10882 (HRC-I) | 2136.5 | ||
| +41:15:45.0 | 0.1 | 10883 (HRC-I) | 2145.5 | ||||
| 0.2 | 10884 (HRC-I) | 2156.9 | |||||
| 0.2 | 10885 (HRC-I) | 2168.2 | |||||
| 0.1 | 10886 (HRC-I) | 2177.2 | |||||
| 0.2 | 11808 (HRC-I) | 2237.1 | |||||
| 0.3 | 11809 (HRC-I) | 2247.5 | |||||
| 12110 (HRC-I) | 2508.4 | ||||||
| 0.2 | 12111 (HRC-I) | 2517.4 | |||||
| 12112 (HRC-I) | 2527.9 | ||||||
| 12113 (HRC-I) | 2536.8 | ||||||
| 12114 (HRC-I) | 2546.4 | ||||||
| 0.4 | 13178 (HRC-I) | 2603.4 | |||||
| 13179 (HRC-I) | 2613.5 | ||||||
| 0.3 | 13180 (HRC-I) | 2624.4 | |||||
| 0.2 | 13227 (HRC-I) | 2871.4 | |||||
| 0.1 | 13228 (HRC-I) | 2880.5 | |||||
| 0.2 | 13229 (HRC-I) | 2890.2 | |||||
| 0.1 | 13230 (HRC-I) | 2900.8 | |||||
| 0.2 | 13231 (HRC-I) | 2909.6 | |||||
| 0.1 | 13278 (HRC-I) | 2967.0 | |||||
| 0.1 | 13279 (HRC-I) | 2977.5 | |||||
| 0.2 | 13280 (HRC-I) | 2993.5 | |||||
| 0.1 | 13281 (HRC-I) | 3074.2 | |||||
| Optical nova candidate | X-ray measurements | ||||||
|---|---|---|---|---|---|---|---|
| Name | RA (h:m:s) | MJD | Observation | Comment | |||
| M31N | Dec (d:m:s) | (d) | (″) | ID | (d) | (10 erg s) | |
| 2004-05b | 00:42:37.04 | 53143.06 | 0.3 | 10882 (HRC-I) | 1999.2 | ||
| +41:14:28.5 | 0.4 | 10883 (HRC-I) | 2008.2 | ||||
| 0.4 | 10884 (HRC-I) | 2019.6 | |||||
| 0.5 | 10885 (HRC-I) | 2030.9 | |||||
| 0.4 | 10886 (HRC-I) | 2039.8 | |||||
| 0600660201 (EPIC) | 2050.5 | ||||||
| 0600660301 (EPIC) | 2060.3 | ||||||
| 0600660401 (EPIC) | 2068.5 | ||||||
| 0600660501 (EPIC) | 2078.0 | ||||||
| 0600660601 (EPIC) | 2086.0 | ||||||
| 0.3 | 11808 (HRC-I) | 2099.8 | |||||
| 11809 (HRC-I) | 2110.2 | ||||||
| mrg4 (HRC-I) | 2371.1 | ||||||
| mrg4 (EPIC) | 2413.4 | ||||||
| 2006-06b | 00:42:32.77 | 53867.07 | 0.3 | 10882 (HRC-I) | 1275.2 | ||
| +41:16:49.1 | 0.4 | 10883 (HRC-I) | 1284.2 | ||||
| 0.3 | 10884 (HRC-I) | 1295.6 | |||||
| 0.3 | 10885 (HRC-I) | 1306.9 | |||||
| 0.3 | 10886 (HRC-I) | 1315.8 | |||||
| 0.8 | 0600660201 (EPIC) | 1326.5 | |||||
| 0600660301 (EPIC) | 1336.2 | ||||||
| 0600660401 (EPIC) | 1344.5 | ||||||
| 2.8 | 0600660501 (EPIC) | 1354.0 | |||||
| 0600660601 (EPIC) | 1362.0 | ||||||
| 0.2 | 11808 (HRC-I) | 1375.8 | |||||
| 0.2 | 11809 (HRC-I) | 1386.2 | |||||
| 0.2 | 12110 (HRC-I) | 1647.1 | |||||
| 0.1 | 12111 (HRC-I) | 1656.1 | |||||
| 0.5 | 12112 (HRC-I) | 1666.6 | |||||
| 0.3 | 12113 (HRC-I) | 1675.5 | |||||
| 0.3 | 12114 (HRC-I) | 1685.1 | |||||
| 1.1 | 0650560201 (EPIC) | 1689.4 | |||||
| 0.5 | 0650560301 (EPIC) | 1698.7 | |||||
| 1.1 | 0650560401 (EPIC) | 1708.9 | |||||
| 0650560501 (EPIC) | 1719.2 | ||||||
| 0.8 | 0650560601 (EPIC) | 1728.9 | |||||
| 0.2 | 13178 (HRC-I) | 1742.1 | |||||
| 0.3 | 13179 (HRC-I) | 1752.2 | |||||
| 0.2 | 13180 (HRC-I) | 1763.1 | |||||
| 0.2 | 13227 (HRC-I) | 2010.0 | |||||
| 0.5 | 13228 (HRC-I) | 2019.2 | |||||
| 0.2 | 13229 (HRC-I) | 2028.9 | |||||
| 0.2 | 13230 (HRC-I) | 2039.5 | |||||
| 0.2 | 13231 (HRC-I) | 2048.3 | |||||
| 0674210201 (EPIC) | 2056.0 | ||||||
| 0674210301 (EPIC) | 2066.1 | ||||||
| 0674210401 (EPIC) | 2074.6 | ||||||
| 0674210501 (EPIC) | 2080.4 | ||||||
| 0674210601 (EPIC) | 2090.0 | ||||||
| 13278 (HRC-I) | 2105.7 | ||||||
| 13279 (HRC-I) | 2116.2 | ||||||
| 13280 (HRC-I) | 2132.1 | ||||||
| 13281 (HRC-I) | 2212.8 | ||||||
| Optical nova candidate | X-ray measurements | ||||||
| Name | RA (h:m:s) | MJD | Observation | Comment | |||
| M31N | Dec (d:m:s) | (d) | (″) | ID | (d) | (10 erg s) | |
| 2007-02b | 00:41:40.32 | 54134.8 | 3.0 | 0600660201 (EPIC) | 1058.7 | ||
| +41:14:33.5 | 2.2 | 0600660301 (EPIC) | 1068.5 | ||||
| 2.2 | 0600660501 (EPIC) | 1086.3 | |||||
| 0.5 | 0600660601 (EPIC) | 1094.3 | |||||
| mrg4 (EPIC) | 1421.6 | ||||||
Notes: : RA, Dec are given in J2000.0; : Modified Julian Date of optical outburst; MJD = JD - 2 400 000.5; : Distance in arcsec between optical and X-ray source; : mrg3/4/5 (HRC-I/EPIC) indicates merged data of all HRC-I/EPIC observations during 2009/10, 2010/11 or 2011/12; : Time after observed start of optical outburst; : unabsorbed equivalent luminosity in the 0.2–10.0 keV band assuming a 50 eV black body spectrum with Galactic foreground absorption (luminosity errors are 1, upper limits are 3); : SSS or SSS-HR indicate X-ray sources classified as supersoft based on XMM-Newton spectra or Chandra hardness ratios, respectively. The comment ToO refers to the observations presented in Henze et al. (2012a).
| Optical nova candidate | X-ray measurements | ||||||
|---|---|---|---|---|---|---|---|
| Name | RA (h:m:s) | MJD | Observation | Comment | |||
| M31N | Dec (d:m:s) | (d) | (″) | ID | (d) | (10 erg s) | |
| 2002-08b | 00:42:48.66 | 52512.06 | mrg1 (HRC-I) | 1899.6 | |||
| +41:16:26.3 | mrg2 (HRC-I) | 2266.3 | |||||
| 0.3 | mrg3 (HRC-I) | 2630.2 | |||||
| 0.6 | mrg4 (HRC-I) | 3002.1 | |||||
| 0.4 | mrg5 (HRC-I) | 3365.0 | |||||
| 2009-05a | 00:42:45.04 | 54968.07 | mrg3 (HRC-I) | 174.2 | |||
| +41:15:21.2 | 12110 (HRC-I) | 546.1 | |||||
| 0.2 | 12111 (HRC-I) | 555.1 | |||||
| 0.1 | 12112 (HRC-I) | 565.6 | |||||
| 0.3 | 12113 (HRC-I) | 574.5 | |||||
| 0.3 | 12114 (HRC-I) | 584.1 | |||||
| 13178 (HRC-I) | 641.1 | ||||||
| 0.1 | 13179 (HRC-I) | 651.2 | |||||
| 13180 (HRC-I) | 662.1 | ||||||
| 0.3 | 13227 (HRC-I) | 909.0 | |||||
| 0.2 | 13228 (HRC-I) | 918.2 | |||||
| 0.1 | 13229 (HRC-I) | 927.9 | |||||
| 0.1 | 13230 (HRC-I) | 938.5 | |||||
| 0.2 | 13231 (HRC-I) | 947.3 | |||||
| 0.1 | 13278 (HRC-I) | 1004.7 | |||||
| 0.3 | 13279 (HRC-I) | 1015.2 | |||||
| 0.1 | 13280 (HRC-I) | 1031.1 | |||||
| 0.5 | 13281 (HRC-I) | 1111.8 | |||||
| 2009-05b | 00:42:33.98 | 54968.07 | 1.3 | 10882 (HRC-I) | 174.2 | ||
| +41:10:55.9 | 1.5 | 10883 (HRC-I) | 183.2 | ||||
| 2.5 | 10884 (HRC-I) | 194.6 | |||||
| 10885 (HRC-I) | 205.9 | ||||||
| 10886 (HRC-I) | 214.8 | ||||||
| 0600660201 (EPIC) | 225.5 | ||||||
| 0600660301 (EPIC) | 235.2 | ||||||
| 0600660401 (EPIC) | 243.5 | ||||||
| 0600660501 (EPIC) | 253.0 | ||||||
| 0600660601 (EPIC) | 261.0 | ||||||
| 2.8 | 11808 (HRC-I) | 274.8 | |||||
| 11809 (HRC-I) | 285.2 | ||||||
| mrg4 (HRC-I) | 546.1 | ||||||
| mrg4 (EPIC) | 588.4 | ||||||
| 2009-08c | 00:42:41.22 | 55055.42 | 10882 (HRC-I) | 86.8 | |||
| +41:17:01.3 | 10883 (HRC-I) | 95.8 | |||||
| 10884 (HRC-I) | 107.2 | ||||||
| 10885 (HRC-I) | 118.5 | ||||||
| 10886 (HRC-I) | 127.5 | ||||||
| 11808 (HRC-I) | 187.4 | ||||||
| 0.2 | 11809 (HRC-I) | 197.9 | |||||
| 0.4 | 12110 (HRC-I) | 458.8 | |||||
| 0.3 | 12111 (HRC-I) | 467.8 | |||||
| 12112 (HRC-I) | 478.2 | ||||||
| 12113 (HRC-I) | 487.1 | ||||||
| 12114 (HRC-I) | 496.8 | ||||||
| 13178 (HRC-I) | 553.7 | ||||||
| 13179 (HRC-I) | 563.8 | ||||||
| 13180 (HRC-I) | 574.7 | ||||||
| 2009-08d | 00:42:46.76 | 55055.42 | 0.3 | mrg3 (HRC-I) | 86.8 | ||
| +41:15:37.3 | mrg4 (HRC-I) | 458.8 | |||||
| Optical nova candidate | X-ray measurements | ||||||
|---|---|---|---|---|---|---|---|
| Name | RA (h:m:s) | MJD | Observation | Comment | |||
| M31N | Dec (d:m:s) | (d) | (″) | ID | (d) | (10 erg s) | |
| 2009-08e | 00:42:36.16 | 55068.9 | 10882 (HRC-I) | 73.3 | |||
| +41:18:02.4 | 10883 (HRC-I) | 82.3 | |||||
| 10884 (HRC-I) | 93.7 | ||||||
| 10885 (HRC-I) | 105.0 | ||||||
| 10886 (HRC-I) | 114.0 | ||||||
| 0600660201 (EPIC) | 124.6 | ||||||
| 0600660301 (EPIC) | 134.4 | ||||||
| 0600660401 (EPIC) | 142.6 | ||||||
| 0600660501 (EPIC) | 152.2 | ||||||
| 0600660601 (EPIC) | 160.2 | ||||||
| 11808 (HRC-I) | 174.0 | ||||||
| 0.8 | 11809 (HRC-I) | 184.4 | |||||
| 0.6 | 12110 (HRC-I) | 445.3 | |||||
| 0.9 | 12111 (HRC-I) | 454.3 | |||||
| 1.0 | 12112 (HRC-I) | 464.8 | |||||
| 1.1 | 12113 (HRC-I) | 473.7 | |||||
| 0.5 | 12114 (HRC-I) | 483.3 | |||||
| 1.2 | 0650560201 (EPIC) | 487.5 | |||||
| 0650560301 (EPIC) | 496.9 | ||||||
| 0650560401 (EPIC) | 507.1 | ||||||
| 0650560501 (EPIC) | 517.4 | ||||||
| 1.6 | 0650560601 (EPIC) | 527.1 | |||||
| 0.8 | 13178 (HRC-I) | 540.2 | |||||
| 0.7 | 13179 (HRC-I) | 550.4 | |||||
| 1.0 | 13180 (HRC-I) | 561.2 | |||||
| mrg5 (HRC-I) | 808.2 | ||||||
| mrg5 (EPIC) | 854.1 | ||||||
| 2010-01d | 00:42:42.81 | 55211.52 | mrg4 (HRC-I) | 302.6 | |||
| +41:16:14.7 | 0.7 | 13227 (HRC-I) | 665.6 | ||||
| 0.3 | 13228 (HRC-I) | 674.7 | |||||
| 13229 (HRC-I) | 684.5 | ||||||
| 13230 (HRC-I) | 695.0 | ||||||
| 13231 (HRC-I) | 703.8 | ||||||
| 0.6 | 13278 (HRC-I) | 761.2 | |||||
| 0.5 | 13279 (HRC-I) | 771.7 | |||||
| 0.5 | 13280 (HRC-I) | 787.7 | |||||
| 0.7 | 13281 (HRC-I) | 868.4 | |||||
| 2010-05a | 00:42:35.90 | 55344.04 | 0.4 | mrg4 (HRC-I) | 170.1 | ||
| +41:16:37.9 | mrg5 (HRC-I) | 533.1 | |||||
| 2010-09b | 00:43:45.53 | 55469.23 | 2.4 | 0650560201 (EPIC) | 87.2 | ||
| +41:07:54.7 | 1.7 | 0650560301 (EPIC) | 96.5 | ||||
| 2.6 | 0650560401 (EPIC) | 106.8 | |||||
| 3.5 | 0650560501 (EPIC) | 117.1 | |||||
| 4.1 | 0650560601 (EPIC) | 126.8 | |||||
| 0655620301 (EPIC) | 305.0 | ToO | |||||
| 2010-10e | 00:42:57.76 | 55499.7 | 12110 (HRC-I) | 14.5 | |||
| +41:08:12.3 | 12111 (HRC-I) | 23.5 | |||||
| 0.8 | 12112 (HRC-I) | 34.0 | |||||
| 2.7 | 12113 (HRC-I) | 42.9 | |||||
| 1.8 | 12114 (HRC-I) | 52.5 | |||||
| 1.1 | 0650560201 (EPIC) | 56.7 | |||||
| 1.1 | 0650560301 (EPIC) | 66.1 | |||||
| 1.0 | 0650560401 (EPIC) | 76.3 | |||||
| 0650560501 (EPIC) | 86.6 | ||||||
| 0650560601 (EPIC) | 96.3 | ||||||
| Optical nova candidate | X-ray measurements | ||||||
|---|---|---|---|---|---|---|---|
| Name | RA (h:m:s) | MJD | Observation | Comment | |||
| M31N | Dec (d:m:s) | (d) | (″) | ID | (d) | (10 erg s) | |
| 2010-10f | 00:42:43.58 | 55481.19 | 1.5 | 12110 (HRC-I) | 33.0 | GC | |
| +41:12:42.6 | 2.3 | 12111 (HRC-I) | 42.0 | ||||
| 1.6 | 12112 (HRC-I) | 52.5 | |||||
| 12113 (HRC-I) | 61.4 | ||||||
| 12114 (HRC-I) | 71.0 | ||||||
| 3.7 | 0650560201 (EPIC) | 75.2 | |||||
| 0650560301 (EPIC) | 84.6 | ||||||
| 0650560401 (EPIC) | 94.8 | ||||||
| 0650560501 (EPIC) | 105.1 | ||||||
| 0650560601 (EPIC) | 114.8 | ||||||
| 13178 (HRC-I) | 128.0 | ||||||
| 13179 (HRC-I) | 138.1 | ||||||
| 13180 (HRC-I) | 148.9 | ||||||
| 2010-12b | 00:42:31.08 | 55540.12 | 0650560201 (EPIC) | 16.3 | |||
| +41:27:20.3 | 1.8 | 0650560301 (EPIC) | 25.6 | ||||
| 4.3 | 0650560401 (EPIC) | 35.9 | |||||
| 0650560501 (EPIC) | 46.2 | ||||||
| 0650560601 (EPIC) | 55.9 | ||||||
| 13100 (HRC-I) | 69.0 | ||||||
| mrg5 (EPIC) | 382.9 | ||||||
| 2011-01a | 00:42:42.68 | 55568.39 | 0650560401 (EPIC) | 7.6 | |||
| +41:19:14.8 | 0650560501 (EPIC) | 17.9 | |||||
| 0650560601 (EPIC) | 27.6 | ||||||
| 13100 (HRC-I) | 40.8 | ||||||
| 0.6 | mrg5 (HRC-I) | 308.7 | |||||
| mrg5 (EPIC) | 354.7 | ||||||
| 2011-01b | 00:42:39.03 | 55577.52 | 0650560501 (EPIC) | 8.8 | |||
| +41:13:25.8 | 0650560601 (EPIC) | 18.5 | |||||
| 0.4 | 13178 (HRC-I) | 31.6 | |||||
| 0.2 | 13179 (HRC-I) | 41.7 | |||||
| 0.1 | 13180 (HRC-I) | 52.6 | |||||
| 2.2 | 0655620301 (EPIC) | 196.7 | ToO | ||||
| mrg5 (HRC-I) | 299.6 | ||||||
| mrg5 (EPIC) | 345.5 | ||||||
| 2011-02b | 00:42:42.96 | 55615.78 | 13178 (HRC-I) | -6.6 | |||
| +41:15:10.4 | 0.4 | 13179 (HRC-I) | 3.5 | ||||
| 0.4 | 13180 (HRC-I) | 14.3 | |||||
| mrg5 (HRC-I) | 261.3 | ||||||
| mrg5 (EPIC) | 307.3 | ||||||
| 2011-10d | 00:42:55.74 | 55853.72 | 13227 (HRC-I) | 23.4 | |||
| +41:17:52.5 | 13228 (HRC-I) | 32.5 | |||||
| 13229 (HRC-I) | 42.3 | ||||||
| 0.2 | 13230 (HRC-I) | 52.8 | |||||
| 0.2 | 13231 (HRC-I) | 61.6 | |||||
| 0.5 | 0674210201 (EPIC) | 69.3 | |||||
| 2.7 | 0674210301 (EPIC) | 79.4 | |||||
| 1.0 | 0674210401 (EPIC) | 87.9 | |||||
| 0.4 | 0674210501 (EPIC) | 93.8 | |||||
| 0.9 | 0674210601 (EPIC) | 103.4 | |||||
| 13278 (HRC-I) | 119.0 | ||||||
| 0.8 | 13279 (HRC-I) | 129.5 | |||||
| 13280 (HRC-I) | 145.5 | ||||||
| 13281 (HRC-I) | 226.2 | ||||||
| Optical nova candidate | X-ray measurements | ||||||
|---|---|---|---|---|---|---|---|
| Name | RA (h:m:s) | MJD | Observation | Comment | |||
| M31N | Dec (d:m:s) | (d) | (″) | ID | (d) | (10 erg s) | |
| 2011-11e | 00:42:38.31 | 55884.7 | 13228 (HRC-I) | 1.5 | |||
| +41:16:31.3 | 13229 (HRC-I) | 11.3 | |||||
| 13230 (HRC-I) | 21.9 | ||||||
| 13231 (HRC-I) | 30.6 | ||||||
| 0674210201 (EPIC) | 38.3 | ||||||
| 0674210301 (EPIC) | 48.4 | ||||||
| 0674210401 (EPIC) | 56.9 | ||||||
| 0674210501 (EPIC) | 62.8 | ||||||
| 0674210601 (EPIC) | 72.4 | ||||||
| 0.5 | 13278 (HRC-I) | 88.1 | |||||
| 0.5 | 13279 (HRC-I) | 98.6 | |||||
| 0.5 | 13280 (HRC-I) | 114.5 | |||||
| 13281 (HRC-I) | 195.2 | ||||||
Notes: As for Table 2. The entries mrg1 and mrg2 refer to the merged data of the 2007/8 and 2008/9 campaigns presented in Paper II (same abbreviations there). ObsID 13100 indicates the HRC-I observations 13178, 13179 and 13180 merged. The comment GC refers to the nova in the globular cluster Bol 126 (Henze et al. 2013).
| Optical nova candidate | X-ray measurements | |||||
| Name | RA (h:m:s) | MJD | Observation | Comment | ||
| M31N | Dec (d:m:s) | (d) | ID | (d) | (10 erg s) | |
| 1997-11a | 00:42:42.13 | 50753.05 | mrg3 (HRC-I) | 4389.2 | ||
| +41:15:10.4 | ||||||
| 2008-05a | 00:42:56.84 | 54600.79 | mrg3 (HRC-I) | 541.4 | ||
| +41:11:52.4 | mrg3 (EPIC) | 592.7 | ||||
| 2008-06a | 00:42:37.72 | 54631.46 | mrg3 (HRC-I) | 510.8 | ||
| +41:12:30.0 | mrg3 (EPIC) | 562.1 | ||||
Notes: As for Table 2.
| Optical nova candidate | X-ray measurements | |||||
| Name | RA (h:m:s) | MJD | Observation | Comment | ||
| M31N | Dec (d:m:s) | (d) | ID | (d) | (10 erg s) | |
| 2008-10b | 00:43:02.42 | 54745.11 | mrg3 (HRC-I) | 397.1 | ||
| +41:14:09.9 | mrg3 (EPIC) | 448.4 | ||||
| 2008-10c | 00:42:48.50 | 54759.02 | mrg3 (HRC-I) | 383.2 | ||
| +41:13:49.8 | mrg3 (EPIC) | 434.5 | ||||
| 2008-11d | 00:42:57.30 | 54794.88 | mrg3 (HRC-I) | 347.4 | ||
| +41:15:41.1 | mrg3 (EPIC) | 398.6 | ||||
| 2008-12b | 00:43:04.85 | 54829.71 | mrg3 (HRC-I) | 312.5 | ||
| +41:17:51.6 | mrg3 (EPIC) | 363.8 | near bright source | |||
| 2009-02b | 00:42:27.77 | 54882.13 | mrg3 (HRC-I) | 260.1 | ||
| +41:13:42.4 | mrg3 (EPIC) | 311.4 | ||||
| 2009-08a | 00:42:58.06 | 54989.95 | mrg3 (HRC-I) | 152.3 | ||
| +41:17:29.8 | mrg3 (EPIC) | 203.6 | ||||
| 2009-06c | 00:42:33.92 | 55003.02 | mrg3 (HRC-I) | 139.2 | ||
| +41:15:52.9 | mrg3 (EPIC) | 190.5 | ||||
| 2009-06b | 00:42:10.37 | 55012.05 | mrg3 (HRC-I) | 130.2 | off-axis | |
| +41:12:19.8 | mrg3 (EPIC) | 181.5 | ||||
| 2009-09a | 00:42:26.08 | 55072.99 | mrg3 (HRC-I) | 69.2 | off-axis | |
| +41:04:01.0 | mrg3 (EPIC) | 120.5 | ||||
| 2009-10c | 00:42:45.76 | 55113.08 | mrg3 (HRC-I) | 29.1 | ||
| +41:15:57.1 | mrg3 (EPIC) | 80.4 | near M 31 centre | |||
| 2009-10b | 00:42:20.77 | 55113.99 | mrg3 (HRC-I) | 28.2 | ||
| +41:16:44.5 | mrg3 (EPIC) | 79.5 | ||||
| 2009-11b | 00:42:39.61 | 55135.13 | mrg3 (HRC-I) | 7.1 | off-axis | |
| +41:09:03.2 | mrg3 (EPIC) | 58.4 | ||||
| 2009-11c | 00:43:10.47 | 55141.36 | mrg3 (HRC-I) | 0.9 | off-axis | |
| +41:12:18.5 | mrg3 (EPIC) | 52.2 | ||||
| 2009-11e | 00:42:35.31 | 55153.67 | 10884 (HRC-I) | 9.0 | ||
| +41:12:59.1 | 10885 (HRC-I) | 20.3 | ||||
| 10886 (HRC-I) | 29.2 | |||||
| mrg3 (EPIC) | 39.9 | |||||
| 11808 (HRC-I) | 89.2 | |||||
| 11809 (HRC-I) | 99.6 | |||||
| 2010-01a | 00:42:56.74 | 55207.13 | 0600660401 (EPIC) | 4.4 | ||
| +41:17:21.0 | 0600660501 (EPIC) | 14.0 | ||||
| 0600660601 (EPIC) | 22.0 | |||||
| 11808 (HRC-I) | 35.7 | |||||
| 11809 (HRC-I) | 46.1 | |||||
| 2010-01d | 00:42:42.81 | 55211.52 | 11808 (HRC-I) | 31.3 | ||
| +41:16:14.7 | 11809 (HRC-I) | 41.8 | ||||
| 2010-01b | 00:43:00.07 | 55213.44 | 0600660501 (EPIC) | 7.7 | ||
| +41:25:16.9 | 0600660601 (EPIC) | 15.7 | ||||
| 11808 (HRC-I) | 29.4 | off-axis | ||||
| 11809 (HRC-I) | 39.8 | |||||
Notes: As for Table 2.
| Optical nova candidate | X-ray measurements | |||||
| Name | RA (h:m:s) | MJD | Observation | Comment | ||
| M31N | Dec (d:m:s) | (d) | ID | (d) | (10 erg s) | |
| 2009-10c | 00:42:45.76 | 55113.08 | mrg4 (HRC-I) | 401.1 | ||
| +41:15:57.1 | mrg4 (EPIC) | 443.4 | near M 31 centre | |||
| 2009-10b | 00:42:20.77 | 55113.99 | mrg4 (HRC-I) | 400.2 | ||
| +41:16:44.5 | mrg4 (EPIC) | 442.4 | ||||
| 2009-11b | 00:42:39.61 | 55135.13 | mrg4 (HRC-I) | 379.0 | off-axis | |
| +41:09:03.2 | mrg4 (EPIC) | 421.3 | ||||
| 2009-11c | 00:43:10.47 | 55141.36 | mrg4 (HRC-I) | 372.8 | off-axis | |
| +41:12:18.5 | mrg4 (EPIC) | 415.1 | ||||
| 2009-11e | 00:42:35.31 | 55153.67 | mrg4 (HRC-I) | 360.5 | ||
| +41:12:59.1 | mrg4 (EPIC) | 402.8 | ||||
| 2010-01a | 00:42:56.74 | 55207.13 | mrg4 (HRC-I) | 307.0 | ||
| +41:17:21.0 | mrg4 (EPIC) | 349.3 | ||||
| 2010-01b | 00:43:00.07 | 55213.44 | mrg4 (HRC-I) | 300.7 | off-axis | |
| +41:25:16.9 | mrg4 (EPIC) | 343.0 | ||||
| 2010-02a | 00:42:36.87 | 55254.75 | mrg4 (HRC-I) | 259.4 | ||
| +41:15:29.6 | mrg4 (EPIC) | 301.7 | ||||
| 2010-03a | 00:42:47.74 | 55256.75 | mrg4 (HRC-I) | 257.4 | ||
| +41:17:01.4 | mrg4 (EPIC) | 299.7 | ||||
| 2010-03b | 00:42:55.87 | 55264.75 | mrg4 (HRC-I) | 249.4 | ||
| +41:15:19.6 | mrg4 (EPIC) | 291.7 | ||||
| 2010-04a | 00:42:44.75 | 55316.32 | mrg4 (HRC-I) | 197.9 | ||
| +41:15:11.9 | mrg4 (EPIC) | 240.1 | near M 31 centre | |||
| 2010-07b | 00:43:07.48 | 55351.14 | mrg4 (HRC-I) | 163.0 | off-axis | |
| +41:17:58.7 | mrg4 (EPIC) | 205.3 | ||||
| 2010-06d | 00:42:55.61 | 55371.02 | mrg4 (HRC-I) | 143.1 | ||
| +41:19:26.0 | mrg4 (EPIC) | 185.4 | ||||
| 2010-06a | 00:43:07.56 | 55374.03 | mrg4 (HRC-I) | 140.1 | off-axis | |
| +41:19:49.0 | mrg4 (EPIC) | 182.4 | ||||
| 2010-07a | 00:43:20.11 | 55384.07 | mrg4 (HRC-I) | 130.1 | off-axis | |
| +41:21:23.7 | mrg4 (EPIC) | 172.4 | ||||
| 2010-10b | 00:42:41.51 | 55427.05 | mrg4 (HRC-I) | 87.1 | off-axis | |
| +41:03:27.3 | mrg4 (EPIC) | 129.4 | ||||
| 2010-10a | 00:42:45.84 | 55473.79 | mrg4 (HRC-I) | 40.4 | off-axis | |
| +41:24:22.2 | mrg4 (EPIC) | 82.6 | ||||
| 2010-10d | 00:42:36.91 | 55497.72 | mrg4 (HRC-I) | 16.4 | ||
| +41:19:29.6 | mrg4 (EPIC) | 58.7 | ||||
| 2010-11a | 00:42:31.61 | 55523.05 | 12111 (HRC-I) | 0.1 | ||
| +41:09:50.8 | 12112 (HRC-I) | 10.6 | ||||
| 12113 (HRC-I) | 19.5 | |||||
| 12114 (HRC-I) | 29.1 | |||||
| mrg4 (EPIC) | 33.4 | |||||
| 13178 (HRC-I) | 86.1 | |||||
| 13179 (HRC-I) | 96.2 | |||||
| 13180 (HRC-I) | 107.1 | |||||
| 2010-12c | 00:42:56.67 | 55545.09 | 12114 (HRC-I) | 7.1 | ||
| +41:17:21.2 | mrg4 (EPIC) | 11.3 | ||||
| 13178 (HRC-I) | 64.1 | |||||
| 13179 (HRC-I) | 74.2 | |||||
| 13180 (HRC-I) | 85.0 | |||||
| Optical nova candidate | X-ray measurements | |||||
| Name | RA (h:m:s) | MJD | Observation | Comment | ||
| M31N | Dec (d:m:s) | (d) | ID | (d) | (10 erg s) | |
| 2011-02a | 00:42:02.33 | 55607.13 | 13178 (HRC-I) | 2.0 | off-axis | |
| +41:29:15.6 | 13179 (HRC-I) | 12.1 | ||||
| 13180 (HRC-I) | 23.0 | |||||
| 2011-02c | 00:42:44.25 | 55615.78 | 13179 (HRC-I) | 3.5 | ||
| +41:16:49.3 | 13180 (HRC-I) | 14.3 | ||||
Notes: As for Table 2.
| Optical nova candidate | X-ray measurements | |||||
| Name | RA (h:m:s) | MJD | Observation | Comment | ||
| M31N | Dec (d:m:s) | (d) | ID | (d) | (10 erg s) | |
| 2010-10a | 00:42:45.84 | 55473.79 | mrg5 (HRC-I) | 403.3 | off-axis | |
| +41:24:22.2 | mrg5 (EPIC) | 449.3 | ||||
| 2010-10f | 00:42:43.58 | 55481.19 | mrg5 (HRC-I) | 395.9 | ||
| +41:12:42.6 | mrg5 (EPIC) | 441.9 | ||||
| 2010-10d | 00:42:36.91 | 55497.72 | mrg5 (HRC-I) | 379.4 | ||
| +41:19:29.6 | mrg5 (EPIC) | 425.3 | ||||
| 2010-10e | 00:42:57.76 | 55499.7 | mrg5 (HRC-I) | 377.4 | off-axis | |
| +41:08:12.3 | mrg5 (EPIC) | 423.3 | ||||
| 2010-11a | 00:42:31.61 | 55523.05 | mrg5 (HRC-I) | 354.1 | off-axis | |
| +41:09:50.8 | mrg5 (EPIC) | 400.0 | ||||
| 2010-12b | 00:42:31.08 | 55540.12 | 13100 (HRC-I) | 69.0 | off-axis | |
| +41:27:20.3 | mrg5 (EPIC) | 382.9 | ||||
| 2010-12c | 00:42:56.67 | 55545.09 | mrg5 (HRC-I) | 332.0 | ||
| +41:17:21.2 | mrg5 (EPIC) | 378.0 | ||||
| 2011-01b | 00:42:39.03 | 55577.52 | mrg5 (HRC-I) | 299.6 | ||
| +41:13:25.8 | mrg5 (EPIC) | 345.5 | ||||
| 2011-02b | 00:42:42.96 | 55615.78 | mrg5 (HRC-I) | 261.3 | ||
| +41:15:10.4 | mrg5 (EPIC) | 307.3 | near M 31 centre | |||
| 2011-02c | 00:42:44.25 | 55615.78 | mrg5 (HRC-I) | 261.3 | ||
| +41:16:49.3 | mrg5 (EPIC) | 307.3 | near M 31 centre | |||
| 2011-02d | 00:44:07.02 | 55618.56 | mrg5 (HRC-I) | 258.5 | off-axis | |
| +41:17:10.8 | outside EPIC fov | |||||
| 2011-06b | 00:42:02.69 | 55709.44 | mrg5 (HRC-I) | 167.7 | off-axis | |
| +41:02:54.2 | outside EPIC fov | |||||
| 2011-05a | 00:42:43.53 | 55711.03 | mrg5 (HRC-I) | 166.1 | ||
| +41:16:37.3 | mrg5 (EPIC) | 212.0 | near M 31 centre | |||
| 2011-06c | 00:42:24.14 | 55718.54 | mrg5 (HRC-I) | 158.6 | off-axis | |
| +41:11:54.8 | mrg5 (EPIC) | 204.5 | ||||
| 2011-06d | 00:43:06.85 | 55742.03 | mrg5 (HRC-I) | 135.1 | ||
| +41:15:30.8 | mrg5 (EPIC) | 181.0 | ||||
| 2011-07a | 00:42:44.83 | 55764.69 | mrg5 (HRC-I) | 112.4 | ||
| +41:18:00.7 | mrg5 (EPIC) | 158.4 | ||||
| 2011-07b | 00:41:41.12 | 55770.07 | mrg5 (HRC-I) | 107.0 | off-axis | |
| +41:20:11.7 | mrg5 (EPIC) | 153.0 | ||||
| 2011-09b | 00:42:21.71 | 55816.88 | mrg5 (HRC-I) | 60.2 | off-axis | |
| +41:12:33.7 | mrg5 (EPIC) | 106.2 | ||||
| 2011-10a | 00:42:57.14 | 55835.66 | mrg5 (HRC-I) | 41.4 | ||
| +41:17:10.8 | mrg5 (EPIC) | 87.4 | ||||
| 2011-10g | 00:42:38.76 | 55839.83 | mrg5 (HRC-I) | 37.3 | off-axis | |
| +41:10:45.3 | mrg5 (EPIC) | 83.2 | ||||
| 2011-11a | 00:42:10.07 | 55876.59 | mrg5 (HRC-I) | 0.5 | off-axis | |
| +41:05:13.8 | mrg5 (EPIC) | 46.5 | ||||
Notes: As for Table 2.
| Optical nova candidate | X-ray measurements | |||||
| Name | RA (h:m:s) | MJD | Observation | Comment | ||
| M31N | Dec (d:m:s) | (d) | ID | (d) | (10 erg s) | |
| 2011-11c | 00:41:58.24 | 55877.73 | 13228 (HRC-I) | 8.5 | off-axis | |
| +41:24:01.1 | 13229 (HRC-I) | 18.2 | ||||
| 13230 (HRC-I) | 28.8 | |||||
| 13231 (HRC-I) | 37.6 | |||||
| mrg5 (EPIC) | 45.3 | |||||
| 13278 (HRC-I) | 95.0 | |||||
| 13279 (HRC-I) | 105.5 | |||||
| 13280 (HRC-I) | 121.5 | |||||
| 13281 (HRC-I) | 202.2 | |||||
| 2011-12b | 00:43:55.84 | 55919.13 | mrg5 (EPIC) | 3.9 | ||
| +41:21:26.6 | 13278 (HRC-I) | 53.6 | off-axis | |||
| 13279 (HRC-I) | 64.1 | |||||
| 13280 (HRC-I) | 80.1 | |||||
| 13281 (HRC-I) | 160.8 | |||||
| 2012-01a | 00:41:41.00 | 55930.84 | 0674210401 (EPIC) | 10.8 | ||
| +41:19:43.8 | 0674210601 (EPIC) | 26.3 | ||||
| 13278 (HRC-I) | 41.9 | off-axis | ||||
| 13279 (HRC-I) | 52.4 | |||||
| 13280 (HRC-I) | 68.4 | |||||
| 13281 (HRC-I) | 149.1 | |||||
| 2012-01b | 00:42:38.04 | 55947.42 | 0674210501 (EPIC) | 0.1 | ||
| +41:08:41.7 | 0674210601 (EPIC) | 9.7 | ||||
| 13278 (HRC-I) | 25.3 | |||||
| 13279 (HRC-I) | 35.8 | |||||
| 13280 (HRC-I) | 51.8 | |||||
| 13281 (HRC-I) | 132.5 | |||||
| 2012-02c | 00:43:24.07 | 55975.81 | 13279 (HRC-I) | 7.4 | ||
| +41:19:23.7 | 13280 (HRC-I) | 23.4 | ||||
| 13281 (HRC-I) | 104.1 | |||||
| 2012-03a | 00:43:34.19 | 55995.43 | 13280 (HRC-I) | 3.8 | off-axis | |
| +41:25:07.3 | 13281 (HRC-I) | 84.5 | ||||
| 2012-03b | 00:42:27.73 | 56002.76 | 13281 (HRC-I) | 77.1 | ||
| +41:08:13.6 | ||||||
| 2012-03c | 00:42:22.92 | 56003.77 | 13281 (HRC-I) | 76.1 | off-axis | |
| +41:04:16.5 | ||||||
| 2012-05a | 00:42:59.27 | 56051.8 | 13281 (HRC-I) | 28.1 | ||
| +41:18:14.6 | ||||||
| 2012-05b | 00:42:32.72 | 56052.08 | 13281 (HRC-I) | 27.8 | ||
| +41:15:37.8 | ||||||
| 2012-05c | 00:42:31.49 | 56052.06 | 13281 (HRC-I) | 27.8 | off-axis | |
| +41:26:13.8 | ||||||
Notes: As for Table 2.
| Position (J2000.) | ID | Comment |
|---|---|---|
| 00:43:18.90 +41:20:17.9 | 1194 | strongly variable (Paper II) |
| 00:43:18.72 +41:18:07.0 | (*)875 | only found in 2010/11 |
| 00:42:52.49 +41:15:40.7 | 1061 | bright SSS with period |
| 00:42:18.48 +41:26:46.2 | 857 | faint, nearby neighbour |
| 00:42:47.16 +41:14:13.5 | 1025 | faint, SSS in merge 2011/12 |
| Optical measurements | X-ray measurements | Derived parameters | References | ||||||||||
| Name | Outburst | Brightness | Old/ | Type | Turn-on | Turn-off | SSS/ | Ejected mass | Burned mass | o(ptical) | |||
| M31N | (JD) | (mag Filter) | (d) | Young | (km s) | (d) | (d) | date | (eV) | ( ) | ( ) | and x(-ray) | |
| 1982-09b | 45224.51 | 16.7(H) | O | 2874 | 10.92 | o1;x1 | |||||||
| 1990-09a | 48151.44 | 15.7(H) | Y | ROSAT | o2,3;x2,1 | ||||||||
| 1990-09g | 48161.00 | 18.4(H) | O | o3;x1 | |||||||||
| 1990-12a | 48235.00 | 16.0(H) | O | o3;x1,3 | |||||||||
| 1991-01b | 48280.00 | 16.4(H) | Y | o3;x1 | |||||||||
| 1992-11b | 48935.08 | 16.4(H) | O | Fe II | 870 | o3,4;x1 | |||||||
| 1994-09a | 49622.00 | 17.6(R) | O | HR | o5;x1 | ||||||||
| 1995-09b | 49963.00 | 15.6(H) | O | HR1 | o6;x1 | ||||||||
| 1995-11c | 50047.84 | 16.3(H) | O | HR | o3,7;x1 | ||||||||
| 1996-08b | 50307.00 | 16.1(H) | O | 4085 | o3;x1 | ||||||||
| 1997-06c | 50617.00 | 15.6(H) | O | o3,6;x1 | |||||||||
| 1997-08b | 50661.00 | 16.5(H) | Y | HR | o3,6;x1 | ||||||||
| 1997-09a | 50718.00 | 16.6(B) | 10.0 | Y | o8;x1 | ||||||||
| 1997-10c | 50723.01 | 16.6(B) | 7.9 | O | 997 | 7.8 | o8;x4 | ||||||
| 1997-11a | 50753.05 | 18.0(R) | O | HR1 | o3;x5 | ||||||||
| 1998-06a | 50970.00 | 16.2(H) | O | HR | o6;x1 | ||||||||
| 1998-07d | 51019.00 | 15.9(H) | O | o6;x1 | |||||||||
| 1999-08d | 51400.11 | 18.3(i’) | 87.2 | Y | o9,10;x6 | ||||||||
| 1999-10a | 51454.20 | 17.5(W) | O | Fe II | 965 | 1751 | o11,4;x5 | ||||||
| 2000-07a | 51752.50 | 16.8(R) | 22.4 | O | 900 | o9,10;x1 | |||||||
| 2000-08a | 51719.12 | 18.6(R) | O | HR1 | o12;x1 | ||||||||
| 2001-01a | 51928.82 | 17.1(R) | O | 1989 | HR | 9.71 | o13;x7 | ||||||
| 2001-07a | 52094.06 | 18.7(R) | Y | o13;x1 | |||||||||
| 2001-08d | 52150.10 | 16.7(R) | 11.8 | O | HR | o13;x1 | |||||||
| 2001-10a | 52185.91 | 17.0(R) | 39.3 | O | Fe II | 770 | 2200 | o10,14;x5 | |||||
| Optical measurements | X-ray measurements | Derived parameters | References | ||||||||||
| Name | Outburst | Brightness | Old/ | Type | Turn-on | Turn-off | SSS?/ | Ejected mass | Burned mass | o(ptical) | |||
| M31N | (MJD) | (mag Filter) | (d) | Young | (km s) | (d) | (d) | date | (eV) | ( ) | ( ) | and x(-ray) | |
| 2001-10b | 52190.98 | 15.6(i’) | 15.8 | Y | o9,10;x6 | ||||||||
| 2001-10f | 52195.76 | 16.6(B) | 12.0 | Y | 86 | o15,16;x1,5 | |||||||
| 2001-11a | 52225.71 | 17.1(B) | 8.0 | Y | 53 | 53 | 3.07 | o17,16;x8,9 | |||||
| 2002-01b | 52281.81 | 16.8(R) | 8.0 | O | He/N | 1715 | o18,19;x1 | ||||||
| 2002-08b | 52512.06 | 18.8(R) | O | o20;x10 | |||||||||
| 2003-08c | 52878.00 | 17.9(R) | O | 450 | o21,22;x11 | ||||||||
| 2003-11a | 52947.97 | 16.9(R) | 22.0 | O | HR1 | o23,13;x5 | |||||||
| 2003-11b | 52972.87 | 17.4(R) | 42.2 | O | o13;x5 | ||||||||
| 2004-01b | 53005.74 | 18.4(R) | O | 2400 | o13;x10 | ||||||||
| 2004-05b | 53143.06 | 17.2(R) | 49.7 | O | 975 | o24,12;x5,7 | |||||||
| 2004-06a | 53164.04 | 17.2(R) | 19.7 | O | 132 | o24,12;x5 | |||||||
| 2004-06c | 53181.02 | 17.1(R) | 10.9 | O | HR1 | o24,12;x5 | |||||||
| 2004-08a | 53219.97 | 17.4(R) | O | 64 | o24,12;x5 | ||||||||
| 2004-08c | 53239.04 | 18.7(R) | 50.3 | O | HR1 | o13;x5 | |||||||
| 2004-11f | 53311.32 | 17.9(R) | 28.4 | O | HR1 | o13;x5 | |||||||
| 2004-11b | 53314.85 | 16.6(R) | 47.0 | O | He/N | 1310 | o4;x5 | ||||||
| 2004-11g | 53314.85 | 18.0(R) | 28.4 | O | HR1 | o24;x5 | |||||||
| 2004-11e | 53338.80 | 17.6(R) | 34.6 | Y | o24,12;x5 | ||||||||
| 2005-01b | 53389.08 | 16.3(W) | Y | 535 | o25;x4 | ||||||||
| 2005-01c | 53399.09 | 16.1(W) | Y | 703 | o25;x4 | ||||||||
| 2005-02a | 53419.77 | 17.7(W) | O | 508 | o26;x7 | ||||||||
| 2005-09b | 53614.23 | 16.5(W) | Y | Fe II | 2200 | 300 | o4,27;x12,4 | ||||||
| 2006-04a | 53851.27 | 15.9(R) | 16.0 | O | 105 | o28,29;x7 | |||||||
| 2006-06a | 53877.10 | 17.6(R) | O | Fe II | 850 | HR1 | o30,27;x7 | ||||||
| 2006-06b | 53869.07 | 18.5(R) | O | 1345 | o31,12;x11 | ||||||||
| Optical measurements | X-ray measurements | Derived parameters | References | ||||||||||
| Name | Outburst | Brightness | Old/ | Type | Turn-on | Turn-off | SSS/ | Ejected mass | Burned mass | o(ptical) | |||
| M31N | (MJD) | (mag Filter) | (d) | Young | (km s) | (d) | (d) | date | (eV) | ( ) | ( ) | and x(-ray) | |
| 2006-09c | 53996.14 | 17.0(R) | 23.0 | Y | Fe II | 960 | 477 | o32,33;x11 | |||||
| 2006-11a | 54063.67 | 16.0(R) | 29.0 | Y | Fe II | 560 | 188 | o34,4;x13,14 | |||||
| 2007-02b | 54134.80 | 16.7(R) | 34.0 | Y | Fe II | 955 | 722 | o35,36;x11,10 | |||||
| 2007-06b | 54269.90 | 17.3(W) | 18.0 | G | He/N | 1435 | 218 | o37,4;x15,11 | |||||
| 2007-10b | 54386.25 | 17.8(R) | 3.0 | Y | He/N | 1450 | 77 | o38,39;x11 | |||||
| 2007-11a | 54406.28 | 16.7(R) | 4.0 | O | HR2 | o40;x16,11 | |||||||
| 2007-12b | 54443.53 | 17.0(R) | 5.0 | Y | He/N | 2040 | 49 | o41,42;x17,11 | |||||
| 2007-12d | 54451.57 | 17.2(R) | 4.0 | O | He/N | 2490 | 22 | o43,44;x11 | |||||
| 2008-05a | 54600.79 | 16.4(R) | 25.0 | O | 262 | o45,12;x11 | |||||||
| 2008-05b | 54608.76 | 16.0(W) | O | o45,12;x11 | |||||||||
| 2008-05d | 54614.04 | 17.3(R) | Y | 1247 | o46;x18 | ||||||||
| 2008-06a | 54631.46 | 17.7(R) | O | o47;x11 | |||||||||
| 2009-05a | 54968.07 | 17.1(R) | 96.0 | O | o12,48;x10 | ||||||||
| 2009-05b | 54968.07 | 18.3(R) | 62.0 | O | 243 | o12,48;x10 | |||||||
| 2009-08c | 55055.42 | 17.2(R) | 23.0 | O | o12,49;x10 | ||||||||
| 2009-08d | 55055.42 | 16.6(R) | 36.0 | O | Fe II | 650 | o12,50;x10 | ||||||
| 2009-08e | 55068.90 | 16.6(R) | 121.0 | O | Fe II | 615 | 507 | o12,50;x10 | |||||
| 2010-01d | 55211.52 | 16.7(R) | 136.0 | O | o51,52;x10 | ||||||||
| 2010-05a | 55344.04 | 17.1(R) | 46.0 | O | Fe II | o53,54;x10 | |||||||
| 2010-09b | 55469.23 | 16.4(R) | 10.0 | Y | Fe II | 1800 | 107 | o56,57;x10 | |||||
| 2010-10e | 55499.70 | 17.8(R) | 3.0 | Y | He/N | 4050 | 66 | o59,60;x19,10 | |||||
| 2010-10f | 55480.32 | 15.6(R) | 4.6 | G | 95 | o62;x20 | |||||||
| Optical measurements | X-ray measurements | Derived parameters | References | ||||||||||
| Name | Outburst | Brightness | Old/ | Type | Turn-on | Turn-off | SSS/ | Ejected mass | Burned mass | o(ptical) | |||
| M31N | (MJD) | (mag Filter) | (d) | Young | (km s) | (d) | (d) | date | (eV) | ( ) | ( ) | and x(-ray) | |
| 2010-12b | 55540.12 | 15.7(R) | 3.0 | Y | 26 | o63,64;x10 | |||||||
| 2011-01a | 55568.39 | 14.9(R) | 10.0 | O | Fe II | 650 | o65,66;x10 | ||||||
| 2011-01b | 55577.52 | 16.4(R) | 3.0 | O | 197 | o68;x21,10 | |||||||
| 2011-02b | 55615.78 | 17.7(R) | O | o68,34;x10 | |||||||||
| 2011-10d | 55853.72 | 16.5(R) | 22.0 | O | Fe II | 1650 | 86 | o69,70;x10 | |||||
| 2011-11e | 55884.70 | 16.1(R) | 40.0 | O | Fe II | 250 | o68,72;x10 | ||||||
| 2012-05c | 56052.06 | 17.4(R) | Y | 96 | o68,73;x22,10 | ||||||||
Notes: : Modified Julian day of optical nova outburst; : maximum observed magnitude, “W” indicates unfiltered magnitude; : time in days the nova R magnitude needs to drop 2 mag below peak magnitude (see Payne-Gaposchkin 1964); : positional association with the old (bulge) and young (disk) stellar populations of M 31 (see Sect. 5.3) ; : spectral type of optical nova according to the classification scheme of Williams (1992); : outflow velocity of the ejected envelope as measured from optical spectra; : indicates if the source was classified as an SSS using XMM-Newton hardness ratios (HR), Chandra HRC-I/ACIS-I hardness ratios (HR1), Chandra HRC-I hardness ratios (HR2), a ROSAT observation (ROSAT, only M31N 1990-09a), or using X-ray spectra, in which case we give the time in days after outburst for which was determined (if multiple observations were used, this value is the mean of the associated days, if necessary weighted by flux); : maximum black body temperature as derived from spectral fits; : optical references: o1: Ciardullo et al. (1987), o2: Nedialkov et al. (2002), o3: Shafter & Irby (2001), o4: Shafter et al. (2011d), o5: Ansari et al. (2004), o6: Rector et al. (1999), o7: Henze et al. (2008b), o8: Sharov & Alksnis (1998), o9: Darnley et al. (2004), o10: Darnley et al. (2006), o11: Filippenko et al. (1999), o12: CBAT M 31 nova webpage (http://www.cfa.harvard.edu/iau/CBAT_M31.html), o13: MPE M 31 nova catalogue (http://www.mpe.mpg.de/m31novae/opt/m31/index.php), o14: Filippenko & Chornock (2001), o15: Smirnova & Alksnis (2006), o16: Alksnis et al. (2008), o17: Smirnova et al. (2006), o18: Fiaschi et al. (2002), o19: Filippenko & Chornock (2002), o20: Lee et al. (2012), o21: Fiaschi et al. (2003), o22: di Mille et al. (2003), o23: Hornoch (2003), o24: Pietsch et al. (2007d), o25: D. Bishops extragalactic nova webpage (http://www.rochesterastronomy.org/novae.html), o26: Dimai & Manzini (2005), o27: Pietsch et al. (2006a), o28: Pietsch et al. (2006b), o29: Baernbantner & Riffeser (2006), o30: Lang et al. (2006), o31: Ries & Riffeser (2006), o32: Quimby (2006), o33: Shafter et al. (2006), o34: K. Hornoch (priv. comm.), o35: Burwitz et al. (2013, in prep.), o36: Pietsch et al. (2007a), o37: Shafter & Quimby (2007), o38: Burwitz et al. (2007), o39: Rau et al. (2007), o40: Pietsch et al. (2007b), o41: Bode et al. (2009), o42: Shafter (2007b), o43: Henze et al. (2007), o44: Shafter (2007a), o45: Henze et al. (2008c), o46: Ovcharov et al. (2008), o47: Henze et al. (2008a), o48: Pietsch et al. (2009), o49: Henze et al. (2009a), o50: Di Mille et al. (2009), o51: Pietsch & Henze (2010), o52: Hornoch et al. (2010c), o53: Hornoch et al. (2010d), o54: Hornoch et al. (2010b), o55: Hornoch et al. (2010a), o56: Nishiyama et al. (2010), o57: Cao et al. (2012), o58: Shafter et al. (2010c), o59: Hornochova et al. (2010), o60: Pietsch et al. (2010b), o61: Shafter et al. (2010a), o62: Henze et al. (2013), o63: Pietsch et al. (2010c), o64: Sun & Gao (2010), o65: Nishiyama & Kabashima (2011), o66: Henze et al. (2011b), o67: Arai (2011), o68: CBAT ”Transient Objects Confirmation Page” (http://www.cbat.eps.harvard.edu/unconf/tocp.html), o69: Ovcharov et al. (2011), o70: Shafter et al. (2011a), o71: Barsukova et al. (2011), o72: Shafter et al. (2011c), o73: Hornoch et al. (2012); : X-ray references: x1: Pietsch et al. (2005a), x2: Nedialkov et al. (2002), x3: Pietsch et al. (2006c), x4: Stiele et al. (2010), x5: Pietsch et al. (2007d), x6: Nelson et al. (2008), x7: Henze et al. (2010b), x8: Trudolyubov et al. (2005), x9: Williams et al. (2006), x10: this work, x11: Henze et al. (2011d), x12: Orio & Nelson (2008), x13: Pietsch et al. (2007c), x14: Voss et al. (2008), x15: Henze et al. (2009c), x16: Henze et al. (2009d), x17: Pietsch et al. (2011), x18: Henze et al. (2012a), x19: Pietsch et al. (2010d), x20: Henze et al. (2013), x21: Henze et al. (2011c), x22: Henze et al. (2012b).