Universality and the QCD Anderson Transition
Abstract
We study the Anderson-type transition previously found in the spectrum of the QCD quark Dirac operator in the high temperature, quark-gluon plasma phase. Using finite size scaling for the unfolded level spacing distribution, we show that in the thermodynamic limit there is a genuine mobility edge, where the spectral statistics changes from Poisson to Wigner-Dyson statistics in a non-analytic way. We determine the correlation length critical exponent, , and find that it is compatible with that of the unitary Anderson model.
pacs:
12.38.Gc,72.15Rn,12.38.Mh,11.15.HaThe idea of Anderson localization is more than half a century old Anderson58 . Anderson localization consists in the spatial localization of the states of a system due to quantum interference effects, caused by the presence of disorder. Its simplest realization is provided by the Anderson tight-binding model that aims at describing electronic states in a “dirty” conductor, by mimicking the effect of impurities through a random on-site potential. In three dimensions, as soon as the random potential is switched on, localized states appear at the band edge. However, states remain extended around the band center, beyond a critical energy called the “mobility edge”. Increasing the amount of disorder, i.e., increasing the width of the distribution of the random potential, the mobility edge moves towards the band center, and above a certain critical disorder all the states become localized (see Refs. Lee:1985zzc ; Evers:2008zz ).
Originally proposed to explain the loss of zero temperature conductance as a result of disorder, localization was later found in a much wider range of physical systems. Anderson transitions have been demonstrated with electromagnetic and sound waves as well as cold atoms (see Ref. KMOS and references therein) and recently in strongly interacting matter in its high temperature quark-gluon plasma phase Kovacs:2012zq . The last item of the list is rather peculiar since in that case localization occurs on a vastly different length and energy scale from all previously known cases, namely on subnuclear rather than atomic scales.
In the microscopic description of strongly interacting matter provided by quantum chromodynamics (QCD), a central role is played by the Dirac operator. Its spectrum encodes important properties of quarks and hadrons. At low temperature, the lowest lying quark eigenmodes of the Dirac operator have long been known to be extended, and the corresponding spectrum to obey Wigner-Dyson statistics as predicted by random matrix theory (RMT) Verbaarschot:2000dy . This has been successfully exploited to study the low-energy properties of QCD Verbaarschot:2000dy . In contrast, in the high-temperature quark-gluon plasma phase no similar description of the low-lying quark modes was available until recently. It was first suggested by García-García and Osborn that the transition from the hadronic to the quark-gluon plasma phase might be an Anderson-type transition GarciaGarcia:2006gr . Using lattice QCD they qualitatively demonstrated that heating the system through the critical temperature makes the quark states more localized. However, at that time a detailed verification of an Anderson transition in QCD was not possible.
More recently, using lattice simulations at a fixed temperature well above the crossover temperature, , we explicitly verified the existence of an Anderson-type transition in the spectrum of the quark Dirac operator. We found that while the lowest part of the spectrum consists of localized states that obey Poisson statistics, higher up in the spectrum the states become delocalized and the level spacings are described by Wigner-Dyson random matrix statistics Kovacs:2012zq . The scaling of the mobility edge, separating localized and delocalized states, indicates that it survives in the continuum limit and it steeply increases with the temperature. Thus the temperature in QCD plays a role similar to the disorder strength in the Anderson model. We also demonstrated that in larger volumes the transition becomes sharper, suggesting that it is a real phase transition.
In this letter we present a finite size scaling study of the transition and show explicitly that it is a genuine second order phase transition. We also compute the correlation length critical exponent, , and find that it is compatible with that of the three-dimensional Anderson model in the unitary class, the class to which quarks in the fundamental representation of the SU(3) gauge group are also expected to belong. Our results suggest that the universality of the Anderson transition might be much more general than previously thought. So far, universality in the Anderson model had been checked for different distributions of the diagonal disorder (see e.g. nu_latest ) and for uncorrelated off-diagonal disorder offd_disorder . The model we consider here, lattice QCD, is very different from all previously considered cases. Here the disorder appears through the gauge fields in the hopping terms, while the on-site terms are identically zero. Moreover, the random fluctuations of the disorder at different locations are not independent. However, since the theory has a mass gap, correlations among them decay exponentially with the distance. It is also remarkable that in QCD the transition is not driven by the disorder strength but by the temperature. In lattice QCD the temperature is set by the extension of the system in Euclidean time, as , where is the temporal size. As the system is heated and becomes smaller, the lowest lying quark modes are squeezed not only in the temporal but also in the spatial directions. This results in the localization of the lowest quark modes, up to the mobility edge, which in turn is pushed to higher values as the system is further heated. For a possible physical explanation of this mechanism in terms of the antiperiodic temporal quark boundary condition and fluctuations of the Polyakov loop, see Ref. Bruckmann:2011cc .
More precisely, the model we consider here is lattice QCD at finite temperature, with 2+1 flavors of staggered quarks with the quark masses tuned to the physical and quark masses. Here QCD is discretized on a 3+1 dimensional hypercubic lattice with three spatial and one Euclidean temporal dimension with the temporal size setting the physical temperature of the system. For details of the particular action and parameters we use, see Refs. Aoki:2005vt and Kovacs:2012zq . The staggered Dirac operator is a simple lattice discretization of the continuum Dirac operator containing covariant derivatives with the SU(3) color gauge field. Technically the staggered Dirac operator is thus a large sparse matrix with all zeros in the diagonal (on-site terms) and non-zero elements only in the nearest neighbor hopping terms. Being a discretized covariant derivative, each hopping term depends on the SU(3) group valued gauge field attached to the given link (parallel transporter). The gauge links, in turn, are random variables generated with the full QCD path integral measure (see e.g. Ref. Montvay:1994cy ).
The spectrum of the staggered Dirac operator on a finite lattice is a discrete set of pairs of purely imaginary eigenvalues . Here and in the following, denotes the eigenvalues in lattice units. For our purposes it is enough to restrict to the positive part of the spectrum . At temperatures above , the lowest-lying eigenmodes of the Dirac operator are localized on the scale of the inverse temperature, while higher up in the spectrum they are delocalized. For the present study, we use a fixed temperature of , corresponding to temporal extension in lattice units, and lattice spacing . The temporal size of the system is thus fixed and we vary only its size in the three spatial dimensions, using linear extensions of (in lattice units). Our results are based on a rather high statistics for present day lattice QCD standards, consisting of 40k independent configurations on the smallest lattice; on the larger lattices the number of configurations was scaled down with the volume to have the same eigenvalue statistics.
A convenient way to investigate the transition from localized to delocalized modes is to study the local statistical properties of the spectrum, which are expected to show a change from Poisson to RMT behavior across an Anderson transition. In this respect, a possible quantity to consider is the so-called unfolded level spacing distribution (ULSD), which is known analytically for both kinds of statistics. Unfolding is a local rescaling of the eigenvalues to have unit spectral density throughout the spectrum. The ULSD gives the probability distribution of the difference between two consecutive eigenvalues of the Dirac operator normalized by the local average level spacing. In the thermodynamic limit, the critical point (mobility edge) in the spectrum, , separating localized and delocalized modes, is identified as the point where the local ULSD switches between Poisson and Wigner-Dyson statistics.
Any quantity extracted from the local ULSD, having different values for Poisson and RMT statistics, can be used to detect the transition, and to study the corresponding critical behavior, along the lines of Refs. HS ; SSSLS ; SP . Denoting by such a quantity, computed on a lattice of linear size , one expects for its thermodynamic limit the following behavior: for ; , and for . In a second-order phase transition such as the Anderson transition, the characteristic length of the system, , diverges at the critical point like . Close to and in large enough volumes, so that corrections to one-parameter scaling can be ignored, finite size scaling suggests that the dependence of on is of the form . As is analytic in for any finite , we must have , with analytic. This means that the data for different volumes, when plotted against the scaling variable , should collapse on a single scaling curve, .
The parameters and can be obtained by optimizing data collapse for a set of volumes in the following way. Expanding the scaling function in powers of ,
| (1) |
one can truncate the series to an order , high enough to give a good description of the scaling function in a range of width around . We can then fit the coefficients of the polynomial and the parameters and to the data on a set of volumes. The goodness of the fits measures how precisely data collapse occurs. For the fit we used the MINUIT library James:1975dr , and determined statistical errors by means of a jackknife analysis.
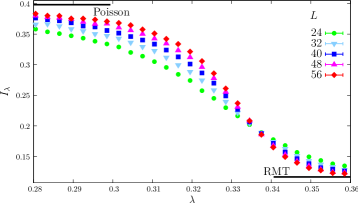
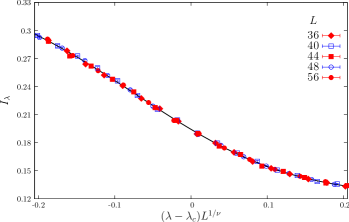
For our purposes, the best choice for turned out to be the integrated ULSD, defined locally in the spectrum, . Here was chosen in order to maximize the difference between the values predicted by Poisson and RMT statistics, namely and . In practice, was computed by dividing the full spectrum in bins of width , integrating the ULSD in each bin, and assigning the resulting value to the average value of in each bin. In Fig. 1 we show this quantity as a function of for several system sizes.
| 24 | 1.371(30) | 0.33637(13) | 0.19429(72) |
|---|---|---|---|
| 28 | 1.394(29) | 0.33633(16) | 0.19451(97) |
| 32 | 1.405(44) | 0.33626(18) | 0.1950(11) |
| 36 | 1.434(52) | 0.33637(24) | 0.1943(16) |
| 40 | 1.435(59) | 0.33604(35) | 0.1966(25) |
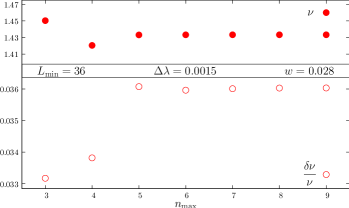
The quality of the fit reflects the goodness of the data collapse only if the truncation of Eq. (1) can provide a good description of the scaling function in the required range. To check this we included more and more terms in the series and monitored the stability of the results. In order to circumvent the numerical instability of polynomial fits of large order, we resorted to the technique of constrained fits Lepage:2001ym . The basic idea of constrained fits is to use the available information to constrain the values of the fitting parameters. In our case, they are needed only to avoid redundancy in the fitting parameters and the resulting instability of the fits. We did not impose any constraint on , and for . Our constraints on the higher order coefficients were also very loose. In Fig. 2 we plot the dependence of and its uncertainty on the order of the truncation used for the fits. Both the value and the error are absolutely stable for , and in fact even from changes are within the uncertainties. After stabilization, the resulting errors include both statistical effects and systematic effects due to truncation Lepage:2001ym . In the following we use .

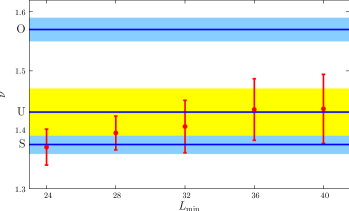
In the Anderson model irrelevant operators are known to cause significant finite size corrections to one-parameter scaling corrections . To see how important that is in the present model, we performed the fits by omitting the smallest volumes with system size . In Fig. 3 we show the fitted value of as a function of the smallest volume included in the fit (see also Table 1). Initially the resulting value of increases with but it stabilizes around . A fit involving the leading irrelevant operator and all the volumes, gives consistent results with this, indicating that finite volume corrections are under control. The fitting procedure we described above also yields values for the critical point, . As a function of , the fitted value of shows no systematic dependence, and different choices of give consistent values within the errors (see Table 1).
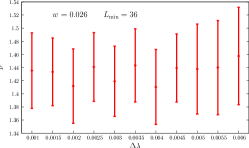
There are two more arbitrary choices that can in principle affect the results. These are the bin size, , over which the statistics for the ULSD is collected and the width of the fitting range, , around . We checked how these factors affect our results by varying the bin size and the width of the fitting range, which we always kept approximately centered at the critical point. We demonstrate both of these effects in Fig. 4. The results show a slight tendency of to decrease as is decreased, but it is rather stable for . There is also a slight tendency of to increase as is decreased, becoming rather stable for . To quote a single value for , we averaged the central values obtained for and . As the error is also rather stable within these ranges, its average gives a good estimate of the typical error, which we quote as the final error on for each choice of . We have checked that other prescriptions (e.g., extrapolating to vanishing and/or , or changing reasonably the ranges of and over which the final average is performed) give consistent results within the errors.
The fitting procedure described above also yields a polynomial parametrization of the scaling function in the fitting range. To illustrate this, in Fig. 5 we show the scaling function together with the data for the range of system sizes used for the fit. Indeed, data from different volumes collapse on a single scaling curve.
Our final result for the critical exponent, , is compatible with found earlier for the three-dimensional unitary Anderson model nu_unitary . This strongly suggests that the transition in the spectrum of the Dirac operator above is a true Anderson-type phase transition, belonging to the universality class of the corresponding three-dimensional Anderson model. Although its full physical implications are not clear yet, localization might explain the large hadron screening masses above and might have some implications for QCD-like theories that do have a finite temperature chiral/deconfining phase transition.
References
- (1) P. W. Anderson, Phys. Rev. 109, 1492 (1958).
- (2) P. A. Lee and T. V. Ramakrishnan, Rev. Mod. Phys. 57, 287 (1985).
- (3) F. Evers and A. D. Mirlin, Rev. Mod. Phys. 80, 1355 (2008).
- (4) B. Kramer, A. MacKinnon, T. Ohtsuki and K. Slevin, Int. J. Mod. Phys. B 24, 1841 (2010).
- (5) T. G. Kovács and F. Pittler, Phys. Rev. D 86, 114515 (2012).
- (6) J. J. M. Verbaarschot and T. Wettig, Ann. Rev. Nucl. Part. Sci. 50, 343 (2000).
- (7) A. M. García-García and J. C. Osborn, Phys. Rev. D 75, 034503 (2007).
- (8) K. Slevin and T. Ohtsuki, arXiv:1307.4483.
- (9) P. Biswas, P. Cain, R. A. Römer and M. Schreiber, Phys. Status Solidi B, 218, 205 (2000).
- (10) F. Bruckmann, T. G. Kovács and S. Schierenberg, Phys. Rev. D 84, 034505 (2011).
- (11) I. Montvay and G. Münster, “Quantum fields on a lattice,” Cambridge, UK: Univ. Pr. (1994).
- (12) Y. Aoki, Z. Fodor, S. D. Katz and K. K. Szabó, JHEP 0601, 089 (2006); S. Borsányi, G. Endrődi, Z. Fodor, A. Jakovác, S. D. Katz, S. Krieg, C. Ratti and K. K. Szabó, JHEP 1011, 077 (2010).
- (13) E. Hofstetter and M. Schreiber, Phys. Rev. B 49, 14726 (1994).
- (14) B. I. Shklovskii, B. Shapiro, B. R. Sears, P. Lambrianides and H. B. Shore, Phys. Rev. B 47, 11487 (1993).
- (15) F. Siringo and G. Piccitto, J. Phys. A 31, 5981 (1998).
- (16) F. James and M. Roos, Comput. Phys. Commun. 10, 343 (1975).
- (17) G. P. Lepage, B. Clark, C. T. H. Davies, K. Hornbostel, P. B. Mackenzie, C. Morningstar and H. Trottier, Nucl. Phys. Proc. Suppl. 106, 12 (2002).
- (18) K. Slevin and T. Ohtsuki, Phys. Rev. Lett. 82, 382 (1999).
- (19) K. Slevin and T. Ohtsuki, Phys. Rev. Lett. 78, 4083 (1997).
- (20) Y. Asada, K. Slevin and T. Ohtsuki, J. Phys. Soc. Jpn. 74 supplement, 238 (2005).