A reassessment of the redshift distribution and physical properties of luminous (sub-)millimetre galaxies
Abstract
Motivated by the current controversy over the redshift distribution and physical properties of luminous (sub-)mm sources, we have undertaken a new study of the brightest sample of unlensed (sub-)mm sources with pre-ALMA interferometric follow-up in the COSMOS field. Exploiting the very latest multi-frequency supporting data, we find that this sample displays a redshift distribution indistinguishable from that of the lensed sources uncovered with the South Pole Telescope (SPT), with . We also find that, over the redshift range the median stellar mass of the most luminous (sub-)mm sources is , yielding a typical specific star-formation rate . Consistent with recent ALMA and SMA studies, we confirm that source blending is not a serious issue in the study of luminous (sub-)mm sources uncovered by ground-based, single-dish surveys; only % of bright ( mJy) (sub-)mm sources arise from significant (i.e. %) blends, and so our conclusions are largely unaffected by whether we adopt the original single-dish mm/sub-mm flux-densities/positions, or the interferometric data. Our results suggest that apparent disagreements over the redshift distribution of (sub-)mm sources are a result of “down-sizing” in dust-enshrouded star-formation, consistent with existing knowledge of the star-formation histories of massive galaxies. They also indicate that extreme star-forming galaxies at high redshift are, on average, subject to the same star-formation rate-limiting processes as less luminous objects, and lie on the “main sequence” of star-forming galaxies at .
keywords:
galaxies: high-redshift, active, evolution, starburst, cosmology: observations, submillimetre: galaxies1 Introduction
Since their discovery 15 years ago in the first blank-field SCUBA surveys at the James Clerk Maxwell Telescope (JCMT), it has been known that sub-mm sources selected at high galactic latitudes are luminous dust-enshrouded star-forming galaxies, primarily located at high redshifts (; Hughes et al. 1998; Barger et al. 1998). Indeed, in a hint of things to come, it was quickly realised that the brightest sub-mm source uncovered in the first 850 m image of the Hubble Deep Field North, HDF850.1, was not visible in the ultra-deep Hubble Space Telescope (HST) optical imaging then available, and a number of follow-up studies suggested that it most likely lay at (Downes et al. 1999; Dunlop et al. 2004; Cowie et al. 2009). Recently, in an impressive demonstration of the ever-improving capabilities of mm/sub-mm spectroscopy, HDF850.1 has been revealed to lie at (Walter et al. 2012).
Despite the fairly extreme redshift of the first blank-field sub-mm source ever discovered, improved and expanded sub-mm/mm surveys over the last decade undertaken with SCUBA, LABOCA, AzTEC and MAMBO have generally yielded a consistent picture, whereby sources selected at mJy display a redshift distribution which peaks at , albeit with a significant lower-redshift tail down to , and a high-redshift tail extending up to . In general this information has been gleaned from either optical spectroscopic redshifts (e.g. Chapman et al. 2003, 2005) or from (more complete, but less accurate) optical-infrared photometric redshifts (e.g. Clements et al. 208; Dye et al. 2008; Chapin et al. 2009; Dunlop et al. 2010; Wardlow et al. 2011; Michałowski et al. 2012a) derived for the galaxy counterparts identified via the improved spatial information provided by radio and/or Spitzer observations of the (sub-)mm sources (e.g. Ivison et al. 2007; Biggs et al. 2011; Michałowski et al. 2012a; Yun et al. 2012). The determination of redshifts from optical spectroscopy is well known to be difficult in the “redshift desert” at (due to the the lack of emission lines accessible to silicon-based detectors) and even at higher redshifts success is by no means guaranteed for sub-mm galaxies, given the ease with which Lyman- emission can be extinguished by dust. Nevertheless, a sufficient number of spectroscopic redshifts have been measured to confirm the reliability of photometric redshift determination for sub-mm sources, and typically % of sub-mm sources in blank-field surveys can now be successfully associated with a galaxy counterpart (e.g. Ivison et al. 2007; Lindner et al. 2011; Michałowski et al. 2012a). Thus, despite the fact that radio and mid-infrared galaxy counterpart detection becomes increasingly difficult with increasing redshift (unlike sub-mm/mm detection), there appears to be limited room for a substantial extreme-redshift population in the typical sub-mm/mm galaxy samples studied to date. Indeed, the relatively modest disagreements between the redshift distributions of existing sub-mm galaxy samples can be attributed to cosmic variance (Michałowski et al. 2012a).
Now, however, a new generation of facilities is being utilised. First, Herschel and the South Pole Telescope (SPT) have now delivered sufficiently large far-infrared/mm maps to uncover examples of rare, very bright, generally lensed objects, for which follow-up molecular spectroscopy has proved feasible with ALMA and the latest generation of wide bandwidth redshift receivers on single-dish (sub-)mm telescopes. For example, pre-selection of red sources from Herschel data has yielded a new redshift record of for a sub-mm selected galaxy (Riechers et al. 2013), while ALMA follow-up of a bright sample of lensed sources uncovered with the SPT has yielded a redshift distribution which apparently peaks at (Vieira et al. 2013; Weiss et al. 2013). In parallel with these sub-mm/mm spectroscopic studies of bright lensed sources, ALMA has also recently been used to undertake a systematic imaging study of unlensed sources in the Chandra Deep Field South (Karim et al. 2013; Hodge et al. 2013), as originally uncovered in the LABOCA LESS survey (Weiss et al. 2009).
These new studies have produced results which some have regarded as casting doubt on our existing knowledge of the (sub-)mm source population. First, it has been claimed that the (apparently robustly established) redshift distribution of (sub-)mm sources has been biased low (Vieira et al. 2013), questioning the reliability of the aforementioned galaxy identification techniques based on the supporting radio-near/mid-infrared imaging. Second, it has been suggested that a substantial fraction of bright (sub-)mm sources in single-dish surveys arise from blends, raising additional concerns about the effectiveness of identification methods applied to large-beam sub-mm maps (Wang et al. 2011; Karim et al. 2013; Hodge et al. 2013).
The first of these claims might seem surprising, given the high completeness of galaxy identifications in previous blank-field surveys, and the robustness of photometric redshifts (consistently yielding ). Nevertheless, by the end of 2012, over ten sub-mm galaxies had already been spectroscopically confirmed at (Coppin et al. 2009; Capak et al. 2008, 2011; Schinnerer et al. 2008; Daddi et al. 2009a,b; Knudsen et al. 2009; Riechers et al. 2010; Cox et al. 2011; Smolcic et al. 2011; Combes et al. 2012; Walter et al. 2012), and it has been suggested by several authors that the most luminous sub-mm/mm galaxies appeared to lie at preferentially higher redshifts than their more moderate luminosity counterparts (e.g. Ivison et al. 2002; Wall, Pope & Scott 2008; Dunlop 2011; Michałowski et al. 2012a). The second claim, regarding prevalent source blending, seems equally surprising given that previous sub-mm/mm interferometry with the SMA and PdBI interferometers had suggested that serious multiplicity was not a big issue (e.g. Iono et al. 2006; Younger et al. 2007, 2008, 2009; Hatsukade et al. 2010).
Motivated by this controversy and confusion, and by the ever-improving multi-frequency dataset in the Cosmological Evolution Survey (COSMOS) field (including UltraVISTA: McCracken et al. 2012; Bowler et al. 2012), we have undertaken a fresh investigation of the properties of bright (but unlensed) sub-mm/mm galaxies as selected from the largest flux-limited sub-mm sample with pre-ALMA interferometric follow-up observations. Our sample consists of the 30 brightest sub-mm/mm sources in the COSMOS field which were originally uncovered with AzTEC and LABOCA, and which have subsequently been imaged with the Submillimeter Array (SMA) (Younger et al. 2007, 2009) and the Plateau de Bure Interferometer (PdBI) (Smolcic et al. 2012). Our aim was to combine the positional accuracy delivered by the sub-mm/mm interferometry, with the latest Subaru, UltraVISTA and Spitzer optical-infrared photometry to unambiguously establish the galaxy identifications, redshifts (), stellar masses () and specific star-formation rates () for a well-defined sample of bright sub-mm sources. At the same time we have taken the opportunity to revisit the issue of source multiplicity, and the robustness of galaxy identifications established using the statistical associations with radio/infrared sources which would have been deduced based on the original single-dish sub-mm/mm positions.
The remainder of this paper is structured as follows. In Section 2 we describe the published (sub-)mm samples in the COSMOS field with interferometric follow-up, and summarize the latest multi-frequency data that we have used to uncover and study the galaxies which produce the detected sub-mm/mm emission. Next, in Section 3, we describe the process of galaxy identification, and the extraction of robust optical-infared multi-wavelength photometry. Then, in Section 4 we present and discuss the derived properties of the galaxies, with special emphasis on the derived redshift distribution of bright (sub-)mm sources, and the stellar masses of the associated galaxies. In Section 5 we consider further our findings in the context of the latest Herschel/SPT/ALMA studies detailed above, and include a reassessement of how reliably galaxy counterparts can actually be established purely on the basis of the original single-dish sub-mm/mm maps (and hence to what extent higher-resolution sub-mm/mm imaging impacts on our understanding of the sub-mm galaxy population). Our conclusions are summarized in Section 6.
Throughout we use the AB magnitude system (Oke 1974), and assume a flat cosmology with and km s-1Mpc-1.
2 Data
The AzTEC/COSMOS survey covers 0.15 deg2 of the COSMOS field at 1.1 mm with an rms noise of 1.3 mJy beam-1 (Scott et al. 2008). The published AzTEC/COSMOS catalogue consists of 44 sources with . The brightest fifteen of these sources were then followed up with the SMA (Younger et al. 2007, 2009), effectively yielding a flux-limited sample of millimetre selected galaxies with refined positions. All fifteen of these sources were detected with the SMA, providing sub-millimetre positions accurate to arcsec (see Table 3). Two of the sources were split by the SMA into two distinct components; AzTEC11 was subdivided into north and south components and AzTEC14 into west and east. In the case of AzTEC11 however, as can be seen from figure 1 of Younger et al. (2009), the resolution of the SMA image is not high enough to clearly separate the components. For this reason we decided to continue to treat AzTEC11 as a single (albeit somewhat extended) galaxy for the purpose of this study.
The LABOCA/COSMOS survey covers the inner deg2 of the COSMOS field, delivering a sub-millimetre map at m with an rms noise level of 1.5 mJy beam-1 (Navarrete et al. in preparation). The 28 brightest 870 m sources were chosen for IRAM PdBI follow-up observations with the requirement that the signal-to-noise S/N (Smolcic et al. 2012). Most of these were detected with the IRAM interferometer. To create a well-defined and (near) flux-limited sample for the present study we selected the 16 objects with S/N. These are listed in Table 4. However, as described in the notes on individual sources in Appendix A, the PdBI position of COSLA-38 is so far from the original LABOCA position, and so close to the edge of the beam that it is hard to be confident it is the same source. For this reason we have excluded COSLA-38, and all further analysis is thus performed on a final sample of 30 (sub-)mm sources.
| filter | /nm | /nm | 5/AB mag | seeing/ |
|---|---|---|---|---|
| 381.1 | 65.2 | 26.9 | 0.80 | |
| 486.2 | 143.6 | 27.0 | 0.65 | |
| 625.8 | 121.7 | 26.6 | 0.65 | |
| 769.0 | 137.0 | 26.4 | 0.65 | |
| 903.7 | 85.6 | 26.3 | 1.15 | |
| 1020 | 100 | 24.7 | 0.82 | |
| 1250 | 180 | 24.5 | 0.79 | |
| 1650 | 300 | 24.0 | 0.76 | |
| 2150 | 300 | 23.8 | 0.75 |
| filter | /nm | /nm | 5/AB mag | seeing/ |
|---|---|---|---|---|
| 446.0 | 89.7 | 27.14 | 0.95 | |
| 548.4 | 94.6 | 26.75 | 1.33 | |
| 478.0 | 126.5 | 27.26 | 1.58 | |
| 764.1 | 149.7 | 26.08 | 0.95 | |
| 629.5 | 138.2 | 26.76 | 1.05 | |
| 903.7 | 85.6 | 26.00 | 1.15 |
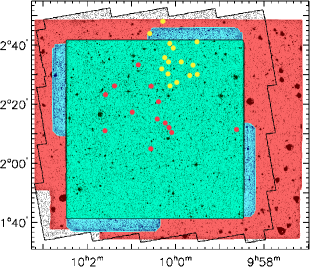
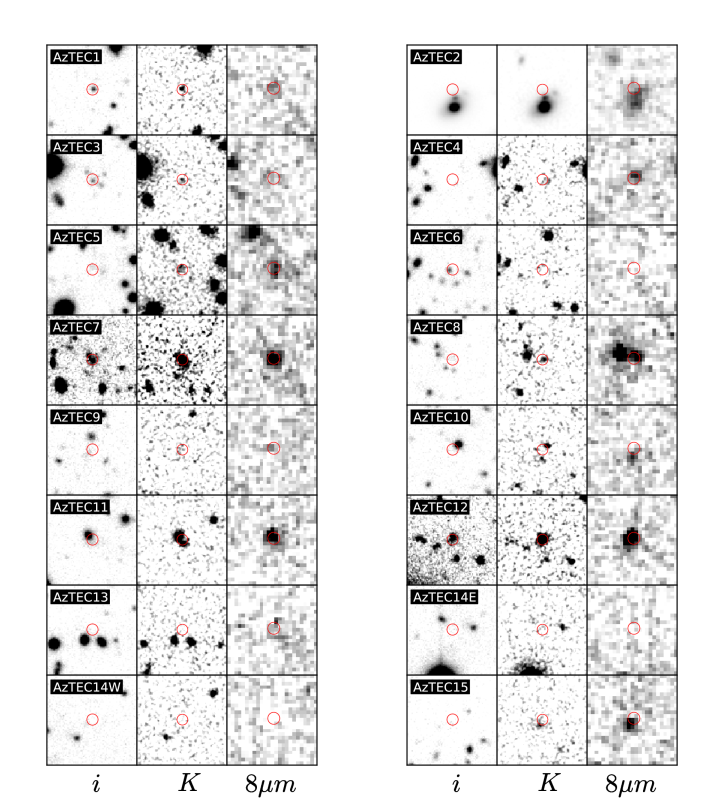
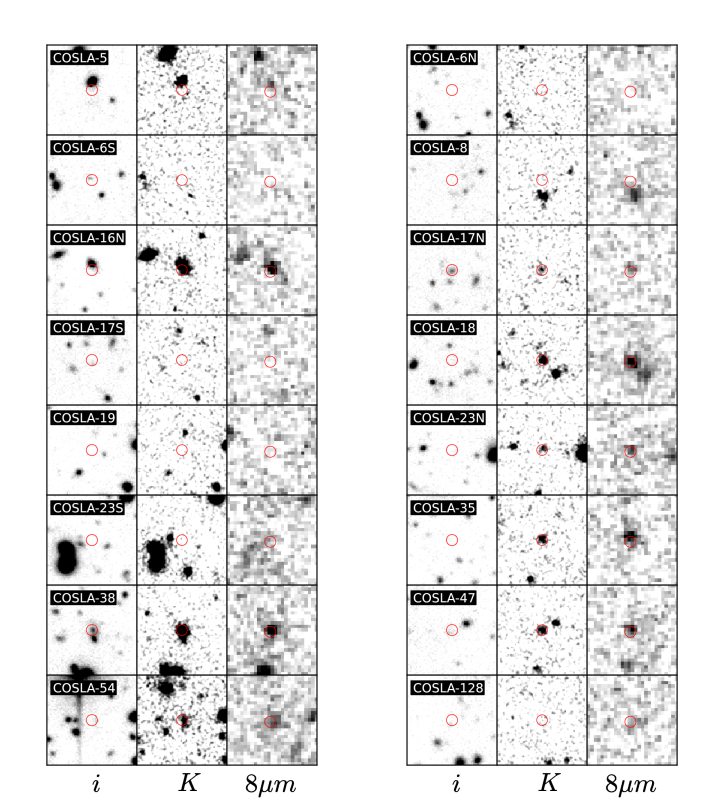
We used the refined positions provided by the SMA and PdBI interferometry to identify galaxy counterparts in the available multi-frequency imaging. The location of the AzTEC/SMA and LABOCA/PdBI sources within the key available multi-wavelength imaging in the COSMOS field is illustrated in Fig. 1. This imaging consists of the public IRAC imaging obtained via the S-COSMOS survey (Sanders et al. 2007), the new near-infrared imaging provided by UltraVISTA DR1 (McCracken et al. 2012), and optical imaging from the CFHT Legacy Survey (Gwyn et al. 2011), and Subaru (Taniguchi et al. 2007; Furusawa et al. in preparation). The details of this imaging are summarized in Table 1 and Table 2, with the latter table being relevant for AzTEC7 and AzTEC12 which lie just outside the deep CFHT MegaCam pointing (see Fig. 1), and thus required use of the (somewhat shallower) Subaru imaging available over the whole COSMOS field.
| SMA ID | SMA coords (J2000) | S/N | S/N | F | F |
|---|---|---|---|---|---|
| RADec | SMA | AzTEC | /mJy | /mJy | |
| AzTEC1 | |||||
| AzTEC2 | |||||
| AzTEC3 | |||||
| AzTEC4 | |||||
| AzTEC5 | |||||
| AzTEC6 | |||||
| AzTEC7 | |||||
| AzTEC8 | |||||
| AzTEC9 | |||||
| AzTEC10 | |||||
| AzTEC11 | |||||
| AzTEC12 | |||||
| AzTEC13 | |||||
| AzTEC14 | … … | … | … | ||
| AzTEC14.E | … | … | |||
| AzTEC14.W | … | … | |||
| AzTEC15 |
| PdBI ID | PdBI coords (J2000) | S/N | S/N | F1.3mm | F870μm |
|---|---|---|---|---|---|
| RADec | PdBI | LABOCA | /mJy | /mJy | |
| COSLA-5 | |||||
| COSLA-6N | |||||
| COSLA-6S | |||||
| COSLA-8 | |||||
| COSLA-16N | |||||
| COSLA-17N | |||||
| COSLA-17S | |||||
| COSLA-18 | |||||
| COSLA-19 | |||||
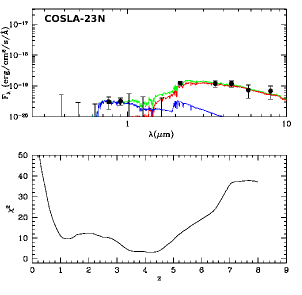
| COSLA-23N | |||||
| COSLA-23S | |||||
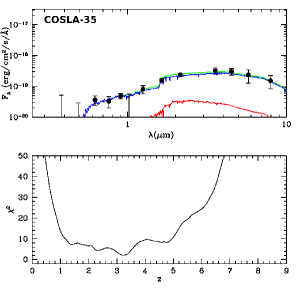
| COSLA-35 | |||||
| COSLA-38 | |||||
| COSLA-47 | |||||
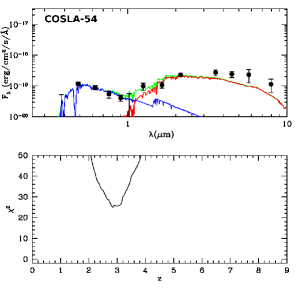
| COSLA-54 | |||||
| COSLA-128 |
3 Galaxy counterparts and multi-wavelength photometry
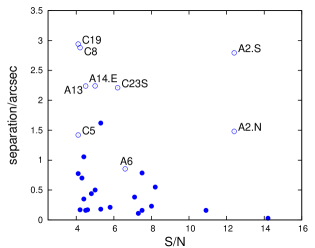
Initially we searched for galaxy counterparts in the UltraVISTA DR1 -band imaging, using a (deliberately generous) search radius of 3 arcsec around the interferometric (sub-)mm positions. Near-infrared counterparts were found for all of the (sub-)mm sources except for AzTEC14.W, COSLA-6N, COSLA-17S and COSLA-128. However, as can be seen in Fig. 2, for AzTEC2 (A2.S), 13, 14.E, COSLA-8, 19 and 23S the (sub-)mm to positional offset is too large for the association to be trusted. Also, for the reasons detailed in the ‘Notes on individual objects’ in the appendix, the optical/infrared counterparts labelled A2.N , A6 and C5 were also not deemed reliable. This leaves a total of 18/30 (sub-)mm sources with robust near-infrared galaxy counterparts (note that in Section 5.2 we discuss the extent to which the same galaxy counterparts would have been identified without the availability of (sub-)mm interferometric observations).
After ensuring that all the optical–infrared imaging was accurately astrometrically aligned to the -band imaging (see Bowler et al. 2012), multi-band aperture photometry was performed at all available wavelengths through 2-arcsec diameter apertures, with multiple 2-arcsec diameter apertures placed on blank-sky regions within arcsec of the source in order to reliably estimate the local photometric uncertainty in each band. With the obvious exception of the IRAC imaging, the imaging data are fairly well matched in terms of seeing quality, but all aperture magnitudes were subsequently corrected to total utilising the measured point spread function in each band. Photometry in the IRAC bands was taken from the S-COSMOS imaging, again corrected to total assuming the sources were not significantly resolved at IRAC wavelengths. The final multi-band photometry measured for the 18 sources with reliable optical–infrared galaxy counterparts is detailed in Tables B2 and B3.
4 Source properties
4.1 Photometric redshifts
The multi-band photometry described above was used to derive photometric redshifts using a minimization method (Cirasuolo et al. 2007, 2010) with a code based on the HYPERZ package (Bolzonella et al. 2000). To create templates of galaxies, the stellar population synthesis models of Bruzual & Charlot (2003) were applied, using the Chabrier (2003) stellar initial mass function (IMF) with a lower and upper mass cut-off of and respectively. A double-burst star-formation history with a fixed solar metallicity was used. Dust reddening was taken into account using the Calzetti (2000) law within the range . The HI absorption along the line of sight was applied according to Madau (1995).
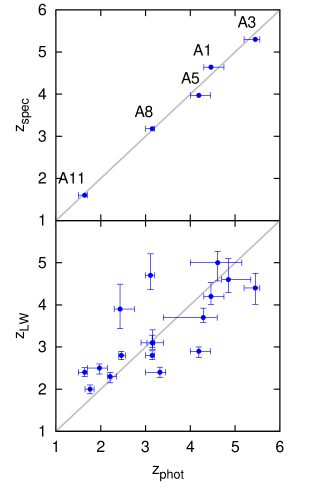
For the (sub-)mm sources for which no optical near-infrared counterpart was found in the available imaging, long-wavelength photometric redshift estimates were derived from their 24 m to 20 cm SEDs (including the radio flux densities given by Smolcic et al. 2012) using the average sub-mm galaxy spectral template derived by Michałowski et al. (2010). Given the potential complications of dust temperature varying with redshift (e.g. Aretxaga et al. 2007; Amblard et al. 2010; Hwang et al. 2010), we experimented with various template libraries, but found that the strongest correlation between redshifts derived from the long-wavelength data and the known optical–near-infrared redshifts (either spectroscopic or photometrically estimated) was achieved by fitting the long-wavelength data with this average template (see Fig. 3). Thus, treating the shorter-wavelength redshift information as a training set, we adopted values for based on fitting the far-infraredradio data with the Michałowski et al. (2010) template, and these are the values listed in column 4 of Table 5.
| Source | |||||
| AzTEC1 | 4.64 | ||||
| AzTEC2 | - | - | 1.125 | - | |
| AzTEC3 | 5.30 | 5.299 | |||
| AzTEC4 | - | ||||
| AzTEC5 | 3.97 | 3.971 | |||
| AzTEC6 | - | - | 0.802 | - | |
| AzTEC7 | - | ||||
| AzTEC8 | 3.18 | 3.179 | |||
| AzTEC9 | - | 1.357 | |||
| AzTEC10 | - | ||||
| AzTEC11 | 1.60 | 1.599 | |||
| AzTEC12 | - | ||||
| AzTEC13 | - | - | - | ||
| AzTEC14 | - | - | - | ||
| AzTEC15 | - | ||||
| COSLA-5 | - | - | - | ||
| COSLA-6N | - | - | - | ||
| COSLA-6S | - | - | - | ||
| COSLA-8 | - | - | - | ||
| COSLA-16N | - | ||||
| COSLA-17N | - | ||||
| COSLA-17S | - | - | - | ||
| COSLA-18 | - | ||||
| COSLA-19 | - | - | - | ||
| COSLA-23N | - | ||||
| COSLA-23S | - | - | - | ||
| COSLA-35 | - | ||||
| COSLA-47 | - | ||||
| COSLA-54 | - | ||||
| COSLA-128 | - | - | - |
The resulting redshift measurements and estimates are summarised in Table 5. As a basic test of the reliability of our redshift estimates we compare (in Fig. 3) our photometric redshifts with the spectroscopic measurements for the five sources in our sample for which reliable optical spectroscopy of the current galaxy counterparts has been obtained (Smolcic et al. 2012); the mean offset is , consistent with zero. In the lower panel of this figure we compare our optical/near-infrared photometric redshift estimates with our long-wavelength photometric redshifts for those sources for which both estimates are available. This shows that the redshift estimates are certainly consistent with the optical/near-infrared photometric redshifts, albeit with more scatter and with a trend for some high-redshift sources to have redshift underestimated by . This suggests that at least some of the most distant (sub-)mm galaxies in our sample may have higher dust temperatures compared to the average (sub-)mm galaxies SED template utilised here to derive .
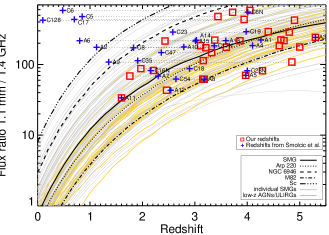
In Fig. 4 we plot our objects on the redshiftmillimetre/radio flux-density ratio plane, both using our own final redshifts (from Table 5) and using the redshifts given for these same objects by Smolcic et al. (2012) (given in column 4 of our Table 5). We plot the redshift information in this way both to clarify the extent to which our redshift estimates differ from those adopted by Smolcic et al. (2012) on a source-by-source basis, and to demonstrate that all our adopted redshifts (, or failing that or failing that ) are consistent with the anticipated redshift dependence of the millimetre/radio flux-density ratio displayed by a reasonable range of template long-wavelength SEDs (as detailed in the plot legend). This plot serves to emphasize that the redshifts given for at least 6 (and more likely 8) of these (sub-)mm sources by Smolcic et al. (2012) are clearly incorrect, as the resulting flux-density ratios are inconsistent with (i.e. much larger than) even extreme choices of cool SEDs at the relevant redshifts. The interested reader can find the details for these differences in the Notes on Individual Objects given in Appendix A, which can be usefully read in conjunction with Fig.4́.
4.2 Redshift distribution
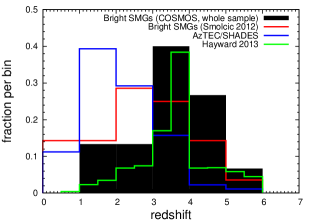
The differential redshift distribution derived for our complete 30-source sample is presented in Fig. 5, where it is compared with several recently-published redshift distributions for (sub-)mm source samples. The median redshift derived for our COSMOS sample is , whereas for the AzTEC/SHADES sample it is (Michałowski et al. 2012a), and for the sample of Chapman et al. (2005), . Clearly, the redshift distribution of our (sub-)mm sample lies at somewhat higher redshift than the majority of recently-published redshift distributions for (sub-)mm selected samples. In part this could be due to the fact that there are no obvious biases in the identification techniques used here, whereas several previously-published redshift distributions contain only sources with robust radio identifications. However, as we explore further below, it may also be due to the fact that the sample considered here is confined to significantly more luminous (sub-)mm sources than, for example, the source samples considered by Michałowski et al. (2012a), or Yun et al. (2012), or Simpson et al. (2014). We re-emphasize that, despite the fact that most of the (sub-)mm sources are in common, our redshift distribution lies at significantly higher redshift than that published by Smolcic et al. (2012); as discussed above (and detailed in Fig. 4) in part this is undoubtedly due to our rejection of several of the lower-redshift candidate identifications proposed by Smolcic et al. (2012), but it is also in part a result of our deliberate exclusion of some of the less luminous LABOCA/PdBI sources in an effort to achieve a homogenous bright source sample.
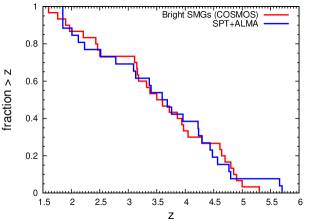
Interestingly, as shown in Fig. 6, the redshift distribution derived here is basically identical to that produced by Vieira et al. (2013) from their ALMA follow-up CO spectroscopy of the lensed mm-selected galaxy sample from the SPT (the K-S test yields ). This is potentially important because, until now, it has been claimed that the SPT redshift distribution is inconsistent with any (sub-)mm source redshift distribution derived without the benefit of ALMA CO spectroscopy (see Vieira et al. 2013).
It is reassuring that these two redshift distributions are so clearly consistent, as it is hard to imagine that our rather robust and well-validated photometric redshift estimation techniques should yield a significantly biased redshift distribution. However, it needs to be explained why the sample studied here yields a redshift distribution consistent with the SPT results, while most other studies of (sub-)mm galaxies clearly do not. As justified further below, we believe there is good evidence that this is primarily a result of ‘downsizing’ in the star-forming population, and that both our COSMOS sample and the SPT sample are biased to significantly higher-luminosity sources than most other studies (e.g. Michalowski et al. 2012a; Simpson et al. 2014; Swinbank et al. 2014). Of course, part of the reason the SPT sources are so apparently bright is that they are lensed, but it transpires that in general the lensing factors are not sufficiently extreme to remove the overall bias of the bright/large SPT survey towards the most intrinisically luminous mm sources (for example, the de-lensed 860 m flux densities of four SPT sources with completed lens modelling reported by Hezaveh et al. (2013) are 5, 6, 16, and 23 mJy).

|
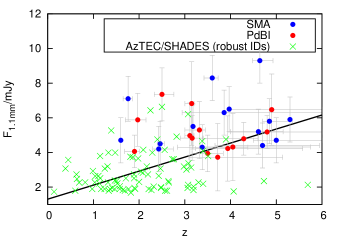
The above comparison and discussion suggests that there is a correlation between (sub-)mm luminosity and mean redshift, in the sense that more luminous sources lie, on average, at systematically higher redshifts. Such a correlation has been suggested before (e.g. Dunlop et al. 1994; Ivison et al. 1998; Dunlop 2011; Michałowski et al. 2012a; Smolcic et al. 2012) and, as discussed above, provides arguably the most natural explanation for the consistency of the redshift distribution presented here with that derived from the bright SPT surveys.
In an attempt to better establish the statistical evidence for this, we plot in Fig. 7 the 1.1 mm flux density for the sources studied here and in the SHADES AzTEC survey (Michałowski et al. 2012a) versus their redshifts. A correlation is apparent, and calculation of the Spearman rank coefficient for the flux-redshift correlation is yields 0.4557, rejecting the null hypothesis of no correlation with a significance value . However, this result is potentially biased by the fact that it includes only the identified sources in the AzTEC/SHADES sample. When the AzTEC/SHADES sources with no secure identifications/redshifts are included (with redshifts scattered randomly between the lower limit implied by the mm/radio flux ratio and ), the Spearman rank coefficient drops to 0.116, yielding . We thus conclude that the data do indeed support the existence of a correlation between (sub-)mm luminosity and typical redshift, but that more dynamic range and improved redshift completeness for the fainter samples is required to establish the significance and form of this relation beyond doubt.
4.3 Stellar masses and specific star formation rates
For the 18 galaxies for which we secured a robust optical-infrared identification, we were able to use the results of the two-component SED fitting which was used to obtain photometric redshifts (see Section 4.2) to obtain an estimate of the stellar mass of each (sub-)mm selected galaxy. As described in Michałowski et al. (2012b), we assumed a Chabrier (2003) stellar IMF, and the stellar masses are based on the models of Bruzual & Charlot (2003) adopting a two-component star-formation history. Where a robust spectroscopic redshift was available we adopted it, but otherwise derived the mass based on the photometric redshift. The results are tabulated in the final column of Table 3. The median stellar mass is , in excellent agreement with the average stellar mass of sub-mm galaxies by Michałowski et al. (2012b).
We also used the redshifts and (sub-)mm flux densities of the identified sources to estimate their star-formation rates (). The s were calculated from the (sub-)mm flux densities assuming the average (sub-)mm SED template of Michałowski et al. (2010). Due to the negative K-correction, a flux density of mJy at mm corresponds approximately to a total (bolometric) infrared luminosity of at , which converts to a after converting to a Chabrier (2003) IMF (Kennicutt 1998).
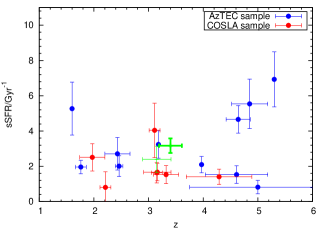
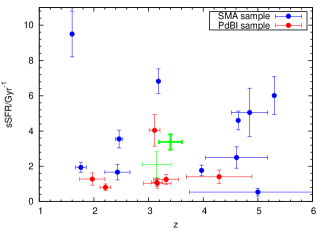
Armed with stellar masses and estimates of , we have then proceeded to derive the specific star-formation rate of each source (). The results are plotted in Fig. 7, where we show both the values derived from the original single-dish measurements, and those derived assuming the interferometric flux densities. While individual values vary (see figure caption for details), it can be seen that in both cases the median value is . This is essentially identical to the average displayed by ‘normal’ star-forming galaxies on the ‘main sequence’ of star formation at (e.g. Gonzalez et al. 2010; but see also Stark et al. 2013) and is again consistent with the findings of Michałowski et al. (2012b); while some subset of (sub-)mm selected galaxies might display values which place them above the main sequence, in general they display star-formation rates which are perfectly consistent with the main-sequence expectation based on their high stellar masses (see also Roseboom et al. 2013).
|
5 Single dish versus interferometric measurements
5.1 Multiplicity and number counts
Recently, ALMA observations of 870 m sources in the Extended Chandra Deep Field South (ECDFS) from the Laboca LESS survey (Weiss et al. 2009) have been presented, first by Karim et al. (2013), and then in more detail by Hodge et al. (2013). This sample includes twelve bright objects with original single-dish flux-density measurements of mJy. From this ‘ALESS’ study, Karim et al. (2013) reported that source multiplicity is common, and that most bright (sub-)mm sources uncovered in single-dish surveys to date are in fact artificial, resulting from blends of fainter (albeit sometimes physically associated) sources within the original single-dish beam. Indeed, Karim et al. (2013) went so far as to claim that mJy may represent a physical limit to the luminosity of a star-forming galaxy.
However, it is clear that this conclusion is at odds with the sample under study here, in which nine objects retain flux-densities mJy within a single component in the high-resolution interferometric follow-up. It also runs contrary to the results of various other SMA follow-up studies of SCUBA sources, which have generally suggested that (sub-)mm source multiplicity is rare (e.g. Downes et al. 1999; Iono et al. 2006; Younger et al. 2007, 2008, 2009; Cowie et al. 2009; Hatsukade et al. 2010)
A more detailed account of the ALESS results has now been published by Hodge et al. (2013), facilitating an assessment of the prevalence of multiplicity. In fact, contrary to the claims advanced in Karim et al. (2013) (and repeated in the abstract of Hodge et al. 2013), the ALMA results show that significant multiplicity is not common at all, consistent with previous studies (including the sample under study here). Specifically, for the 20 brightest LESS sources for which Hodge et al. (2013) report ALMA results, only 5 reveal multiple ALMA subcomponents, and in only 2 of these 5 does the secondary component contribute % of the flux density, thereby potentially significantly distorting the flux density and/or position of the original single-beam LABOCA source. Moreover, table 3 from Hodge et al. (2013) confirms that for the brightest 20 LESS sources, the radio identification technique in fact already yielded the correct galaxy counterpart in 17/20 cases (Biggs et al. 2011).
Thus the ALMA results in fact confirm that multiplicity is not common, with only % of bright sources showing a significant (e.g. %) flux contribution from a secondary component. This result is confirmed by recent reports of SMA follow-up of SCUBA2 sources, which conclude that only % of the 850 m sources in SCUBA2 samples arise from blends of multiple fainter sources (Chen et al. 2013).
In the present study we have also investigated whether there is any evidence that, on average, significantly less (sub-)mm flux-density is returned by the interferometric observations as compared to the original single-dish measurements. Here this is complicated by the fact that the AzTEC sources were followed up with (SMA) interferometry at shorter wavelengths, while the COSLA sources were followed up with (PdBI) interferometry at longer wavelengths. However, at least this brings some symmetry to the problem, potentially ameliorating somewhat any biases introduced by an incorrect choice of long-wavelength SED when performing the necessary k-corrections. In addition, we have performed this test with two different long-wavelength SED templates. Using the average SMG template described in Section 4.1 (applied at the relevant redshifts), we find that the mean interferometric/single-dish flux-density ratio for the 30 sources is (median ). Using an Arp220 template, we find that mean (median ). Thus, while we acknowledge that the current sample is not ideal for this test, we find no significant evidence that either multiplicity or very extended emission is (on average) present at a level than can distort the true flux density of the sources in the large-beam single-dish measurements (at least with the beam sizes utilised here) by more than %.
In summary, it now appears extremely unlikely that the number counts of (sub-)mm sources derived from single-dish surveys (e.g. Coppin et al. 2006; Austermann et al. 2010; Scott et al. 2012) have been significantly distorted by source blending, and the new interferometry results reinforce the success of previous galaxy counterpart identification programs which have concluded that % of (sub-)mm sources can have their galaxy counterparts correctly identified via sufficiently deep ancillary radio and/or Spitzer data. For completeness, we now explore this issue further, focussing on what conclusions would be drawn from the 30-source sample considered here, both with and without the extra information provided by interferometric follow-up.
5.2 The reliability of (sub-)mm galaxy identifications
Given the afore-mentioned success of the pre-ALMA LESS identification program (Biggs et al. 2011), it is of interest to consider the extent to which the galaxy counterparts in the present COSMOS (sub-)mm sample would have been successfully identified without the assistance of the SMA and PdBI interferometric follow-up.
In the fifteen years since the discovery of (sub-)mm sources, several methods have been proposed to identify their galaxy counterparts in the face of the relatively poor positional accuracy provided by single-dish (sub-)mm imaging. As already discussed, deep radio (generally 1.4 GHz VLA) imaging and deep mid-infrared (generally 24 m Spitzer MIPS) imaging have proved particularly powerful in identifying galaxy counterparts, due to the fact these wavelengths also trace star-formation activity (e.g. Ivison et al. 2010), provide improved positional accuracy (especially at radio wavelengths) and yield source densities on the sky which are generally low enough to yield statistically-significant associations (e.g. Ivison et al. 2002, 2007; Dunlop et al. 2010; Biggs et al. 2011; Wardlow et al. 2011; Yun et al. 2012; Michałowski et al. 2012a). It has also been found that (sub-)mm sources generally display very red optical-infrared () colours (e.g. Smail et al. 2004; Ashby et al. 2006; Michałowski et al. 2012a; Yun et al. 2012), apparently caused by a combination of dust obscuration and the presence of underlying massive evolved stellar populations (Michałowski et al. 2012b). Finally, it is now also well-established that (sub-)mm galaxies are among the brightest galaxies at rest-frame near-infrared wavelengths, again due to their large stellar masses. At high redshifts this manifests itself as (sub-)mm galaxies appearing to be among the apparently brightest objects in Spitzer 8 m IRAC imaging (Pope et al. 2006, 2008; Dye et al. 2008; Hainline et al. 2009; Wardlow et al. 2011; Michałowski et al. 2012b; Targett et al. 2013).
In order to test these methods we selected VLA 1.4 GHz, Spitzer MIPS 24 m, IRAC 8 m, and red () counterparts to the (sub-)mm galaxies in the COSMOS sample in a similar way to that presented in Michałowski et al. (2012a). Following the method outlined in Dunlop et al. (1989) and Ivison et al. (2007), we assessed the reliability of each potential galaxy identification by calculating the corrected Poissonian probability, , that each association could have been occurred by chance given our search parameters. Specifically, we applied this technique to the original pre-interferometric (sub-)mm source detections, using a search radius of , where FWHM is the full-width-half-maximum of the single-dish beam, and S/N is the signal:noise ratio of the original (deboosted) AzTEC or LABOCA detection.
Armed with interferometrically-refined coordinates from the subsequent SMA and PdBI observations, we can here test the success/reliability of such multi-frequency association methods directly.
The results of this test of the identification process are summarised in Table B1. Additional details can be found in the caption to this table (see also the notes on individual objects in Appendix A), but the key result is that 16 of the 30 sources would have been successfully identified on the basis of the single-dish (sub-)mm positions and the available multi-frequency follow-up imaging. These 16 objects (highlighted in bold in Table B1) are 15 of the 18 sources for which stellar masses are given in Table 3 (and for which the multi-frequency photometry is provided in Tables B2 and B3), plus AzTEC2, which is a purely radio identification confirmed by the interferometric positions. This means that 16/19 = 84% of the galaxy identifications achievable with the aid of the improved interferometric positional accuracy would be correctly identified on the basis of the original single-dish data. The three additional galaxy identifications secured with the aid of the SMA and PbBI data comprise new galaxy counterparts for COSLA-54 and COSLA-17N, and a revised identification for AzTEC15 where a surprisingly large positional shift is reported between the original AzTEC position and the SMA peak.
Interestingly, three further identifications suggested by the single-dish positions are formally excluded by the interferometric data, but without the new positions yielding a new alternative identification. In two of these cases (COSLA-5 and COSLA-8) the proposed single-dish identification was statistically compelling but now appears unacceptable given the reduced error on the mm position delivered by PdBI. One possible explanation of such apparently conflicting conclusions is that both these objects could be lensed, and that the optical-infrared counterpart yielding the statistically significant association is the lensing object. In our analysis we have, in effect, guarded against this possibility by adopting the long-wavelength redshift estimate for these objects. Finally, the apparently significant identification of COSLA-128 listed in the last row of Table B1 is formally excluded by the PdBI follow-up, but this is primarily because the PdBI position is arcsec from the LABOCA position (for reasons that are hard to explain).
In summary, while the interferometric observations clearly add important extra information on the AzTEC and LABOCA sources, for this luminous sample we find that % of the galaxy identifications which are achievable given the depth of the supporting multi-frequency data would have been successfully secured without the aid of the interferometric follow-up. In other words the main cause of failed identification is not blending or inadequate positional accuracy in the single-dish (sub-)mm positions, but supporting multi-wavelength data of inadequate depth to reveal the galaxy counterparts of the more high-redshift sources in the current sample. Of course, as the supporting data become deeper then the improved positional accuracy provided by interferometry (or, for example, SCUBA-2 450 m imaging) will become increasingly valuable as the source densities in the supporting data rise.
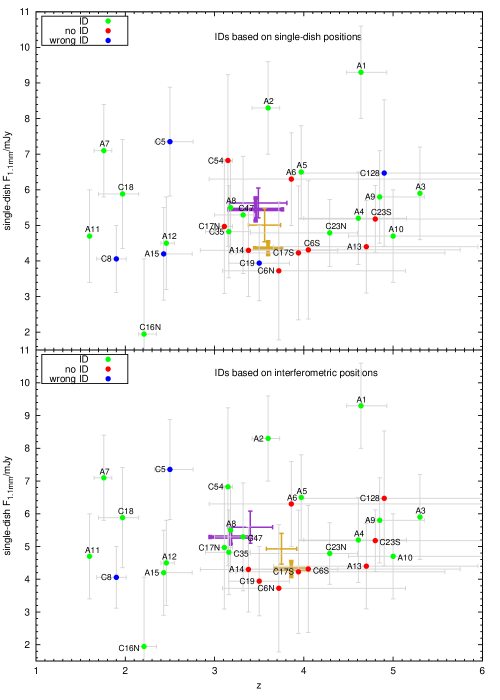
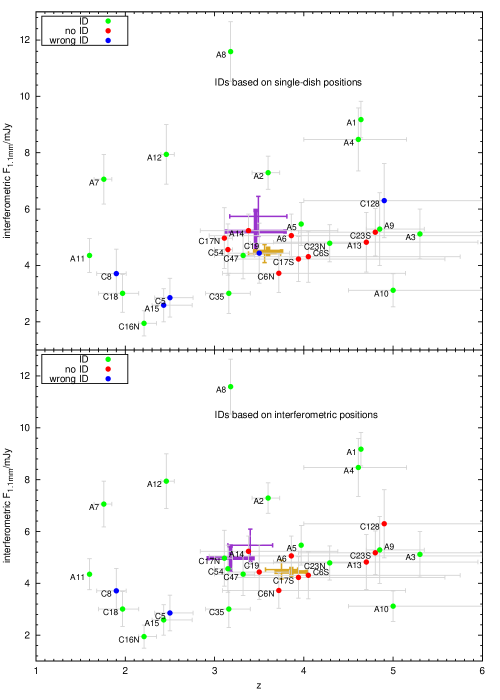
For completeness, we show in Appendix C, Figs C1 and C2, how the locations of the sources on the flux-density–redshift plane vary depending on whether one adopts the identifications based on single-dish or interferometric positions, and also whether one adopts the single-dish (Fig. C1) or interferometric (Fig. C2) flux densities. The average (sub-)mm flux density inferred from the interferometry is only % lower than the single-dish average, and in all four panels the average redshift of the identified sources lies just below while the average redshift of the sources which currently lack optical-infrared is (as anticipated) slightly higher (but still at ). It is thus unsurprising that our main science results are little changed by whether we adopt the single-dish or interferometric postions and flux densities in our analysis.
6 Conclusions
We have presented a new analysis of the brightest sample of unlensed (sub-)mm sources with existing (pre-ALMA) interferometric (SMA or PdBI) follow-up observations. Because these sources lie within the COSMOS field, we have been able to exploit the latest Subaru, UltraVISTA and Spitzer optical-infrared photometry to better establish their redshifts (), stellar masses () and specific star-formation rates (). We have also explored the extent to which the supporting data in the field could have been used to reliably identify the galaxy counterparts without the improved positional accuracy provided by sub-mm/mm interferometry. We find that the bright (sub-)mm sources in the COSMOS field display a redshift distribution indistinguishable from that of the lensed SPT sources (Vieira et al 2013), peaking at . We also find that the typical stellar mass of the most luminous (sub-)mm sources is independent of redshift for , with median assuming a Chabrier (2003) IMF. Consequently, their typical specific star-formation rates also remain approximately constant out to the highest redshifts probed, at . We note that, consistent with recent ALMA interferometric follow-up of the LESS sub-mm sources (Hodge et al. 2013), and SMA follow-up of SCUBA2 sources (Chen et al. 2013), source blending is not a serious issue in the study of luminous (sub-)mm sources uncovered by ground-based, single-dish ( arcsec) surveys; only % of bright ( mJy) (sub-)mm sources arise from significant blends, and so the conclusions of our study are largely unaffected by whether we adopt the original single-dish mm/sub-mm flux densities/positions, or the interferometric flux densities/positions. Our results suggest that apparent disagreements over the redshift distribution of (sub-)mm sources are simply a result of “down-sizing” in dust-enshrouded star-formation, consistent with existing knowledge of the star-formation histories of massive galaxies. They also indicate that bright (sub-)mm-selected galaxies at high redshift are, on average, subject to the same star-formation rate-limiting processes as less luminous objects, and lie on the “main sequence” of star-forming galaxies.
Acknowledgments
MPK acknowledges the support of the UK Science and Technology Facilities Council. JSD acknowledges the support of the Royal Society via a Wolfson Research Merit award, and the support of the European Research Council via the award of an Advanced Grant, and the contribution of the EC FP7 SPACE project ASTRODEEP (Ref.No: 312725). MJM acknowledges the support of the UK Science and Technology Facilities Council, and the FWO Pegasus Marie Curie Fellowship. RAAB acknowledges the support of the European Research Council. MC acknowledges the support of the UK Science and Technology Facilities Council via an Advanced Fellowship.
This work is based in part on data products from observations made with ESO Telescopes at the La Silla Paranal Observatories under ESO programme ID 179.A-2005 and on data products produced by TERAPIX and the Cambridge Astronomy survey Unit on behalf of the UltraVISTA consortium. This study was based in part on observations obtained with MegaPrime/MegaCam, a joint project of CFHT and CEA/DAPNIA, at the Canada-France-Hawaii Telescope (CFHT) which is operated by the National Research Council (NRC) of Canada, the Institut National des Science de l’Univers of the Centre National de la Recherche Scientifique (CNRS) of France, and the University of Hawaii. This work is based in part on data products produced at TERAPIX and the Canadian Astronomy Data Centre as part of the Canada-France-Hawaii Telescope Legacy Survey, a collaborative project of NRC and CNRS. This work is based in part on observations made with the NASA/ESA Hubble Space Telescope, which is operated by the Association of Universities for Research in Astronomy, Inc, under NASA contract NAS5-26555. This work is based in part on observations made with the Spitzer Space Telescope, which is operated by the Jet Propulsion Laboratory, California Institute of Technology under NASA contract 1407. We thank the staff of the Subaru telescope for their assistance with the -band imaging utilised here. This research has made use of the NASA/IPAC Infrared Science Archive, which is operated by the Jet Propulsion Laboratory, California Institute of Technology, under contract with the National Aeronautics and Space Administration.
References
- [1] Amblard A., et al., 2010, A&A, 518, L9
- [2] Aretxaga I., et al., 2007, MNRAS, 379, 1571
- [3] Ashby M., et al. 2006, ApJ, 644, 778
- [4] Austermann J.E., et al., 2010, MNRAS, 401, 160
- [5] Barger A.J., Cowie L.L., Sanders D.B., Fulton E., Taniguchi Y., Sato Y. Kawara K., Okuda H., 1998, Nature, 394, 248
- [6] Biggs A.D., et al., 2011, MNRAS, 413, 2314
- [7] Bowler R.A.A., et al., 2012, MNRAS, 426, 2772
- [8] Bruzual G., Charlot S., 2003, MNRAS, 344, 1000
- [9] Calzetti D., et al., 2000, ApJ, 533, 682
- [10] Capak P., et al., 2008, ApJ, 681, L53
- [11] Capak P., et al., 2011, Nat, 470, 233
- [12] Chapin E.L., et al., 2009, MNRAS, 398, 1793
- [13] Chapman S.C., Blain A.W., Ivison R.J., Smail I.R., 2003, Nat, 422, 695
- [14] Chapman, S.C., Blain, A.W., Smail, I., Ivison, R.J., 2005, ApJ, 622, 772
- [15] Chen C.-C., Cowie L.L., Barger A.J., Casey C.M., Lee N., Sander D.B., Wang W.-H., Williams J.P., 2013, ApJ, 776, 131
- [16] Cirasuolo M., et al., 2007, MNRAS, 380, 585
- [17] Cirasuolo M., McLure R.J., Dunlop J.S., Almaini O., Foucaud S., Simpson C., 2010, MNRAS, 401, 1166
- [18] Clements D.L., et al., 2008, MNRAS, 387, 247
- [19] Combes F., et al., 2012, A&A, 538, L4
- [20] Coppin K., et al., 2006, 372, 1621
- [21] Coppin K.E.K., et al., 2009, MNRAS, 395, 1905
- [22] Cowie L.L., Barger A.J., Wang W.-H., Williams J.P., 2009, ApJ, 697, L122
- [23] Cox P., et al., 2011, ApJ, 740, 63
- [24] Daddi E., Dannerbauer H., Krips M., Walter F., Dickinson M., Elbaz D., Morrison G.E., 2009a, ApJ, 695, L176
- [25] Daddi E., et al., 2009b, ApJ, 694, 1517
- [26] Downes D., et al., 1999, A&A, 347, 809
- [27] Dunlop J.S., Peacock J.A., Savage A., Lilly S.J., Heasley J.N., Simon A.J.N., 1989, MNRAS, 238, 1171
- [28] Dunlop J.S., Hughes D.H., Rawlings S., Eales S.A., Ward M.J., 1994, Nature, 370, 347
- [29] Dunlop J.S., 2011, ASPC, 446, 209
- [30] Dunlop J.S., et al., 2004, MNRAS, 350, 768
- [31] Dunlop J.S., et al., 2010, MNRAS, 408, 2022
- [32] Dye S., et al., 2008, MNRAS, 386, 1107
- [33] Gwyn S.D.J., 2011, arXiv:1101.1084
- [34] Hainline L.J., Blain A.W., Smail I., Frayer D.T., Chapman S.C., Ivison R.J., Alexander D.M., 2009, ApJ 699, 1610
- [35] Hatsukade B., et al., 2010, ApJ, 711, 974
- [36] Hayward C.C., Narayanan D., Keres, D., Jonsson P., Hopkins P.F., Cox T.J., Hernquist L., 2013, MNRAS, 428, 2529
- [37] Hezaveh Y.D., et al., 2013, ApJ, 767, 132
- [38] Hodge J.A., et al., 2013, ApJ, 768, 91
- [39] Hughes D.H., et al., 1998, Nat, 394, 241
- [40] Hwang H.S., et al., 2010, MNRAS, 402, 245
- [41] Iono D., et al., 2006, ApJ, 640, L1
- [42] Ivison R.J., et al., 1998, ApJ, 494, 211
- [43] Ivison R.J., et al., 2002, MNRAS, 337, 1
- [44] Ivison R.J., et al., 2007, MNRAS, 380, 199
- [45] Ivison R.J., et al., 2010, MNRAS, 402, 245
- [46] Karim A., et al., 2013, MNRAS, 432, 2
- [47] Kennicutt R.C., 1998, ARA&A, 36, 189
- [48] Knudsen K.K., Neri R., Kneib J.-P., van der Werf P.P., A&A, 496, 45
- [49] Lindner R.R., et al., 2011, ApJ, 737, 83
- [50] Madau P., 1995, ApJ, 441, 18
- [51] McCracken H.J., et al., 2012, A&A, 544, 156
- [52] Michałowski M.J., et al., 2010, A&A, 514, 67
- [53] Michałowski M.J., et al., 2012a, MNRAS, 426, 1845
- [54] Michałowski M.J., et al., 2012b, A&A, 541, 85
- [55] Oke J.B., 1974, ApJS, 27, 21
- [56] Pope A., et al., 2006, MNRAS, 370, 1185
- [57] Pope A., et al., 2008, ApJ, 675, 1171
- [58] Riechers D.A., et al., 2010, ApJ, 720, L131
- [59] Riechers D.A., et al., 2013, Nat, 496, 329
- [60] Sanders D.B., et al., 2007, ApJS, 172, 86
- [61] Schinnerer E., et al., 2008, ApJ, 689, L5
- [62] Scott K.S., et al., 2012, MNRAS, 423, 575
- [63] Simpson J., et al., 2014, ApJ, 788, 125S
- [64] Smail S., Chapman S.C., Blain A., Ivison R.J., 2004, ApJ, 616, 71
- [65] Smolcic V., et al., 2011, ApJ, 731, L27
- [66] Smolcic V., et al., 2012, A&A, 548, 4
- [67] Swinbank A.M., et al., 2014, MNRAS, 438, 1267
- [68] Taniguchi Y., et al., 2007, ApJS, 172, 9
- [69] Targett T.A., et al., 2013, MNRAS, 432, 2012
- [70] Vieira J.D., et al., 2013, Nat, 495, 344
- [71] Wall J.V., Pope A., Scott D., 2008, 383, 435
- [72] Walter F., et al., 2012, Nat, 486, 233
- [73] Wardlow J.L., et al., 2011, MNRAS, 415, 1479
- [74] Weiss A., et al., 2009, ApJ, 707, 1201
- [75] Weiss A., et al., 2013, ApJ, 767, 88
- [76] Younger J.D., et al., 2007, ApJ, 671, 1531
- [77] Younger J.D., et al., 2008, MNRAS, 387, 707
- [78] Younger J.D., et al., 2009, ApJ, 704, 803
- [79] Yun M.S., et al., 2012, MNRAS, 420, 957
Appendix A Notes on individual objects
AzTEC1. A robust single identification only 0.03 arcsec from the SMA position, which would also be selected by the m method based on the original AzTEC position. Both and are in excellent agreement with the spectroscopic redshift of .
AzTEC2. A secure radio and 24 m identification without a visible optical or -band counterpart (and hence no stellar mass estimate in Table 5). An alternative object 1.4 arcsec away from the SMA position was selected by Smolcic et al. (2012) and found to have a spectroscopic redshift . However, since the radio position is only 0.39 arcsec from the SMA position and the mm/radio flux ratio yields a long-wavelength redshift estimate of , this low-redshift object cannot be the correct identification (its mm/radio flux-density ratio is , inconsistent with such a low redshift; see Fig. 4). The correct radio identification would still have been secured without the improved positional accuracy provided by the SMA interferometry.
AzTEC3. Similar to AzTEC1, a robust single identification 0.21 arcsec from the SMA position, which would also be selected by the m method based on the original AzTEC position. Both and are in good agreement with the spectroscopic redshift of .
AzTEC4. A robust single identification 0.78 arcsec from the SMA position. and are in good agreement that the source has a redshift in the range . This source would have been successfully identified on the basis of the original AzTEC position by both the and m methods.
AzTEC5. A robust single identification 0.38 arcsec from the SMA position. is in excellent agreement with the spectroscopic redshift , while is somewhat under-estimated. This source would have been securely identified using all four types of statistical association on the basis of the original AzTEC position.
AzTEC6. Not identified with any method either using the AzTEC position or the refined SMA position. There is an optical object arcsec from the SMA position for which we find (this is also the ID adopted by Smolcic et al. 2012, with ), but as with AzTEC2 this optical counterpart can be excluded as the correct identification not just because of its relatively large positional offset, but also because its mm/radio flux-density ratio of is inconsistent with (; see Fig. 4). The lack of any optical-infrared counterpart means that no stellar mass estimate for this object can be included in Table 5.
AzTEC7. A robust single identification 0.23 arcsec from the SMA position. and are in good agreement that the source has a redshift . Like AzTEC5, this source would have been securely identified using all four types of statistical association on the basis of the original AzTEC position.
AzTEC8. A robust single identification 0.16 arcsec from the SMA position. Both and are in good agreement with the spectroscopic redshift of . This source would have been successfully identified on the basis of the original AzTEC position by both the and m methods.
AzTEC9. A robust single identification 0.77 arcsec from the SMA position. Like AzTEC4, and are in good agreement that the source has a redshift in the range . The radio identification would have been correctly selected on the basis of the original AzTEC position. Smolcic et al. (2012) selected a different object arcsec from the SMA position with a photometric redshift of and a spectroscopic redshift . However, not only is such a large positional offset very unlikely, but AzTEC9 has a large mm/radio flux ratio of , completely inconsistent with such a low redshift (see Fig. 4). We therefore conclude that the counterpart selected by Smolcic et al. (2012) cannot be correct, and that the true identification is the higher redshift galaxy listed in Table 5.
AzTEC10. There are three potential counterparts within 2 arcsec of the SMA position. Using the SMA coordinates alone we would choose the closest and the brightest one, but because of the m flux and the very red colour of the more distant object ( arcsec from the SMA position), we chose it as the most likely identification. The photometric redshift determination yielded a very flat curve with a formal minimum at . Even though such an extreme redshift is very unlikely, stacking the optical data shows that it is undetected in the optical wavebands suggesting . Also our mm/radio estimate gives a redshift of (arguably biased low due to using a cold SED template appropriate for lower-redshift objects). Considering this, and the probability distribution for the optical-infrared , for this object we adopt a redshift . This object would have been correctly identified using all but the radio identification technique on the basis of the original AzTEC position.
AzTEC11. This source is split into two components by the SMA imaging, but it may be an extended object and therefore we continue to treat it as a single source. is in excellent agreement with the spectroscopic redshift , while this time is somewhat over-estimated. This source would have been securely identified using all four types of statistical association on the basis of the original AzTEC position.
AzTEC12. A robust single identification 0.16 arcsec from the SMA position. and are in good agreement that the source has a redshift . Again, this source would have been securely identified using all four types of statistical association on the basis of the original AzTEC position.
AzTEC13. This object was not associated with any optical or IRAC counterpart using either the SMA or AzTEC position. A weak radio detection yields , but no stellar mass can be given in Table 5.
AzTEC14. Like AzTEC13 this object was not associated with any optical or IRAC counterpart using either the SMA or AzTEC position. The weak radio flux density measurement yields , but no stellar mass can be given in Table 5.
AzTEC15. A robust single identification 1.05 arcsec away from the SMA position. This source could not have been identified on the basis of the AzTEC position because the SMA centroid is shifted by more than 10 arcsec. and suggest .
COSLA-5. This object has two possible optical counterparts less than 1.5 arcsec from the PdBI position. The first one is 1.3 arcsec away with , and is the identification adopted by Smolcic et al. (2012). However, because our mm/radio redshift estimate yields , we conclude that this cannot be the correct counterpart (see Fig. 4). The second possible optical counterpart is 1.1 arcsec away, but is only visible in the - and -bands, and so no reliable optical/infrared photometric redshift could be derived. We thus cautiously adopt , and do not give a stellar mass estimate in Table 5.
COSLA-6N. This object was not associated with any optical or IRAC counterpart on the basis of either the LABOCA or PdBI position. The weak radio flux measurement suggests , but no stellar mass estimate can be given in Table 5.
COSLA-6S. This object has an optical counterpart 0.5 arcsec from the PdBI position, for which Smolcic et al. (2012) derived . However, once again because our mm/radio redshift estimate yields , and completely excludes , we conclude that this cannot be the correct identification (although clearly it could be a lensing galaxy; see Fig. 4). We thus adopt as the best estimate of the redshift of the sub-mm source, but cannot provide a stellar mass estimate in Table 5.
COSLA-8. This object has no secure optical nor IRAC counterpart. It was associated by Smolcic et al. (2012) with an optical object 1 arcsec from the PdBI peak which was found to have based on two data points. Given the unreliability of this measurement, we choose here to adopt our mm/radio redshift estimate, but in fact this is perfectly consistent with the redshift given by Smolcic et al. (2012).
COSLA-16N. A robust single identification 0.70 arcsec from the PdBI position. and are in good agreement that the source has a redshift . This source would have been securely identified using all four types of statistical association on the basis of the original LABOCA position.
COSLA-17N. A robust single identification 0.17 arcsec from the PdBI position, but this would not have been secured on the basis of the LABOCA position.
COSLA-17S. This object was not associated with any optical or IRAC counterpart. A weak radio flux measurement leads to , but we cannot provide a stellar mass estimate in Table 5. We note that Smolcic et al. (2012) adopted a redshift , but such a redshift is implausible for this source (see Fig. 4).
COSLA-18. A robust single identification 0.16 arcsec from the PdBI position. and are in good agreement that the source has a redshift . This source would have been securely identified using all four types of statistical association on the basis of the original LABOCA position.
COSLA-19. This object was not associated with any optical or IRAC counterpart. A weak radio flux measurement leads to , but we cannot provide a stellar mass estimate in Table 5.
COSLA-23N. A robust single identification 0.11 arcsec from the PdBI position. and are in good agreement that the source has a redshift . This object would have been correctly identified using all but the 24 m identification technique on the basis of the original LABOCA position.
COSLA-23S. This object was not associated with any optical or IRAC counterpart. Smolcic et al. (2012) found an optical counterpart arcsec from the PdBI peak with a redshift of based on one data point. We derive a mm/radio redshift estimate of , and take it to be a more reliable redshift estimate, but cannot provide a stellar mass estimate in Table 5.
COSLA-35. A robust single identification 0.17 arcsec from the PdBI position. and are in excellent agreement that the source has a redshift . This object would have been correctly identified using all but the 24 m identification technique on the basis of the original LABOCA position.
COSLA-38. The PdBI coordinates for this object are arcsec distant from the original LABOCA centroid, placing this object at the edge of the PdBI beam. In addition, the quoted PdBI flux density is higher than the original LABOCA flux density, raising the possibility that, for whatever reason, it is not the same source. For this reason we decided to exclude it from the main analysis, and so it does not appear in Table 5.
COSLA-47. A robust single identification 0.18 arcsec from the PdBI position. and are in reasonable agreement that the source has a redshift . This object would have been tentatively identified on the basis of colour given the original LABOCA position.
COSLA-54. A robust single identification 0.50 arcsec from the PdBI position. and are in excellent agreement that the source has a redshift . This object could not have been identified on the basis of the LABOCA position.
COSLA-128. This object was not associated with any optical or IRAC counterpart given the PdBI position. We adopt , but cannot provide a stellar mass estimate in Table 5. We note that Smolcic et al. (2012) adopted a redshift , but such a redshift is implausible for this source (see Fig. 4).
Appendix B Multi-wavelength identifications
In this appendix we first illustrate, in Fig. B1, the galaxy identifications secured utilising the accurate positions provided for the (sub-)mm sources by the SMA and PdBI interferometric observations, overlaying the SMA and PdBI positions on CFHT optical, UltraVISTA near-infrared and IRAC 8 m image stamps.
We then provide Table B1, which summarises the results of our attempt to establish galaxy identifications based on multi-frequency associations with the original single-dish (AzTEC and LABOCA) positions.
Finally in Tables B2 and B3 we provide the optical-infrared photometry for the 18 secure galaxy identifications (based on the interferometric positions) which was used to estimate the photometric redshifts and stellar masses given in Table 5.
| ID | RA | Dec | Offset | |||||||||
|---|---|---|---|---|---|---|---|---|---|---|---|---|
| /deg | /deg | /arcsec | /AB | /AB | /Jy | /mJy | /mJy | |||||
| AzTEC1 | 149.92859 | 2.49393 | 3.5 | 23.44 | 1.60 | 0.036 | - | - | - | - | ||
| AzTEC2 | 150.03343 | 2.43671 | 0.1 | - | - | - | - | 0.002 | 0.001 | |||
| AzTEC3 | 150.08629 | 2.58898 | 2.1 | 23.94 | 1.16 | 0.059 | - | - | - | - | ||
| AzTEC4 | 149.88196 | 2.51215 | 4.3 | 23.76 | 3.16 | 0.031 | 0.083 | - | - | - | - | |
| AzTEC5 | 150.08240 | 2.53456 | 1.7 | 23.38 | 2.79 | 0.041 | 0.028 | 0.017 | 0.002 | |||
| AzTEC7 | 150.07529 | 2.80841 | 2.7 | 21.13 | 3.18 | 0.003 | 0.025 | 0.006 | 0.003 | |||
| AzTEC8 | 149.99721 | 2.57804 | 4.8 | 23.30 | 2.98 | 0.072 | 0.065 | - | - | - | - | |
| AzTEC9 | 149.98870 | 2.45840 | 1.7 | 24.15 | 1.52 | - | - | - | - | 0.002 | ||
| AzTEC10 | 149.87819 | 2.67563 | 1.9 | 23.54 | 4.24 | 0.031 | 0.031 | 0.021 | - | - | ||
| AzTEC11 | 150.03726 | 2.66956 | 3.2 | 21.48 | 1.90 | 0.036 | 0.043 | 0.008 | 0.002 | |||
| AzTEC12 | 150.14708 | 2.73144 | 1.4 | 21.51 | 2.74 | 0.004 | 0.010 | 0.007 | 0.002 | |||
| AzTEC15 | 150.05586 | 2.57334 | 5.1 | 19.90 | 2.16 | 0.014 | - | - | - | - | ||
| COSLA-5 | 150.24872 | 2.28574 | 3.3 | 19.92 | 2.63 | 0.003 | 0.060 | - | - | - | - | |
| COSLA-8 | 150.10641 | 2.25154 | 4.0 | 22.04 | 3.98 | 0.023 | 0.080 | 0.012 | 0.006 | |||
| COSLA-16 | 150.21494 | 2.55951 | 3.1 | 20.83 | 2.57 | 0.009 | 0.049 | 0.016 | 0.004 | |||
| COSLA-18 | 150.17992 | 2.08863 | 2.9 | 22.18 | 5.14 | 0.018 | 0.044 | 0.022 | 0.005 | |||
| COSLA-19 | 150.03380 | 2.19506 | 6.2 | 20.92 | 2.27 | 0.059 | - | - | - | - | - | - |
| COSLA-23 | 150.04231 | 2.22635 | 1.8 | 23.21 | 3.72 | 0.025 | 0.048 | 0.066 | 0.003 | |||
| COSLA-35 | 150.09857 | 2.36537 | 3.9 | 22.49 | 4.35 | 0.037 | 0.075 | 0.049 | 0.010 | |||
| COSLA-47 | 150.13901 | 2.43378 | 6.6 | 22.46 | 3.33 | 0.070 | - | - | - | - | ||
| COSLA-128 | 150.40825 | 2.39440 | 8.0 | 17.63 | 1.19 | 0.020 | 0.015 | 0.010 |
| ID | RA | DEC | |||||||||||||
|---|---|---|---|---|---|---|---|---|---|---|---|---|---|---|---|
| AzTEC1 | 149.92859 | 2.49394 | |||||||||||||
| AzTEC3 | 150.08620 | 2.58900 | |||||||||||||
| AzTEC4 | 149.88196 | 2.51216 | |||||||||||||
| AzTEC5 | 150.08240 | 2.53456 | |||||||||||||
| AzTEC8 | 149.99721 | 2.57804 | |||||||||||||
| AzTEC9 | 149.98870 | 2.45840 | |||||||||||||
| AzTEC10 | 149.87819 | 2.67563 | |||||||||||||
| AzTEC11 | 150.03726 | 2.66957 | |||||||||||||
| AzTEC15 | 150.05388 | 2.57634 | |||||||||||||
| COSLA-16N | 150.21490 | 2.55930 | |||||||||||||
| COSLA-17N | 150.40340 | 2.18600 | |||||||||||||
| COSLA-18 | 150.17990 | 2.08860 | |||||||||||||
| COSLA-23N | 150.04230 | 2.22640 | |||||||||||||
| COSLA-35 | 150.09850 | 2.36530 | |||||||||||||
| COSLA-47 | 150.13890 | 2.43380 | |||||||||||||
| COSLA-54 | 149.65830 | 2.23570 |
| ID | RA | DEC | ||||||||||||||
|---|---|---|---|---|---|---|---|---|---|---|---|---|---|---|---|---|
| AzTEC7 | 150.07529 | 2.80842 | ||||||||||||||
| AzTEC12 | 150.14708 | 2.73144 |
Appendix C Comparison of single-dish and interferometic flux densities and identifications
In this appendix we illustrate the extent to which flux densities and redshifts resulting from the galaxy identification process depend on whether one works with the original single dish (sub-)mm fluxes and positions, or instead adopts the corresponding information derived from the interferometric (PdBI and SMA) observations.
Appendix D Spectral Energy Distribution fits and photometric error estimates
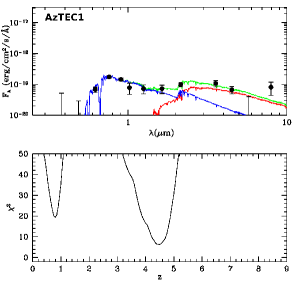
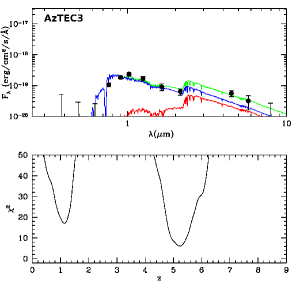
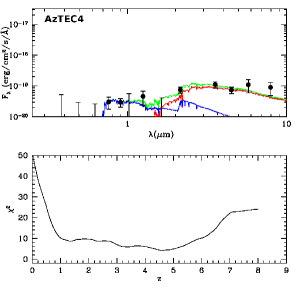
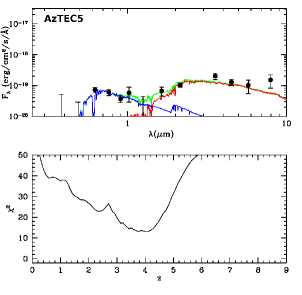
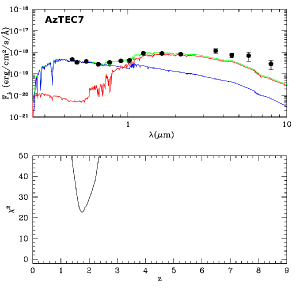
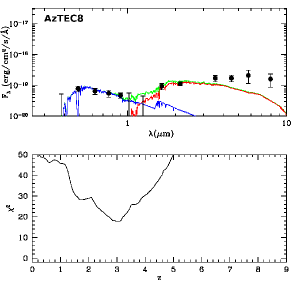
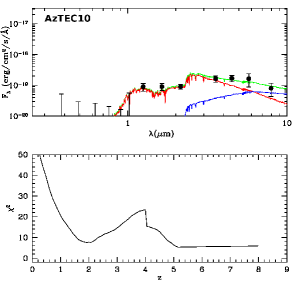
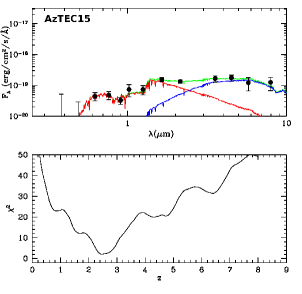
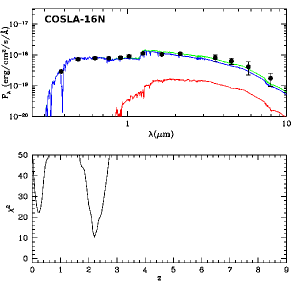
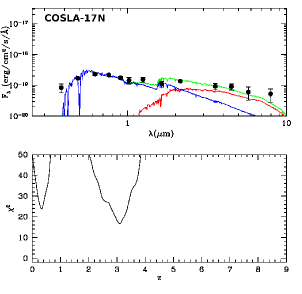
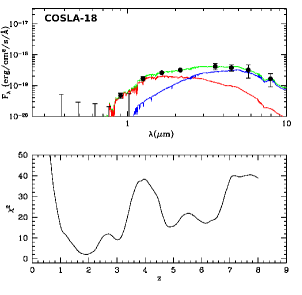
In this final appendix we provide, for each robust galaxy identification with optical-infrared data of sufficient quality, the photometric data overlaid with the best-fitting SED models, along with the associated plot of versus redshift , after marginalising over all other fitted parameters. The redshift corresponding to the minimum is the value of tabulated in Table 5, while the uncertainty in redshift is derived from the redshifts corresponding to above the minimum value.
|
|
|

|


|
|
|
|

|