Investigation of the dynamical slowing down process in soft glassy colloidal suspensions: comparisons with supercooled liquids
Abstract
The primary and secondary relaxation timescales of aging colloidal suspensions of Laponite are estimated from intensity autocorrelation functions obtained in dynamic light scattering (DLS) experiments. The dynamical slowing down of these relaxation processes are compared with observations in fragile supercooled liquids by establishing a one-to-one mapping between the waiting time since filtration of a Laponite suspension and the inverse of the temperature of a supercooled liquid that is rapidly quenched towards its glass transition temperature. New timescales, such as the Vogel time and the Kauzmann time, are extracted to describe the phenomenon of dynamical arrest in Laponite suspensions. In results that are strongly reminiscent of those extracted from supercooled liquids approaching their glass transitions, it is demonstrated that the Vogel time calculated for each Laponite concentration is approximately equal to the Kauzmann time, and that a strong coupling exists between the primary and secondary relaxation processes of aging Laponite suspensions. Furthermore, the experimental data presented here clearly demonstrates the self-similar nature of the aging dynamics of Laponite suspensions within a range of sample concentrations.
I Introduction
Relaxation processes in supercooled liquids are characterised by two-step decays gotze_mct . The faster () decay corresponds to the rattling of the particle within a cage formed by its neighbours, while the slower () decay corresponds to its cooperative diffusive dynamics between cages. The transport properties (i.e. viscosity, diffusivity etc.) and the relaxation timescales of a glass former change sharply as the glass transition is approached Ediger_Angell_Nagel_JPC_1996 . The primary or the -relaxation time becomes increasingly slow and diverges in the vicinity of the glass transition. The dependence of this relaxation time on temperature in a strong glass former is nearly Arrhenius and the degree of deviation from Arrhenius behaviour is measured as ‘fragility’. For fragile glass formers, the -relaxation time shows a Vogel-Fulcher-Tammann (VFT) dependence on temperature (), with the fragility index depending solely on the material Angell_Fragility_1991 . The density of potential energy minima of the configurational states in the potential energy landscape determines the strong or fragile behaviors of supercooled liquids Angell_JP_CS_1988 . Strong glasses have a lower density of minima and their entropy increases slowly with decreasing temperature, thereby resulting in nearly Arrhenius behavior Adam_Gibbs_JCP_1965 . On the contrary, fragile glasses have a larger density of minima which causes super-Arrhenius behavior of the -relaxation. Other secondary relaxation processes also simultaneously take place in the same temperature range. In supercooled liquids and molecular glasses, one of them is the Johari-Goldstein (JG) -relaxation process Johari_Goldstein_JChemPhys_1970 ; Johari_Goldstein_JChemPhys_1971 ; Thayyil_Ngai_Philosophical_Magazine_2008 ; Ngai_JCP_1998 , which is the slowest of the secondary relaxation processes.
In the last two decades, colloidal glasses have emerged as excellent model candidates for the study of glasses and glass formers. While supercooled liquids can be driven towards their glass transitions by rapidly quenching their temperatures, the glass transition in colloidal suspensions can be achieved by increasing the volume fraction . For a colloidal suspension of hard spheres, increasing towards a glass transition volume fraction plays the same role as supercooling a liquid towards its glass transition temperature Pusey_Van_Megen_Nature_1986 ; Marshall_Zukoski_JPC_1990 .
In recent years, colloidal glasses formed by the synthetic clay Laponite have been studied extensively bonn_epl ; Ruzicka_2004 ; ruzicka_review ; schosseler_PRE ; kaloun_PRE ; bandyopadhyay_prl ; tanaka_pre ; joshi_lang1 ; Negi_Osuji_PRE_2010 ; Angelini_SM_2013 . Interestingly, aging Laponite suspensions show many similarities with supercooled liquids and molecular glasses. These include the observation of well-separated fast and slow timescales Abou_Bonn_Meunier_PRE_2001 , the absence of thermorheological simplicity shahin_prl ; lcstruik , asymmetry in structural recovery following a step temperature change dhavale_SM ; kovacs_jps , probe size-dependent diffusion Strachan_et_al_PRE_2006 and the presence of more complex phenomena such as overaging lacks_prl ; bandy_SM . Laponite particles are monodisperse discs of diameter 25 nm and width 1 nm. In an aqueous medium, the dissociation of Na+ ions from the Laponite platelet results in negatively charged faces, while the edge of the platelet acquires a charge that depends on the pH of the medium. At a pH of 10, the edge of the Laponite platelet is estimated to have a weak positive charge tawari_edge . Overall, in an aqueous medium, Laponite particles interact via face-to-face, long range repulsions and edge-to-face, short range attractions tanaka_pre .
Remarkably, for 0.004, their aqueous suspensions undergo ergodicity breaking over a duration of days, with the free-flowing liquid getting transformed into a soft solid phase that can support its own weight.
Ruzicka et al. report the existence of two different concentration-dependent routes as Laponite clay suspensions approach the arrested state Ruzicka_2004 . They claim that at high clay concentrations, the system forms a repulsive Wigner glass whose elementary units are single Laponite platelets, while at low clay concentrations (1.0 wt% 2.0 wt%), clusters of Laponite platelets form an attractive gel. Interestingly, recent work on this subject suggests that the influence of attractive interactions cannot be ruled out even at high Laponite concentrations Ruzicka_PRL_2010 ; joshi_lang1 . Laponite suspensions also show very interesting phase behavior as the salt concentration is varied Ruzicka_Langmuir_2006 ; Ruzicka_Philosophical_Magazine_2007 . A gel or a glass state, and a nematic gel state are observed at low salt concentration as the clay concentration is increased. At very high ionic strengths, there is phase separation Tanaka_Bonn_PRE_2004 . Recent experimental observations and simulations in the gel state show that for very high waiting times, suspensions at weight concentration 1.0 wt% phase separate in the absence of salt into clay-rich and clay-poor phases, while suspensions at concentrations 1.0 wt% 2.0 wt% do not phase separate, giving rise to a true equilibrium gel obtained from an empty liquid Ruzicka_Nature_Materials_2011 .
In an aging Laponite clay suspension, the effective volume fraction changes spontaneously and continuously with waiting time due to the spontaneous evolution of inter-particle electrostatic interactions bandyopadhyay_prl ; bandyopadhyay_ssc ; joshi_lang1 . In this work, we perform dynamic light scattering (DLS) experiments to measure the time-evolution of the primary and secondary relaxation processes of aging Laponite suspensions. We use our data to establish connections between aging Laponite suspensions undergoing dynamical arrest and fragile supercooled liquids approaching their glass transitions. We show here that increasing the waiting time of aging Laponite suspensions is equivalent to decreasing the thermodynamic temperature of supercooled liquids. While the Vogel-Fulcher-Tammann (VFT) functional form (with mapped with sample age ) was demonstrated to work for the slower -relaxation timescale of aging Laponite suspensions Ruzicka_2004 , we show here that -relaxation follows an Arrhenius form (with also mapped with sample age ) as expected for supercooled liquids Ngai_JCP_1998 ; Stillinger_Science_1995 . A correspondence between temperature () and the waiting time since sample preparation () was reported in numerical studies of physical and chemical gelation Sciortino_et_al_Soft_Matter_2009 and in Monte Carlo simulations of patchy-particle models of Laponite discs Ruzicka_Nature_Materials_2011 . The role of thermodynamic temperature in the dynamical slowing down process of a colloidal glass produced by tethering polymers to the surface of inorganic nanoparticles has been investigated in the context of soft glassy rheology Archer_PRL_2011 .
We next propose new timescales (the timescale associated with the fast process, the Vogel time and the Kauzmann time ) to demonstrate several remarkable similarities that exist between supercooled liquids and soft glassy materials. We demonstrate a coupling between and the glass transition time Angell_Fragility_1991 . An analogous coupling between the glass transition temperature of a supercooled liquid and the activation energy corresponding to its -relaxation process has been suggested and experimentally verified for supercooled liquids Kudlik_et_al_EPL_1997 ; Kudlik_et_al_J_Non_Cryst_Solids_1998 ; Vyazovkin_Dranca_Phermaceutical_Research_2006 , but has never been demonstrated in soft materials. We also show that a simple linear correlation exists between the Vogel time and the Kauzmann time . This result is strongly reminiscent of a previous observation in supercooled liquids, where the Kauzmann temperature has been shown to be approximately equal to the Vogel temperature Jackle_Rep_Prog_Phys_1986 . We demonstrate the self-similar time-evolutions of the fast and slow relaxation times, the stretching exponent , and the width and non-Gaussian parameter ( and ) characterizing the distributions of the slow relaxation time with changing Laponite concentration. Finally, we show that the fragility index is concentration-independent and interpret this result in terms of the self-similar nature of the intricate potential energy landscape of aging Laponite suspensions.
II Materials, sample preparation and Experimental methods
All the experiments reported in this work are performed with Laponite RD procured from Southern Clay Products. Before every experiment, Laponite powder is dried in an oven at C for at least 16 hours. Appropriate amounts of powder are added slowly and carefully to double-distilled and deionized Millipore water of resistivity 18.2 M-cm. The mixture is stirred vigorously until it becomes optically clear. The resulting suspension is filtered using a syringe pump (Fusion 400, Chemyx Inc.) at a constant flow rate (3.0 ml/min) by passing through a 0.45 m Millipore Millex-HV syringe-driven filter unit. The filtered suspension is loaded and sealed in a cuvette for DLS experiments. Laponite suspensions of concentrations 2.0% w/v, 2.5% w/v, 3.0% w/v and 3.5% w/v are used in this study. Here, the concentration (%w/v) is the weight of Laponite in 100 ml of water. The mechanical properties of all the suspensions evolve spontaneously with time and exhibit the typical signatures of soft glassy rheology miyazaki_epl .
The DLS experiments are performed with a Brookhaven Instruments Corporation (BIC) BI-200SM spectrometer equipped with a 150 mW solid state laser (NdYVO4, Coherent Inc., Spectra Physics) having an emission wavelength of 532 nm. A refractive index-matching bath filled with decaline contains the cuvette filled with the sample. To avoid any kind of disturbance, the sample, once loaded, is not removed until the end of the experiment. The temperature of the bath is maintained at C by water circulation with a temperature controller (Polyscience Digital). A Brookhaven BI-9000AT Digital Autocorrelator is used to measure the intensity autocorrelation function of the light scattered from the samples. The intensity autocorrelation function is defined as , bern_pecora , where is the intensity at a delay time , is the normalized electric field autocorrelation function, is the coherence factor, and the angular brackets represents an average over time. Experiments were performed at different scattering angles (, , , , and ). Data acquired at are reported in the manuscript. Some representative data acquired at is shown in supporting information. The duration of data collection is kept long enough (2-3 minutes) to ensure a large photon count ( counts/run). Details of the data analysis protocols used in this work, for example in the calculations of the width and non-Gaussian parameters ( and ) characterizing the distributions of the slow relaxation times, have been provided in supporting information.
III Results and Discussions
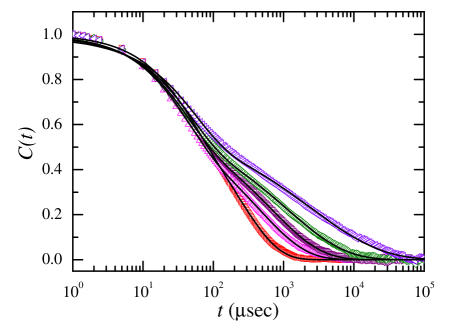
The relaxation dynamics of a medium can be analyzed by monitoring the temporal behavior of the intensity autocorrelation function . In figure 1, we plot the normalized intensity autocorrelation function, , for a 3.0% w/v Laponite suspension as a function of delay time, , for experiments carried out at different waiting times since filtration of the sample. shows a two-step decay, suggesting the presence of two distinct relaxation timescales. In addition, the decay in the autocorrelation function slows down progressively as the sample ages. For a glassy suspension, the two-step decay of can be described as a squared sum of an exponential and a stretched exponential decay given by Ruzicka_2004 :
| (1) |
The fits to equation 1 (shown by the solid lines in figure 1) describe the decays of the normalized autocorrelation functions for a range of waiting times and for all the aging Laponite suspensions studied in this work. The fits are used to estimate the two relaxation timescales: , the fast relaxation timescale that is associated with the secondary relaxation process, and , the slow timescale that is associated with the primary -relaxation process. In addition, the fits also yield values of the ‘stretching exponent’, , which is connected to the distribution of the -relaxation timescales.
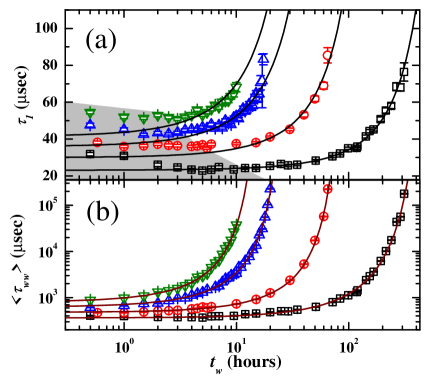
In figure 2(a), we plot the evolutions of with increasing for Laponite suspensions of different concentrations. Interestingly, evolves in two steps. At very small , initially decreases (shown by the shaded portion in figure 2(a)), before increasing rapidly at large . In addition, the evolution of shifts to smaller with increasing Laponite concentration.
Soon after mixing dry Laponite powder in water, hydration of clay takes place and water molecules diffuse into the interlayer gallery causing the clusters to swell. Filtration of these suspensions breaks the clusters. After filtration, these broken clusters undergo further fragmentation Joshi_JCP_2007 . In both cases, is expected to decrease until the swelling clusters or the fragmented parts undergo dynamical arrest due to strong inter-platelet interactions that evolve spontaneously Samim_Ranjini_Langmuir_2013 . The waiting time at which shows a minimum can therefore be considered as a measure of the time required for the onset of jamming. The waiting time associated with the minimum, , decreases with increase in Laponite concentration (figure S1 in supporting information). As the Laponite concentration increases, the increase in the number of cage-forming particles can be associated with a decrease in the free space that is required for cage expansion and swelling of the clusters. The minimum in () therefore shifts to smaller with increase in Laponite concentration.
The slow timescale is identified with the -relaxation process. The average value of , , where is the Euler Gamma function Lindsey_JCP_1980 . In figure 2(b), the evolution of is plotted as a function of for different concentrations of Laponite. In contrast to the non-monotonic behavior of , remains almost constant at small . At larger , shows a sharp increase. Furthermore, the evolution of shifts to larger with decrease in concentration of Laponite. The stretching exponents associated with are obtained from fits of the data to equation 1 and are plotted as a function of in figure S2 of supporting information. For small values of , is close to unity. However with increase in , decreases linearly, which signifies the broadening of the distribution associated with . The decrease in also shifts to smaller with increase in the concentration of Laponite.
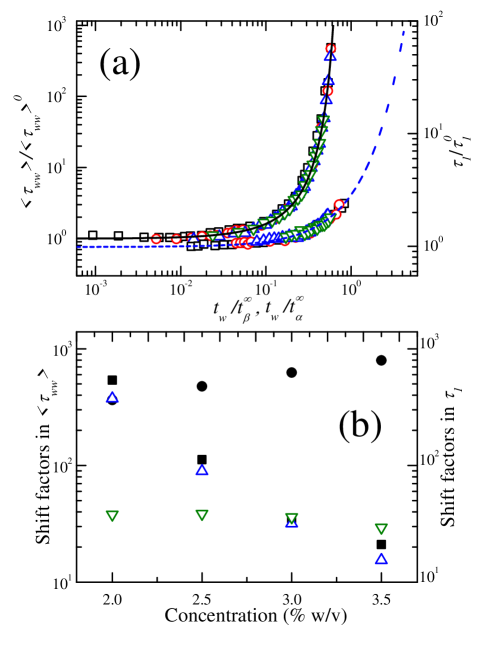
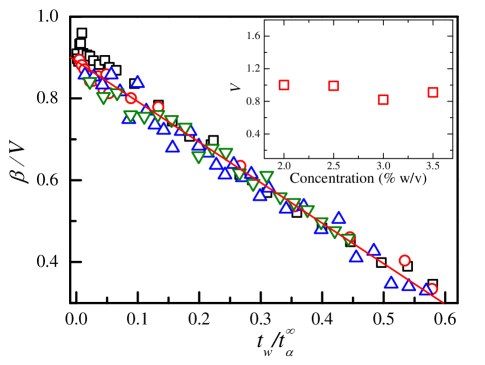
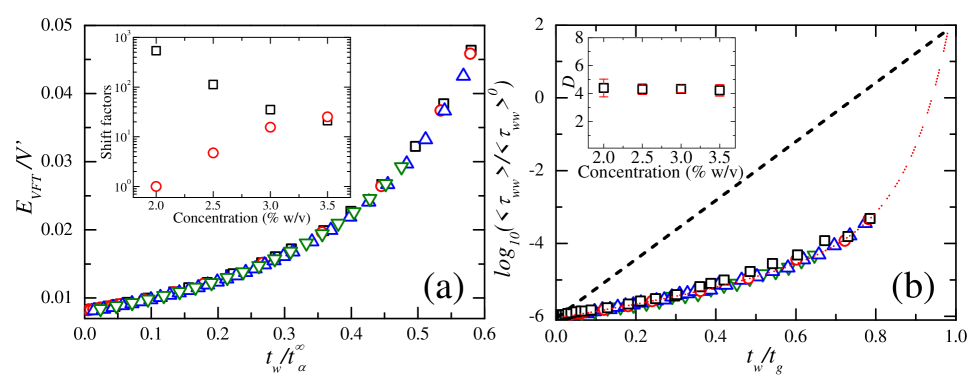
Because of self-similar curvatures in the evolutions of both (the monotonically increasing parts) and , the data plotted in figure 2 can be superposed upon horizontal and vertical shifting. This is shown in figure 3(a). The corresponding shift factors (the horizontal shift factors for and are denoted by and respectively, and the vertical shift factors for and are denoted by and respectively) are plotted in figure 3(b). It is observed that ( in figure 3(b)) increases with Laponite concentration. This observation can be explained by considering that at higher concentrations, the particles are more easily confined in deep wells and can therefore be kinetically constrained at earlier times. This confirms that the sluggishness of the -relaxation process increases with increasing Laponite concentration. In addition to and , also shows superposition after appropriate shifting through a vertical shift factor () obtained as the value of at . This is shown in figure 4.
The self-similarity and sharp enhancement of and with increase in are reminiscent of the changes that are observed in the fast () and slow () timescales of supercooled liquids that are quenched rapidly towards their glass transition temperatures gotze_mct ; Stillinger_Science_1995 . In supercooled liquids, the fast relaxation shows an Arrhenius dependence on temperature given by: . Here, is the fast relaxation time when , is the depth of the energy well associated with particle motion within the cage and is the Boltzmann constant. The slow -relaxation time, which represents the timescale associated with cage diffusion in supercooled liquids, demonstrates a dependence on temperature that is given by the Vogel-Fulcher-Tammann (VFT) law: . Here, the temperature at which diverges is called the Vogel temperature and is the fragility of the material. The Arrhenius equation is, therefore, a special case of the VFT equation in the limit 0 larson_rheology . Clearly, for nonzero values of , the slow timescale diverges more rapidly than the fast timescale . In figure 3(a), we see a very similar situation, wherein diverges much more rapidly when compared to . It can therefore be appreciated that the slowdown observed in aqueous Laponite suspensions is equivalent to that seen in supercooled liquids, with the inverse of the temperature () in the latter case mapped with the waiting time () in the former. In order to assess the validity of the proposed mapping, we write a modified Arrhenius equation:
| (2) |
Here, is a characteristic timescale associated with the slowdown of the fast relaxation process. Similarly, the modified VFT equation for the mean -relaxation time is written as:
| (3) |
where is identified as a Vogel time and is calculated from the distribution of slow relaxation times which is obtained by inverting the stretched exponential part of the autocorrelation decay. The expression for is given by Lindsey_JCP_1980 ,
| (4) |
In equations 2 and 3, the inverse of temperature in the Arrhenius and the VFT forms for supercooled liquids is mapped with and is mapped with . It can be seen in figures 2 and 3 that equations 2 and 3 fit the time-evolution of the and data extremely well.
The strong dependence of on Laponite concentration ( in figure 3(b)) can be explained by using a purely entropic picture. For particles, the configurational entropy , where is the number of minima in the potential energy surface and is the Boltzmann constant, while the total number of configurational states is , where is a positive number Stillinger_Science_1995 ; Sastry_Nature_2001 . As increases with Laponite concentration, the total number of configurational states and the configurational entropy increase rapidly with . This is accompanied by a decrease in the excluded volume available to the system. Increasing Laponite concentration therefore results in a decrease in , with the system being driven towards the glass transition at smaller waiting times. In contrast, ( in figure 3(b)) remains approximately independent of concentration as the local environment of a particle trapped in a cage does not change appreciably with change in concentration.
In an activated process, the dependence of a characteristic timescale on temperature is used to calculate the activation energy associated with that relaxation phenomenon. For an Arrhenius relaxation process represented by , is the activation energy and is the Boltzmann constant. For a VFT relaxation process described by , the apparent activation energy is given by: Ediger_Angell_Nagel_JPC_1996 ; Introduction_to_Polymer_Viscoelasticity . The activation energies associated with the modified Arrhenius and VFT processes in aging Laponite suspensions can be estimated by comparing with the corresponding relations for a supercooled liquid, with mapped with and with . These calculations, the details of which are supplied in supporting information, yield the following results:
| (5) |
and
| (6) |
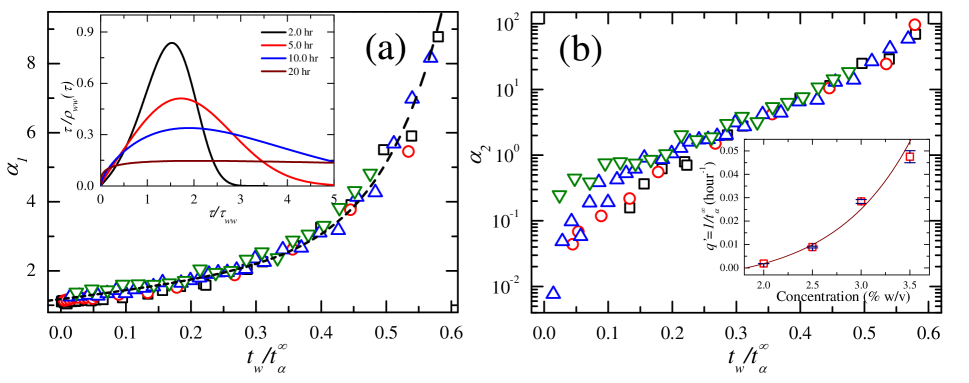
Here, equation 5 represents activation energy () associated with , while equation 6 represents the apparent activation energy () associated with . In these equations, is the Boltzmann constant, is the fragility parameter, and and are constants with dimensions [time][temperature]. It can be seen in the inset of figure S3 of supporting information that the activation energy associated with is independent of and shows a power-law dependence on concentration of Laponite (). , associated with , on the other hand, remains constant at small ), but shows a strong dependence on for large (figure S3 of supporting information). In addition, shifts to smaller waiting times with increase in concentration of Laponite. This agrees with our earlier results that Laponite suspensions of higher concentrations are driven faster towards an arrested state. Furthermore, our data implies that the evolution of the potential energy landscape with increasing is governed only by the -relaxation process. The self-similar nature of with changes in Laponite concentration is apparent when the data is scaled appropriately (figure 5(a)). The same horizontal shift factor , used earlier to superpose the data, is also used here.
Following the definition proposed by Angell for supercooled liquids, we define the glass transition time as the time since sample preparation at which = seconds for each Laponite concentration Angell_Fragility_1991 . The Angell plot corresponding to the -process of Laponite suspensions is shown in figure 5(b). Our data shows the same behaviour expected for fragile supercooled liquids (shown by the dotted line, where is mapped with as discussed in equations 2 and 3). The straight dashed line corresponds to strong glassformers for which the -relaxation timescale shows Arrhenius behavior. We identify the constant parameter in equation 3 as the fragility index Angell_Fragility_1991 ; Debenedetti_Nature_2001 ; Sastry_Nature_2001 . It is observed that the value of remains almost constant over the Laponite concentration range explored here (inset of figure 5(b)). It has been pointed out that caged particles can get trapped in deeper energy wells with increase in the concentration of a glassformer Goldstein_JCP_1969 . However, our observation that is independent of Laponite concentration suggests that the overall topology of the potential energy landscape of aging Laponite suspensions remains unchanged even when Laponite concentration is changed Stillinger_Science_1995 .
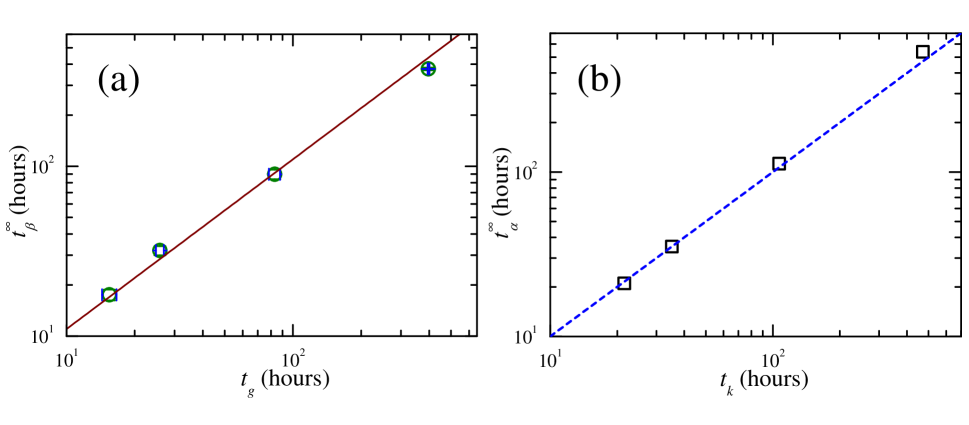
The simultaneous enhancements of the fast and slow timescales at high suggests the possibility that both these processes are strongly correlated with each other. In figure 6(a), the timescale associated with the fast relaxation process and obtained from fits to equation 2 is plotted vs. the glass transition time . It is observed that these two timescales are strongly coupled. A linear fit to the data (solid line in figure 6(a)) yields . For supercooled liquids, the activation energy associated with the -relaxation process was demonstrated to be proportional to the glass transition temperature , with the exact relationship being given by , where is the universal gas constant Kudlik_et_al_EPL_1997 ; Kudlik_et_al_J_Non_Cryst_Solids_1998 ; Vyazovkin_Dranca_Phermaceutical_Research_2006 . The relation obtained here between and is therefore strikingly similar to the observation in supercooled liquids. The fast relaxation process in Laponite glasses has previously been identified as a -relaxation process Abou_Bonn_Meunier_PRE_2001 . The coupling between and seen in figure 6(a) is reminiscent of the behaviour seen in supercooled liquids, where the Johari-Goldstein (JG) -relaxation is seen to be coupled with the -relaxation Ngai_JCP_1998 ; Kudlik_et_al_EPL_1997 ; Kudlik_et_al_J_Non_Cryst_Solids_1998 ; Vyazovkin_Dranca_Phermaceutical_Research_2006 . The assymetric nature of the Laponite particles, the observed Arrhenius dependence of the fast relaxation timescale on (figures 2(a) and 3(a)), and the decrease of the stretching exponent with increasing (figure S4 of supporting information), indicate a qualitative similarity of the fast relaxation process observed here and the Johari-Goldstein (JG) -relaxation process reported in supercooled liquids Ngai_JCP_1998 . We therefore speculate that the fast relaxation process observed in our experiments could be a JG -relaxation process.
The linear decrease of with (figure 4 and figure S2 in supporting information) is similar to the observation in fragile supercooled liquids where decreases linearly with Dixon_Nagel_PRL_1998 . We define a Kauzmann time , as an analog of the Kauzmann temperature for supercooled liquids, by extrapolating the waiting time to the value at which 0 Bohmer_Ngai_Angell_JCP_1993 . The linear correlation that is obtained between and () is plotted in figure 6(b). This is strongly reminiscent of the behaviour of supercooled liquids where an analogous relationship () holds Jackle_Rep_Prog_Phys_1986 . We have tabulated the values of , , and , estimated for the four different Laponite concentrations, in table T1 of supporting information.
We now analyze the distributions of the -relaxation timescales for various Laponite concentrations. The distributions of the -relaxation timescales for a 3.0% w/v Laponite suspension, , at four different values (2 hr, 5 hr, 10 hr and 20 hr) are estimated using equation 4 and are plotted in the inset of figure 7(a). In all the samples studied, the distributions broaden significantly with increasing waiting time . We define a width parameter as a measure of the broadening of . The values of calculated by us (details of the calculation of and table T2 of our estimates of values are supplied in supporting information) are seen to superpose when plotted vs. for all the Laponite concentrations in figure 7(a).
We next calculate the non-Gaussian parameter (details of the calculations of and table T3 of calculated values are supplied in supporting information) associated with the distribution of the -relaxation timescales . In figure 7(b), when plotted vs. , is seen to superpose for all four Laponite concentrations. It is seen that is very small when is small. However, increases sharply at higher for all four Laponite concentrations. In all the superpositions presented here, it is observed that the horizontal shift factor decreases rapidly with increasing Laponite concentration (figure 3(b) and the inset of figure 5(a)). The observed superpositions of and , which is achieved without any vertical shift for all the Laponite concentrations, is an additional verification of the self-similarity of the dynamic slowing down process. If is defined as a rate at which the system approaches the glass transition, it is seen from the inset of figure 7(b) that increases exponentially with concentration. This is connected to our earlier observation that Laponite particles are trapped in progressively deeper energy wells as the Laponite concentration is increased.
IV Conclusions
In this work, we have extracted the primary and secondary relaxation timescales of aging Laponite suspensions by modeling the intensity autocorrelation functions obtained from dynamic light scattering measurements. We have compared the dynamical slow-down process of these samples with that observed in fragile supercooled liquids. While colloidal suspensions of Laponite approach the glass transition spontaneously with increasing waiting time , supercooled liquids are obtained by quenching the temperature of a liquid towards its glass transition temperature at a rate that is rapid enough to avoid crystallization. It is proposed in the literature that the faster -relaxation process of a supercooled liquid exhibits an Arrhenius temperature-dependence, while the slower -relaxation time exhibits a VFT temperature-dependence gotze_mct . In our work, we have demonstrated remarkably striking similarities in the relaxation processes of soft colloidal suspensions approaching dynamical arrest and fragile supercooled liquids by performing a simple one-to-one mapping between the waiting time since filtration of an aging Laponite suspension and the inverse of the thermodynamic temperature of a supercooled liquid ().
We have identified the secondary and the primary relaxation processes of aging Laponite suspensions with, respectively, the and the -relaxation processes of fragile supercooled liquids. We observe here that the secondary relaxation process of aging Laponite suspensions exhibits several signatures of the Johari-Goldstein -relaxation process reported in supercooled liquids. Furthermore, we have shown that the evolutions of both the primary and secondary relaxation processes are self-similar with increasing Laponite concentration. Our estimates for the apparent activation energy corresponding to the -relaxation process, the widths of the distributions of the -relaxation timescales and the non-Gaussian parameters characterizing these distributions also confirm the self-similar dynamics of Laponite suspensions with increasing Laponite concentrations.
Several simple relations are known to exist among the different temperature scales (eg. the glass transition temperature , the Vogel temperature and the Kauzmann temperature ) and energy scales (eg. the activation energy corresponding to the relaxation process ) that characterize the glass transition of supercooled liquids. In this work, we have calculated the glass transition time Angell_Fragility_1991 , and have defined new timescales, such as the timescale corresponding to the secondary relaxation process , the Vogel time and the Kauzmann time , to characterize the dynamical slowing down process in Laponite suspensions. We demonstrate the existence of relations between these timescales that are strongly reminiscent of the relations that were established between the characteristic temperature/energy scales of supercooled liquids approaching their glass transitions.
A comparison of our data with the results obtained for suspensions of hard spheres near the glass transition shows that a suspension of Laponite platelets evolves in the same way with increasing waiting time (equation 3) as a suspension of hard spheres whose volume fraction is increased towards the random close packing fraction of =0.638 Marshall_Zukoski_JPC_1990 . The slowing down of the dynamics in hard sphere suspensions as therefore proceeds in the same manner as the slowing down in suspensions of charged Laponite platelets with . The inter-platelet interactions in aging Laponite suspensions evolve spontaneously with waiting time, resulting in an increase in the effective volume fraction and a simultaneous decrease in the accessible volume available to the system. This eventually leads to dynamical arrest. In hard sphere suspensions, the volume fraction plays the same role as the inverse of temperature in the glass transition of molecular glasses and supercooled liquids Pusey_Van_Megen_Nature_1986 ; Marshall_Zukoski_JPC_1990 . The mapping () established here demonstrates that aging Laponite suspensions, hard sphere glasses and fragile supercooled liquids approach their glass transitions in very similar manners. Our study therefore clearly confirms that aqueous suspensions of Laponite are model glass formers.
V Additional Material
V.1 Supporting Information
The following figures and tables are supplied in a supporting information file. Figure S1 shows the waiting times associated with the minima in vs. Laponite concentration. Figure S2 shows the time-evolutions of the stretching exponent for four Laponite concentrations. A disscussion on the derivations of equations 5 and 6 is included. Figure S3 shows the activation energies associated with the - and -relaxation processes for the same concentrations of Laponite. Figure S4 shows the decrease of the stretching exponent with increase in . Table T1 tabulates the values of , , and for the different Laponite concentrations. Details of the calculations of the width parameter and the non-Gaussian parameter are discussed. The values of and with increasing suspension ages for all the Laponite concentrations studied here are supplied in tabular form (tables T2 and T3). Figure S5 shows the intensity autocorrelation function at 60∘ for a 2.5% w/v sample at four different ages and fits of this data to equation 1. Figures S6 and S7 show the plots of the fast and the slow relaxation times and fits to equations 2 and 3 respectively at a scattering angle = 60∘. The diffusive behavior of the fast and slow relaxation times in 2.5% w/v Laponite suspension are shown in figures S8 and S9 respectively.
VI Acknowledgments
The authors are grateful to R. Basak for his help with the experiments.
References
- (1) W. Gotze and S. J. Sjorgen, Rep. Prog. Phys., 1992, 55, 241-376.
- (2) M. D. Ediger, C. A. Angell and S. R. Nagel, J. Phys. Chem., 1996, 100, 13200-13212.
- (3) C. A. Angell, J. Non-Cryst. Solids, 1991, 131-133, 13-31.
- (4) C. A. Angell, J. Phys. and Chem. of Solids, 1988, 49, 863-871.
- (5) G. Adam and J. H. Gibbs, J. Chem. Phys., 1965, 43, 139-146.
- (6) G. P. Johari and M. Goldstein, J. Chem. Phys., 1970, 53, 2372-2388.
- (7) G. P. Johari and M. Goldstein, J. Chem. Phys., 1971, 55, 4245-4252.
- (8) M. S. Thayyil, S. Capacciolia, D. Prevostoa and K. L. Ngai, Phil. Mag., 2008, 88, 4007-4013.
- (9) K. L. Ngai, J. Chem Phys., 1998, 109, 6982-6994.
- (10) P. N. Pusey and W. van Megen, Nature, 1986, 320, 340-342.
- (11) L. Marshall and C. F. Zukoski, J. Phys. Chem., 1990, 94, 1164-1171.
- (12) D. Bonn, H. Tanaka, G. Wegdam, H. Kellay and J. Meunier, Europhys. Lett., 1999, 45, 52-57.
-
(13)
B. Ruzicka, L. Zulian and G. Ruocco, J. Phys.: Condens. Matter, 2004, 16, S4993-S5002.
B. Ruzicka, L. Zulian and G. Ruocco, Phys. Rev. Lett., 2004, 93, 258301. - (14) B. Ruzicka and E. Zaccarelli, Soft Matter, 2011, 7, 1268-1286.
- (15) R. Bandyopadhyay, D. Liang, H. Yardimci, D. A. Sessoms, M. A. Borthwick, S. G. J. Mochrie, J. L. Harden and R. L. Leheny, Phys. Rev. Lett., 2004, 93, 228302.
- (16) F. Schosseler, S. Kaloun, M. Skouri and J. P. Munch, Phys. Rev. E, 2006, 73, 021401.
- (17) S. Kaloun, R. Skouri, M. Skouri, J. P. Munch and F. Schosseler, Phys. Rev. E, 2005, 72, 011403.
- (18) H. Tanaka, S. Jabbari-Farouji, J. Meunier and D. Bonn, Phys. Rev. E, 2005, 71, 021402.
- (19) A. Shahin and Y. M. Joshi, Langmuir, 2012, 28, 15674-15686.
- (20) A. S. Negi and C. O. Osuji, Phys. Rev. E, 2010, 82, 031404.
- (21) R. Angelini, L. Zulian, A. Fluerasu, A. Madsen, G. Ruocco and B. Ruzicka, Soft Matter, 2013, 9, 10955.
- (22) B. Abou, D. Bonn and J. Meunier, Phys. Rev. E, 2001, 64, 021510.
- (23) A. Shahin and Y. M. Joshi, Phys. Rev. Lett., 2011, 106, 038302.
- (24) L. C. E. Struik, Physical aging in amorphous polymers and other materials, (Elsevier, Houston, 1978).
- (25) T. P. Dhavale, S. Jadav and Y. M. Joshi, Soft Matter, 2013, 9, 7751-7756.
- (26) A. J. Kovacs, J. Polym. Sci., 1956, 30, 131-147.
- (27) D. R. Strachan, G. C. Kalur and S. R. Raghavan, Phys. Rev. E, 2006, 73, 041509.
- (28) D. J. Lacks and M. J. Osborne, Phys. Rev. Lett., 2004, 93, 255501.
- (29) R. Bandyopadhyay, P. H. Mohan and Y. M. Joshi, Soft Matter, 2010, 6, 1462-1466.
- (30) S. L. Tawari, D. L. Koch and C. Cohen, J.Colloid Interface Sci., 2001, 240, 54-66.
- (31) B. Ruzicka, L. Zulian, E. Zaccarelli, R. Angelini, M. Sztucki, A. Moussaid and G. Ruocco, Phys. Rev. Lett., 2010, 104, 085701.
- (32) B. Ruzicka, L. Zulian and G. Ruocco, Langmuir, 2006, 22, 1106-1111.
- (33) B. Ruzicka, L. Zulian and G. Ruocco, Phil. Mag., 2007, 87, 449-458.
- (34) H. Tanaka, J. Meunier and D. Bonn, Phys. Rev. E, 2004, 69, 031404.
- (35) B. Ruzicka, E. Zaccarelli, L. Zulian, R. Angelini, M. Sztucki, A. Moussad, T. Narayanan and F. Sciortino, Nat. Mater., 2011, 10, 56-60.
- (36) R. Bandyopadhyay, D. Liang, J. L. Harden and R. L. Leheny, Solid State Comm., 2006, 139, 589-598.
- (37) F. H. Stillinger, Science, 1995, 267, 1935-1939
- (38) P. Agarwal, S. Srivastava and L. A. Archer, Phys. Rev. Lett., 2011, 107, 268302.
- (39) F. Sciortino, C. D. Michele, S. Corezzi, J. Russo, E. Zaccarelli and P. Tartaglia, Soft Matter, 2009, 5, 2571-2575.
- (40) A. Kudlik, C. Tschirwitz, S. Benkhof, T. Blochowicz and E. Rssler, Europhys. Lett., 1997, 40, 649-654.
- (41) A. Kudlik, C. Tschirwitz, T. Blochowicz, S. Benkhof, E. Rssler, J. Non-Crystalline Solids, 1998, 235, 406-411.
- (42) S. Vyazovkin and I. Dranca, Pharm. Res., 2006, 23, 422-428.
- (43) J. Jckle, Rep. Prog. Phys., 1986, 49, 171-231.
- (44) K. Miyazaki, H. M. Wyss, D. A. Weitz and D. R. Reichman, Europhys. Lett., 2006, 75, 915-921.
- (45) B. J. Berne and R. Pecora, Dynamic light scattering: With applications to Chemistry, Biology, and Physics; John Wiley & Sons: New York, 1975; pp 12-18.
- (46) Y. M. Joshi, J. Chem. Phys., 2007, 127, 081102.
- (47) S. Ali and R. Bandyopadhyay, Langmuir, 2013, 29, 12663-12669.
- (48) C. P. Lindsey and G. D. Patterson, J. Chem. Phys., 1980, 73, 3348-3357.
- (49) R. G. Larson, The structure and rheology of complex fluids, Clarendon Press: Oxford, 1999.
- (50) S. Sastry, Nature, 2001, 409, 164-167.
- (51) M. T. Shaw and W. J. MacKnight, Introduction to polymer viscoelasticity, Wiley-Interscience, John Wiley & Sons, 205, pp. 271.
- (52) P. G. Debenedetti and F. H. Stillinger, Nature, 2001, 410, 259-267.
- (53) M. Goldstein, J. Chem. Phys., 1969, 51, 3728.
- (54) P. K. Dixon and S. R. Nagel, Phys. Rev. Lett., 1998, 61, 341-344.
- (55) R. Bhmer, K. L. Ngai, C. A. Angell and D. J. Plazek, J. Chem. Phys., 1993, 99, 4201-4209.
VII
See pages - of "SIv17"