Microscopic study of chiral rotation in odd-odd A 100 nuclei
Abstract
A systematic study of the doublet bands observed in odd-odd mass 100 is performed using the microscopic triaxial projected shell model approach. This mass region has depicted some novel features which are not observed in other mass regions, for instance, it has been observed that two chiral bands cross diabatically in 106Ag. It is demonstrated that this unique feature is due to crossing of the two 2-quasiparticle configurations having different intrinsic structures. Further, we provide a complete set of transition probabilities for all the six-isotopes studied in this work and it is shown that the predicted transitions are in good agreement with the available experimental data.
pacs:
21.60.Cs, 21.10.Hw, 21.10.Ky, 27.50.+eSpontaneous symmetry breaking (SSB) mechanism has played a central role to unravel the intrinsic structures of the quantum many-body systems. What all can be ascertained from the experimental data is a set of stationary states that are labeled in terms of conserved energy, angular-momentum and parity quantum numbers. The underlying mechanism behind the observed regularities in quantum spectra is only revealed through the SSB SF01 . For nuclear many-body problem, this has played a pivotal role in classifying the observed band structures. Majority of nuclei in the nuclear periodic chart are deformed with broken rotational symmetry in the intrinsic frame. This broken symmetry is the foundation of the popular Nilsson model, which has served an indispensable tool to identify the intrinsic structures of rotating nuclei with axial symmetry nilson . It is known that most of the deformed nuclei have axial symmetry with the projection of angular-momentum along the symmetry-axis a conserved quantum number. However, nuclei in transitional regions tend to break the axial symmetry and there are many observations which indicate that nuclei in these regions have triaxial shapes. The most prominent among these observations, which has attracted a considerable attention recently, is the existence of chiral symmetry SF97 ; TS04 . The occurrence of nuclear chirality will provide a unique test for the existence of stable triaxial nuclear deformation.
A large number of experimental investigations have been undertaken during the last few years to establish the existence of chiral rotation in several mass regions of the nuclear landscape. The candidate chiral bands have been explored and identified in odd-odd and odd-mass nuclei in and 130 regions KS01 ; CV04 ; TS03 ; AA01 ; SU03 . In these regions, chiral geometry is a result of the unique orientations of the angular-momenta vectors of protons, neutrons and the core. For odd-odd nuclei in 100 region, odd-proton is a hole-like and odd-neutron is a particle-like with their angular-momenta along long- and short-axis and the core angular-momentum is directed along the intermediate axis to minimize the energy. The resulting aplanar total angular-momentum can be arranged into left- or right-handed system, which are related to each other with chiral operator - a combination of time-reversal and rotation by . Chiral geometry in the laboratory frame manifests itself with the appearance of degenerate doublet bands. The properties of the chiral doublet bands have been interpreted using various theoretical approaches VD00 ; PO04 ; PRM ; RPA1 ; RPA2 . Although, these models have provided a reasonable description of the properties of chiral bands, however, there have been some puzzling observations that have remained unsolved. For instance, in 106Ag, the doublet bands cross diabatically with each other at spin, with moments of inertia of the two bands being quite different Ag0106 . However, in the neighboring isotopes, there is no such crossing and the moments of inertia of the two bands are similar. The purpose of the present study is to shed light on these unsolved issues using the microscopic triaxial projected shell model (TPSM) approach JS99 .
It has been demonstrated that TPSM provides an accurate description of the high-spin properties of triaxial rotating nuclei. In a recent study, TPSM approach has been generalized to multi-quasiparticle configurations and used to investigate the interplay between the vibrational and the quasi-particle excitation modes in 166-172Er JG11 . It was demonstrated that a low-lying band observed in these nuclei, the nature of which had remained unresolved, are built on triaxially-deformed two-quasiparticle states. This band is observed to interact with the -vibrational band and becomes favored at high angular-momenta for some Er-nuclei. More recently, TPSM approach has been generalized to study odd-odd 128Cs nucleus in the mass 130 region JG12 .
The basic philosophy in the TPSM approach is similar to that of spherical shell model with the only exception that deformed basis is employed rather than the spherical one. This allows to investigate heavier deformed nuclei with a small number of basis states. The basis space of the TPSM approach for odd-odd nuclei is composed of one-neutron and one-proton quasiparticle configurations
| (1) |
The above basis space is adequate to describe the chiral bands in odd-odd nuclei, which are based on one-proton and one-neutron quasiparticle configurations. The triaxial quasi-particle (qp)-vacuum in Eq. (1) is determined by diagonalization of the deformed Nilsson Hamiltonian and a subsequent BCS calculations. This defines the Nilsson+BCS triaxial qp-basis in the present work. The number of basis configurations depend on the number of levels near the respective Fermi levels of protons and neutrons.
| 104Ag | 106Ag | 104Rh | 106Rh | 98Tc | 100Tc | |
| 0.149 | 0.158 | 0.202 | 0.237 | 0.181 | 0.220 | |
| 30 | 30 | 30 | 33 | 31 | 34 |
The states obtained from the deformed Nilsson calculations don’t conserve rotational symmetry. To restore this symmetry, three-dimensional angular-momentum projection technique is applied. From each intrinsic state, , in (1) a band is generated through projection technique. The interaction between different bands with a given spin is taken into account by diagonalising the shell model Hamiltonian in the projected basis. The Hamiltonian used in the present work is
| (2) |
and the corresponding triaxial Nilsson Hamiltonian is given by
| (3) |
where is the spherical single-particle shell model Hamiltonian, which contains the spin-orbit force Ni69 . The second, third and fourth terms in Eq. (2) represent quadrupole-quadrupole, monopole-pairing, and quadrupole-pairing interactions, respectively.
The axial and triaxial terms of the Nilsson potential in Eq. 3 contain the parameters and , respectively. The strength of the quadrupole-quadrupole force is determined in such a way that the employed quadrupole deformation is same as obtained by the Hartree-Fock-Bogoliubov (HFB) procedure. The monopole-pairing force constants used in the calculations are given by
| (4) |
Finally, the quadrupole pairing strength is assumed to be proportional to the monopole strength, . All these interaction strengths are same as those used in our earlier study JG12 .
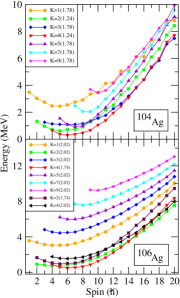
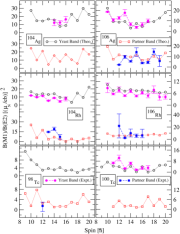
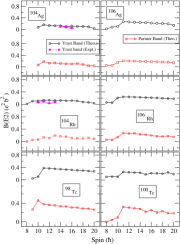
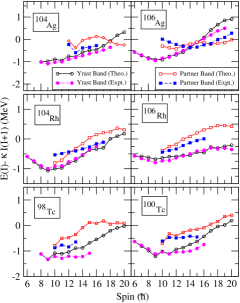
In the first stage of TPSM study, the triaxial basis space is constructed by solving three-dimensional Nilsson potential with deformation parameters, and . In the present work, the deformation used for the six odd-odd nuclei investigated are listed in Table 1 and have been adopted from the earlier studies on these nuclei Mn95 ; Ag0104 ; Ag0106 ; 104rh ; 106rh ; 98Tc ; 100Tc . The triaxial basis generated are projected onto good angular-momentum states through three-dimensional angular-momentum projection formalism RS80 . The projected basis are then employed to diagonalize the shell model Hamiltonian consisting of pairing plus quadrupole-quadrupole interaction terms. The projected energies, obtained after shell model diagonalization, for the doublet bands in six odd-odd nuclei are depicted and compared with the corresponding experimental data in Fig. 1. The energies have been subtracted by a core contribution so that the differences become more pronounced. It is evident from the figure that overall agreement between the calculated and the measured energies is quite remarkable. It is noted from Fig. 1 that theoretical results for 104Ag and 106Ag depict crossing of the yrast and the partner bands at I=18 and 15, respectively. The observed partner band in 104Ag is known only till I=16 and it is not possible to verify this crossing. However, for 106Ag the observed energies are available up to I=20 for both yrast and the partner band and the data clearly depicts the crossing of the two bands. This crossing of the two bands in 106Ag has been an unsolved problem and in order to shed light on the nature of this crossing, the band diagrams are plotted in Fig. 2 for the two studied Ag-isotopes.
In band diagrams projected energies, before mixing, with well defined angular-momentum and the projection (), obtained from the quasiparticle-configurations close to the Fermi surface, are plotted. These diagrams are quite instructive and provide a unique information on the intrinsic structures of the projected bands. It is noted from Fig. 2 that the lowest band in 104Ag has K=4 up to I=17 and then this band is crossed by another band having K=3, which originates from a different quasiparticle configuration. This figure also provides us a possible explanation as to why the partner band is not observed below I=12 as it is noted that for low-spin states, K=3 band is higher in energy and becomes unfavored. Of course, in the final analysis, the situation will be somewhat different due to band mixing, but we do expect that this overall behavior of the bands shall prevail. For 106Ag, the lowest band in bottom panel of Fig. 2 has K=4 till I=14 and then this band is crossed by K=2 band, which again originates from a different quasiparticle configuration as in 104Ag. Therefore, the reason for the observed diabatic crossing between the yrast and the partner bands in 106Ag is due to crossing of two states having different intrinsic quasiparticle configurations. In the final results after diagonalization, the bands are mixed at the crossing due to degeneracy, but below and above the crossing point, the two bands retain their individual configuration. It was, as matter of fact, conjectured in the experimental paper Ag0106 that yrast and partner bands in 106Ag may have different quasiparticle configurations and the present theoretical analysis confirms the postulation.
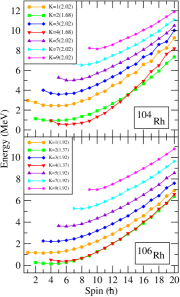
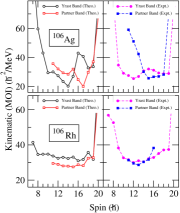
In Fig. 3, the band diagrams for two studied isotopes of 104Rh and 106Rh are displayed and it is quite interesting to note that both these isotopes depict crossing between the lowest two bands as for the Ag-isotopes. However, the important difference is that, in contrast to the Ag-isotopes, Rh-isotopes have lowest two bands belonging to the same intrinsic configuration and projected to different K-states. The lowest two bands mix strongly due to their identical nature and consequently the observed yrast and the parnter bands don’t depict diabatic crossings in the Rh-isotopes. In order to elucidate that the structures of the doublet bands in Ag- and Rh-isotopes are quite different, even after mixing, the moments of inertia of 106Ag and 106Rh, obtained from the projected energies after diagonalization, are displayed in Fig. 4 as illustrative examples. It is quite evident from this figure that moments of inertia of the yrast and the partner bands for 106Rh are similar, both theoretical and experimental, but for 106Ag are quite different. The band diagrams for the two studied Tc-isotopes don’t depict any band crossings and are not discussed here.
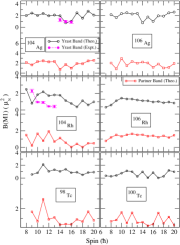
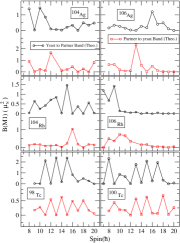
We have also evaluated transition probabilities using the projected wavefunctions after diagonalization with the expressions given in ref. JG12 . The parameters of , and the effective charges of and have been employed as in our earlier work JG12 . The calculated transition probabilities are provided in Figs. 5 to 8. In Fig. 5, B(M1)/B(E2) ratios of the yrast and the partner bands are displayed for all the studied isotopes. The calculated ratios are noted to be in good agreement with the available experimental data. B(E2) and B(M1) transitions obtained from the TPSM study are separately shown in Figs. 6 and 7. B(E2) transitions for 104Ag depict a constant behavior as a function spin and for 106Ag there is an increasing trend at low-spin, but for higher spins, B(E2)’s are again constant. B(E2) transitions for 104Rh and 106Rh have similar behavior as those of corresponding Ag-isotopes. Both 98Tc and 100Tc, show increasing trend in B(E2) for low spins and for higher spins, constant behavior is again observed. The in-band B(M1) transition probabilities, shown in Fig. 7, depict odd-even staggering as expected for chiral geometry. The available experimental data, also shown in Fig. 7, demonstrate a nice agreement for 104Ag but discrepancies are noted for 104Rh. More data is clearly required to probe the limitations of the TPSM approach. The calculated inter-band transitions are depicted in Fig. 8 and have opposite phase to those of in-band transition of Fig. 7, as expected for the chiral bands. It has been demonstrated in a simple model study that some special selection rules are obeyed by the transition probabilities in the chiral limit TS04 , in particular, the in-band B(M1) transitions have opposite phase to that of inter-band transitions. Although, these selection rules are not exactly applicable to the present realistic model study, it is expected that these rules be approximately satisfied.
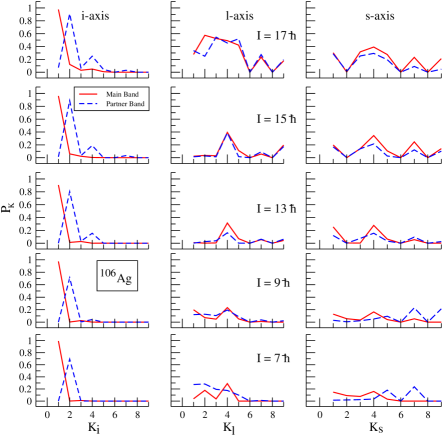
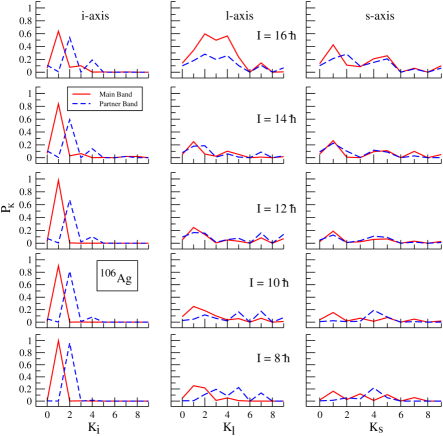
In order to probe the chirality of the nuclei studied in the present work, we have evaluated the K-distributions of the wavefunctions for the doublet bands and as an illustrative example, the results are presented for 106Ag. The projections along the quantization axis of intermediate, and short, are simply obtained by using the -values of and qi09 . In the present TPSM approach, as compared to the particle-rotor, the projected basis are not orthogonal and in Figs. 9 and 10 only the diagonal components of the expression :
| (5) |
are shown. In the above equation, are the amplitudes of the yrast- and the partner-band wavefunctions.
Figs. 9 and 10 provide the diagonal K-distributions for the projection of the total angular momentum along the intermediate , long and short quantization axis for odd- and even- angular-momentum states, respectively. We interpret as a measure for the probability of the projection of the total angular momentum on the respective axis and its distributions in the following manner. The g9/2 proton hole tends to align its with the l-axis and the h11/2 neutron particle tends to align its with the s-axis. The projections of of the two quasiparticles generate part of and , respectively. The collective angular momentum provides the other part, which increases with . Whereas at the two partner bands (blue and red) look different, they become very similar with increasing . The distributions are peaked at for the yrast band and for the partner band. For both bands the component is very small. This means that there is no tunneling between the upper and lower hemispheres with respect to the s-l plane, which reflects the fact that the two bands are regular sequences. The further discussion can be restricted to the upper hemisphere . For the distributions of the yrast and partner band contain only one component =1 and 2, respectively. This means that the probability does not dependent on the conjugate angle , which rotates the vector of the total angular momentum about the i-axis. In the case of partner band, a second component at develops with increasing . The probability function of the superposition : with 111The case can be disregarded because the orientation of the of the proton hole and the neutron particle along respective long and short axes causes a preferred orientation of at about between these axes. has maxima at and minima at . The appearance of these maxima signals that chirality develops FN00 . If chiral symmetry is spontaneously broken, the angular momentum vector lies outside the three principal planes of the triaxial density. There are four equivalent orientations in the upper hemisphere, two left-handed and two right-handed. Tunneling between these four positions restores chiral symmetry for eigenstates of the Hamiltonian, which is localized around these positions. The tunneling decreases with the length of the vector and chirality becomes more apparent. It is to be noted that yrast band does not develop the same signature of chirality and only a slight admixture of =3 is seen in the even- states. The fact that the yrast band contains only odd and the partner band only even explains why the two band cross without mixing and repel each other.
In conclusion, in the present study a systematic investigation of the chiral doublet bands observed in odd-odd 100 region has been carried out using the recently developed multi-quasiparticle triaxial projected shell model approach. The purpose of the work was to investigate some puzzling observations reported in this mass region. It has been demonstrated that the observed crossing of the yrast and the partner bands in 106Ag is due to the crossing of the two 2-quasiparticle states having different intrinsic configuration. Further, it is predicted that a similar crossing for the yrast and the partner bands occurs for 104Ag at a higher angular-momentum of I=18.
References
- (1) S. Frauendorf, Rev. Mod. Phys. 73, 463 (2001).
- (2) S. G. Nilsson, Dan. Mat. Fys. Medd. 29, 16 (1955).
- (3) S. Frauendorf and J. Meng, Nucl. Phys. A 617, 131 (1997).
- (4) T. Koike, K. Starosta, and I. Hamamoto, Phys. Rev. Lett. 17, 172502 (2004).
- (5) K. Starosta et al., Phys. Rev. Lett. 86, 971 (2001).
- (6) C. Vaman et al., Phys. Rev. Lett. 92, 032501 (2001).
- (7) T. Koike, K. Starosta, C. J. Chiara, D. B. Fossan, and D. R. LaFosse, Phys. Rev. C 67, 044319 (2003).
- (8) A. A. Hecht et al., Phys. Rev. C 63, 051302 (2001).
- (9) S. Zhu et al., Phys. Rev. Lett. 91, 132501 (2003).
- (10) V. I. Dimitrov, S. Frauendorf, and F. Dönau, Phys. Rev. Lett. 84, 5732 (2000).
- (11) P. Olbratowski, J. Dobazewski, J. Dudek, and W. Plöciennik, Phys. Rev. Lett. 93, 052501 (2004).
- (12) S. Q. Zhang, B. Qi, S. Y. Wang, and J. Meng, Phys. Rev. C 75, 044307 (2007).
- (13) S. Mukhopadhyay et al., Phys. Rev Lett. 99, 172501 (2007).
- (14) D. Almehed, F. Dönau, and S. Frauendorf, Phys. Rev. C 83, 054308 (2011).
- (15) P. Joshi et al., Phys. Rev. Lett. 98, 102501 (2007).
- (16) J. A. Sheikh and K. Hara, Phys. Rev. Lett. 82, 3968 (1999).
- (17) J. A. Sheikh, G. H. Bhat, Y.-X. Liu, F.-Q. Chen, and Y. Sun, Phys. Rev. C 84, 054314 (2011).
- (18) G. H. Bhat, J. A. Sheikh, and R. Palit, Phys. Lett. B 707, 250 (2012).
- (19) S. G. Nilsson et al., Nucl. Phys. A 131, 1 (1969).
- (20) P. Möller and J. R. Nix, At. Data Nucl. Data Tables 59, 185 (1995). 1
- (21) P. Datta et al., Phys. Rev. C 69, 044317 (2004).
- (22) J. Peng, J. Meng, and S. Q. Zhang, Chin. Phys. Lett. 20, 8 (2003).
- (23) P. Joshi et al., Phys. Lett. B 595, 135 (2004).
- (24) H. B. Ding, S. J. Zhu, J. G. Wang et al., Chin. Phys. Lett. 27, 072501 (2010).
- (25) P. Joshi et al., Eur. Phys. J. A 24, 23 (2005).
- (26) P. Ring and P. Schuck, The Nuclear Many-Body Problem (Springer, New York, 1980).
- (27) T. Suzuki et al., Phys. Rev. C 78, 031302(R) (2008).
- (28) B. Qi et al., Phys. Lett. B 675, 175 (2009).
- (29) S. Frauendorf, Nucl. Phys. A 677, 115 (2000).