Community Specific Temporal Topic Discovery
from Social Media
Abstract
Studying temporal dynamics of topics in social media is very useful to understand online user behaviors. Most of the existing work on this subject usually monitors the global trends, ignoring variation among communities. Since users from different communities tend to have varying tastes and interests, capturing community-level temporal change can improve the understanding and management of social content. Additionally, it can further facilitate the applications such as community discovery, temporal prediction and online marketing. However, this kind of extraction becomes challenging due to the intricate interactions between community and topic, and intractable computational complexity.
In this paper, we take a unified solution towards the community-level topic dynamic extraction. A probabilistic model, CosTot (Community Specific Topics-over-Time) is proposed to uncover the hidden topics and communities, as well as capture community-specific temporal dynamics. Specifically, CosTot considers text, time, and network information simultaneously, and well discovers the interactions between community and topic over time. We then discuss the approximate inference implementation to enable scalable computation of model parameters, especially for large social data. Based on this, the application layer support for multi-scale temporal analysis and community exploration is also investigated.
We conduct extensive experimental studies on a large real microblog dataset, and demonstrate the superiority of proposed model on tasks of time stamp prediction, link prediction and topic perplexity.
1 Introduction
With the prevalence of online social networks, such as Twitter and Facebook, social media has become a ubiquitous part of people’s daily lives. It provides a platform for users to post short and quick-updated texts, exhibiting rich temporal dynamics. Understanding these dynamics provides important insights into people’s changing online behaviors. Extensive research is devoted to uncover the temporal dynamics of online content [11, 26, 23].
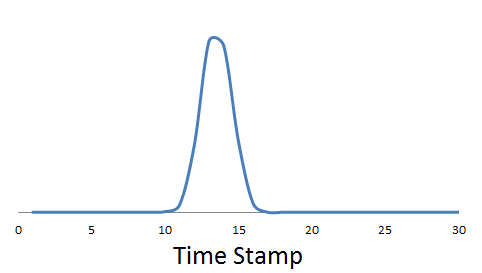
However, most of these existing work only explores global temporal variation, or the overall trends of topics. This ignores an important aspect of social media—the communities. A community is a collection of users with more or/and better interactions amongst its members than the rest of the global network [10]. Communities play a crucial role in social media, and provide the basis for user participation and engagement. Members in the same community typically bear similar content preferences and often communicate on shared topics [21, 20]. Given that the content of social media is so dynamic, it is expected that different communities tend to have different temporal dynamics of topics. One example from our experiments on the microblog data is illustrated in Figure 1, where we show the temporal distributions of topic “food security” in a community interested in “food”, and another community mainly focusing on “law”, respectively. We can clearly observe different patterns. The huge burst in community “law” coincides with the scandal of New Zealand substandard milk powder erupted on Jan 25th, 2013. By distinguishing the patterns of temporal variations across different communities, we gain deeper insights on how topics change over time, and how different pieces of content attract attentions from different communities. This can be potentially used for various applications. For instance, in online marketing, advertisers are allowed to achieve exact targeting for their advertisements with different subjects, or design community-specific content to effectively catch the eyes of community members.
 |
 |
Extracting community-specific temporal dynamics of topics can be very challenging. First, user community membership is often unknown, and the topics are also hidden. With the boom of both links and text in social media, it is necessary to extract community structures and latent topics simultaneously to attain a complete view of the social media. However, even though there are a bulk of studies on community detection and topic modeling respectively, only a limited number of work [12, 8] aims at jointly modeling these two important aspects. Furthermore, the interactions between community and topic are not straightforward to model. For example, communities in [12] do not have direct relations with topics, and in [8] one community corresponds to only one topic, violating the fact that a community in social media typically has varying degrees of interests in different topics. Second, human activities are highly volatile, especially on the online social networks where diverse content grows and fades rapidly over time. Although the aggregate temporal dynamics of individual behaviors may exhibit certain patterns, different communities with various interests tend to have their own temporal patterns. Third, the unprecedented data scale, including enormous volume of text and large sparse network, poses new computational challenges.
In this paper, we propose a probabilistic framework to address the above challenges. A probabilistic longitudinal model, CosTot (Community Specific Topics-over-Time) is developed to uncover the hidden topics and communities, as well as capture the community-specific temporal topic variations, from large-scale social media data. Our model defines a generative process for text, time and network to accurately characterize social media. Specifically, our model assumes that 1) each user can belong to multiple communities with different degrees of affiliation strength; 2) each community can have varying levels of interests in multiple topics; 3) each topic exhibits different temporal variations within different communities, and these variations are determined by the content of user posts along the time line. Different from existing temporal models such as Topics over Time (TOT) [23], CosTot can provide a finer-grained exploration of community-specific temporal dynamics of topics. CosTot is also more accurate than [8] in terms of modeling the correlation between community and topic by allowing communities to have mixture of topics rather than one-to-one correspondence. To enable our proposed CosTot scalable to large-scale social media datasets, we design a Gibbs Sampler: by implicitly modeling negative links in Bayesian prior, it takes, in each iteration, linear time in terms of the size of total words and number of positive links in the dataset. It can usually converge after a small number of iterations in our experiments.
We then deploy our approach to facilitate a set of applications on real microblog data. The patterns and knowledge learnt by CosTot enables the application layer to explore fine-grained topic temporal dynamics, analyze community temporal characteristics, as well as detect bursty events.
We further conduct extensive experiments on both synthetic and large-scale real datasets to evaluate the performance of our proposed method against state-of-the-art approaches. The real dataset consists of M posts generated by K users between 12/01/2012 to 02/28/2013. The results show the superiority of our method in terms of time prediction, link prediction and text perplexity, which indicates the advantage of CosTot in modeling temporal dynamics, network structure and text, respectively.
To summarize, we make the following contributions in our work.
-
1.
We identify the problem of community-specific topic dynamic extraction from social media data with text, time and network. The rich features and interaction can be used in the framework of new setting. To the best of our knowledge, such a problem has not been investigated before.
-
2.
We propose a unified probabilistic model, CosTot, which uncovers the topics and communities as well as captures the community-specific temporal dynamics of topics. We well study the features required for this model, and design an efficient inference algorithm to guarantee the scalability of our method.
-
3.
We deploy our approach to facilitate a set of applications on real social media data. We also present a comprehensive study of community-specific topic temporal variations, and show its usefulness to social media analysis.
-
4.
We conduct extensive experiments to evaluate the performance of our approach on large-scale real dataset. The results show the superiority of our model in terms of modeling text, network structure and temporal dynamics.
The rest of the paper is organized as follows: Section 2 reviews related literature;Section 3 formulates the problem, and introduces the proposed model and the inference algorithm; Section 4 reveals the analysis and applications enabled by the proposed new model; Section 5 presents our experimental results; and finally we conclude this paper and outline future work.
2 Related Work
In this section, we describe the related work in two areas: temporal dynamics of topics and community detection.
Temporal Dynamics of Topics: Topic models, such as latent Dirichlet allocation (LDA) [3] are usually utilized to find latent topics from text collections. In topic models, documents are modeled as a distribution over a shared set of topics, while topics themselves are distributions over words. Modeling temporal dynamics using topic models has attracted huge interest. A number of temporal topic models were proposed. Topics Over Time (TOT) [23] models the text and time stamp of a document jointly, assuming that latent topics generate time stamp according to a Beta distribution. One main shortcoming of Beta distribution is that it is unimodal, and thus limits the available patterns of topic temporal variation. TOT can also be seen as a special form of a more flexible model, supervised latent Dirichlet allocation (sLDA) [15]. Another set of approaches [2, 30, 19] makes Markovian assumption on topic variation. They divide time into epoches, and assume that topics evolve based on their states in the previous epoch,
In addition to topic models, there are also a bulk of other approaches modeling temporal variation of information diffusion. [26] develops the K-Spectral Centroid (K-SC) clustering algorithm which finds six classes of patterns of temporal variation. [14] proposes SPICKM, a flexible analytical model that generalizes and explains earlier theoretical models for the rise and fall patterns of influence propagation.
A closely related line of work to temporal dynamics of topics is bursty event detection [9, 27, 5, 29]. More specifically, [5] applies a state machine-based method to detect bursty topics discovered by TimeUserLDA [5]. [29] simultaneously detects stable topics (e.g. topics on user interest) and bursty topics (e.g. topics on emergencies) in a unified PLSA-based model.
Our work here is distinct from all the above methods as we not only find the global trends of topics, but more importantly distinguish patterns of temporal variation across different communities, and thus provide a more thorough and fine-grained view for temporal characteristics of social media. [11] follows a similar line by tracking opinion shift of members from two different groups, whereas a group is defined by some pre-defined features and is far away from the network community as our work.
Community Detection: This has been a hot topic, especially in recent social community analysis [10]. Numerous techniques have been developed to detect disjoint communities, i.e., each user in the network is assigned to a single community. However, in real life users are usually characterized by multiple community memberships, leading to overlapping communities. A review and comparative study of overlapping community detection is presented by [25]. Among all these work, blockmodeling [6] is based on statistical inference, and [1] introduces a mixed membership stochastic blockmodel in which each user has a probability distribution over communities drawn from a Dirichlet distribution. Different from our approach, these work uses network structures alone to extract communities.
A growing number of recent papers incorporate both the network structure and content to improve community detection performance. For example, Topic-Link LDA [12] jointly models underlying topics of documents and author communities, and achieves good performance in link prediction task. However, it does not uncover the relations between communities and topics. There is also a line of work aiming at modeling documents and links between them (e.g. citations), such as Pairwise-Link-LDA and Link-PLSA-LDA [17], RTM [4] and PMTLM [28].
In these models, words and links are both generated by the same latent factor, which can be thought of as communities when generating links, and as topics when generating words. Hence there is a one-to-one correspondence between communities and topics. In contrast, our approach allows each community to have a mixture of topics, which is more reasonable due to the fact that communities in social media tend to have multiple interests.
3 A Probabilistic Model for Community Specific Topic Dynamics
In this section, we introduce our framework for community-specific temporal dynamic discovery in social media, which can effectively support applications of temporal understanding and community analysis. We first formally define the problem we are interested in, then we propose a probabilistic model to uncover hidden topics and communities, as well as capture community-level topic temporal variations. Based on the model, we further design an efficient approximate inference algorithm.
3.1 Problem Formulation
We consider a social network consisting of users. Each user is associated with two types of features.
-
1.
Text Data with Time Stamps: a set of posts generated by user . Each post contains a bag of words from a given vocabulary, along with a time stamp , meaning that user generated post at time .
-
2.
Network Data: network links between and other users. Each link represents the social relationship between user and user . While we can adapt our model to describe either directed links or undirected links, we focus on directed links in this paper, since this is more common in microblog platforms such as twitter and weibo where means user follows user . We assume the links between users are constant within the time period we focus on. (We would like to relax this assumption in the future.)
A community has two components: a topic probability vector where each component represents the probability that a post from the community is related with corresponding topic , and a link formation probability vector where each component is the probability that a user in community follows a user in community . Here is the total number of communities.
Each user can belong to different communities (mixed membership). That is to say, each user is associated with a community probability vector .
We define a topic as a multinomial distribution over the vocabulary, denoted as . Here is the number of topics. For each topic , the community-specific temporal dynamics is represented by a set of multinomial vectors , each of which represents the time variation of topic within the corresponding community, i.e. a probability distribution over discrete time slices. This kind of vector represents how the popularity or attention to topic in community changes over time.
Given the text data with time stamps and network data in social media, our goal is to uncover hidden communities and topics, and infer the community-specific temporal dynamics of topics. This extraction can improve the understanding of information changes and community characteristics, which further benefit several important tasks in social media, e.g., link prediction, time stamp prediction and multi-scale dynamic analysis.
3.2 Framework Overview
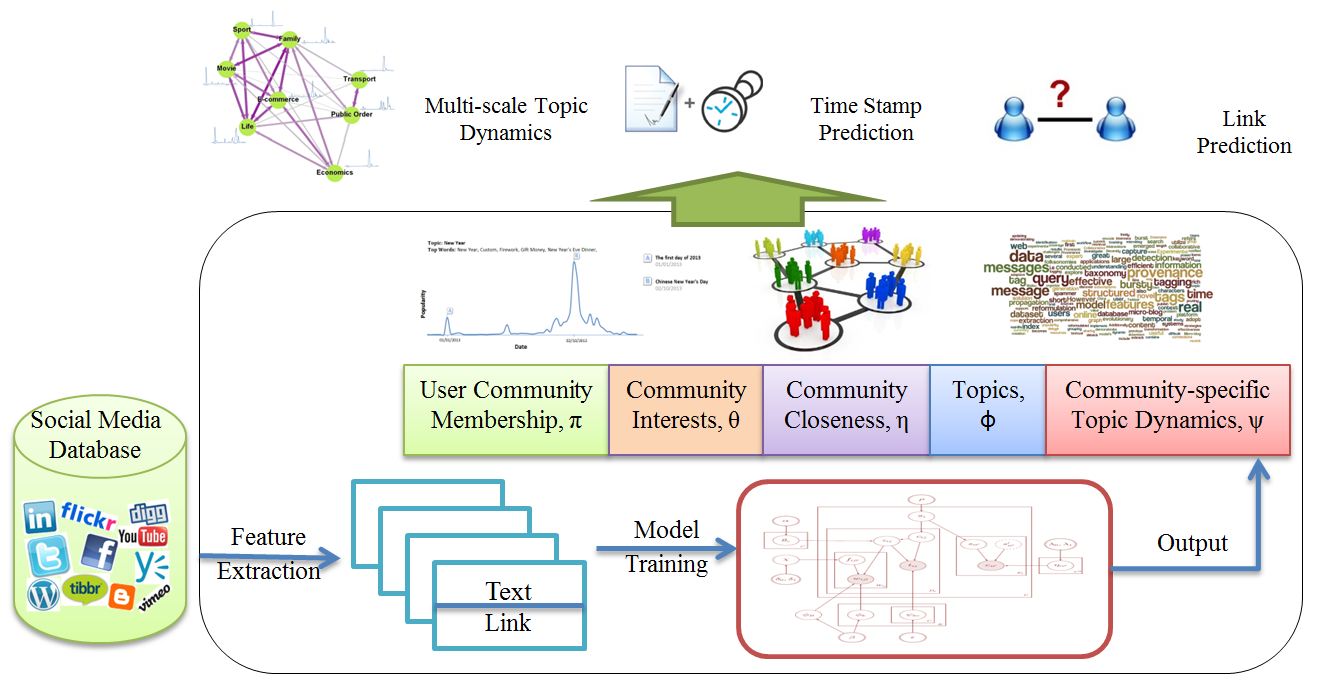
In this paper, we propose a probabilistic framework to achieve these goals and support the upper layer applications. The topics and communities are both hidden factors to be extracted, and the correlation between them are always omitted due to the modeling and inference complexity. Here we use a multiple stage approach to tackle this challenge. Specifically, our work can be listed as the following stages, and the framework is shown in Figure 2.
-
1.
Feature Extraction: We extract the text and network features of users from raw social media records. Here we discretize time line by dividing the time span of all users’ posts into time slices. We then select the records from each consecutive time slots, and associate each post with corresponding time stamp.
-
2.
Model Training: We introduce a probabilistic model to uncover the correlations between communities and topics over time. In this model, we combine the community extraction, topic identification, and community-specific topic dynamic discovery in a unified way. Though seeming complex, we tackle it with a well defined multiple component strategy and design an effective inference algorithm.
-
3.
Model Output: We can get the temporal, topic and community information from the previous designed probabilistic model. We organize these intermediate output for later process.
-
4.
Dynamic Analysis: The probabilistic model enables a set of novel applications based on the new data extraction. For example, we are allowed to gain a multi-scale view of topic temporal dynamics. In addition, by utilizing the fine-grained data representation, our approach further improves the extensively studied tasks of time and link prediction. We demonstrate how our approach supports these various applications in Section 4.
For the model training part, we can enumerate the requirements and necessary steps towards this goal.
-
1.
For each user , we need to infer the community probabilities .
-
2.
For each community , we are required to infer the topic probabilities , and link probabilities ;
-
3.
For each topic , infer the word probabilities . This is necessary for topic representation.
-
4.
Infer the community-specific temporal dynamics of each topic within each community . Based on the above three steps, we can unify them into the final stage.
3.3 Community Specific Topics-Over-Time
Model
Here we describe the proposed model, CosTot (Community Specific Topics-over-Time), later we will show how to perform inference with this model using a Gibbs sampling algorithm which scales linearly with respect to the size of data.
CosTot is a latent space model jointly over text, time and network, and infers the patterns mentioned above. Some of its building blocks are inspired by earlier successful attempts, including the Mixed Membership Stochastic Blockmodel (MMSB) [1] over networks, and Topics over Time (TOT) [23] over text and time. Specifically, CosTot contains three closely linked components. The user membership component models user membership to communities; the network component explains the link structure; the text-time component uncovers the semantic contexts, and captures the temporal variations in different communities. We will describe each component in detail later in this section.
Our model is summarized as the generative process shown in Algorithm 1. Figure 3 displays its graphical model representation.
Sample foreground-background distribution,
.
Sample the background word topic, .
For each topic , , {enumerate*}
Sample the distribution over words, .
For each community , , {enumerate*}
Sample the distribution over time stamps, .
For each community , , {enumerate*}
Sample the distribution over topics, .
For each community , , {enumerate*}
Sample community-community link probability,
.
For each user {enumerate*}
Sample the distribution over communities,
.
For each post , {enumerate*}
Sample community indicator, .
Sample topic indicator, .
For each word , {enumerate*}
Sample foreground indicator, .
Sample word, if , or if .
Sample time stamp, .
For each user {enumerate*}
Sample community indicator, .
Sample community indicator, .
Sample link, .
User membership component. Our proposed model uses a mixed membership approach [1], to capture the fact that people bear multiple roles in social media and their behaviors are influenced by different community context [25]. Note that in our model user membership integrates two aspects of user behaviors, i.e., posting (which generates text) and friending/following (which generates links). It is coherent with the observation that members in a community not only have denser links among each other than those from different communities, but also tend to be interested in similar topics.
For each user , we would like to infer the probability that belongs to each of the communities. Hence is associated with a community probability vector . Each post is assigned to a single community , denoting the community membership of user when she writes the post. In addition, each link is associated with two communities and , one for each of the two users and respectively, denoting their community memberships when user builds relationship with user .
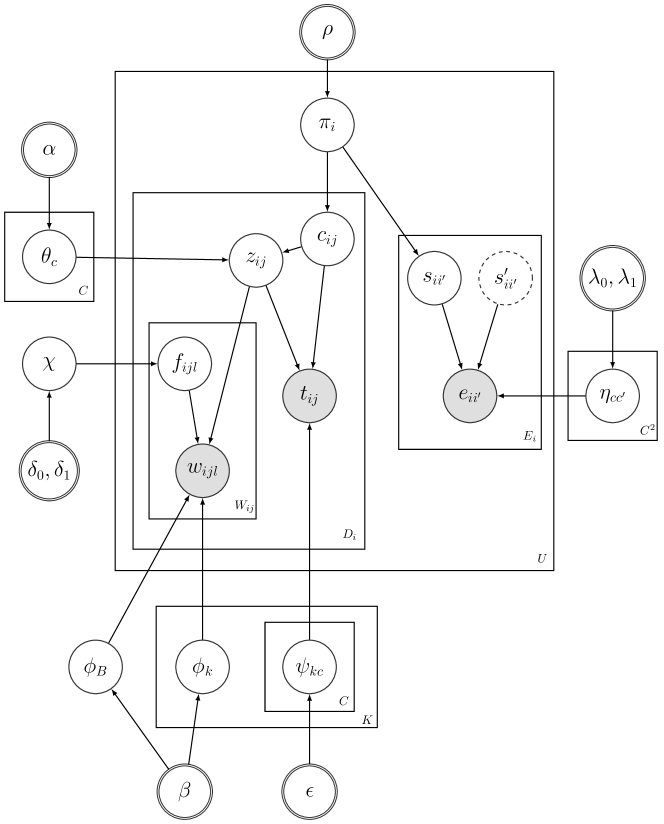
Text-time component. Content of community is generated by a mixture of topics. The distribution models community’s varying levels of interests in multiple topics, and hence plays the critical role of connecting the two aspects of community and topic in social media.
Each post contains a bag of words where denotes the length of the post. In traditional topic models such as latent Dirichlet allocation (LDA) [3], a document is associated with a mixture of topics and each word has a topic label. This is reasonable for long documents such as academic papers. However, on social media like twitter or weibo, a post is usually very short, and thus is most likely to be about a single topic [5, 31, 8]. We therefore assume a single latent topic variable with to indicate its topic. In addition, posts are typically noisy, containing words irrelevant to the main topics [31, 8]. Hence, we assume a background word distribution to capture such common words, and associate each word with a background boolean indicator to indicate the word is drawn from the background topic or not.
To model the discretized time stamps of posts, we use a multinomial distribution over time stamps to model the time variation specific to each topic and each community . Thus, a post is generated at the time drawn from . Compared to Topics over Time (TOT) [23] which uses a Beta distribution to model time variations and only allows a unimodal distribution over time for each topic, our use of multinomial distribution can capture multimodal variations. It is more flexible in capturing real-life topics which usually rise and fall for many times.
Network component. Different from text data collected from individual users, the network data is relational and thus violates the classical independence or exchangeability assumptions [1]. To address the problem, the network component uses pairwise community Bernoulli distributions to model the presence and absence of links between pairs of users. For link , the indicator and denotes the community membership of user and user respectively, when user built relationship with user . Then is drawn from which represents the relationship strength between community and .
The network of a social media is typically sparse, thus we only model positive links: the variables exist if and only if . As in [8], the negative links are implicitly modeled in a Bayesian fashion: we use a Beta() prior on each , and set and , where is the number of negative links. In this way, we reduce large amount of computation and achieve linear complexity on network modeling, as explained in Section 3.4.1.
3.4 Approximate Inference Implementation
We then proceed to propose a collapsed Gibbs sampler for approximate inference of the CosTot model. At each iteration of our Gibbs sampler, we need to sample, for each post by user , both the corresponding community indicator and the topic indicator , and for each link the corresponding community indicators and . We are also required to sample the per-word foreground indicator . We discuss these separately.
Sampling community indicator for post . We sample the community indicator for post according to ,
| (1) |
where denotes the number of posts and links of user generated by community ; is the total number of posts and links of user ; is the number of posts assigned to community and generated by topic ; is the total number of posts generated by community ; denotes the number of times that timestamp is generated by community and topic , and denotes the total number of timestamps generated by community and topic . All the counters mentioned above are calculated with the post excluded.
Sampling community indicators and for link . Recall that we only model , and for positive links . The resulting conditional posterior distribution is:
| (2) |
where is the number of positive links, with excluded, whose communities indicators are .
Sampling topic indicator for post . This is done through the conditional posterior probability
| (3) |
where is the number of times word occurs in the post and is labeled as a foreground word; is the total number of foreground words in the post ; denotes the number of times word is assigned to topic , and is the total number of words assigned to topic . Note that and are calculated with the post excluded.
Sampling foreground indicator for word . The conditional posterior distributions for the foreground indicator are,
| (4) |
and
| (5) |
where and are the number of background words and foreground words respectively; ; denotes the number of times word is generated by background topic, and is the total number of words generated by background topic. Again, all the above counters are calculated with word excluded.
3.4.1 Linear Time Complexity
After the inference description, here we analyze the time complexity of this inference algorithm. It is shown that the chosen algorithm scales linearly in terms of the size of data, i.e. the number of words and positive links, achieving satisfying performance.
Be ware that, in each iteration, the communities of each user’s posts are first sampled. Since all the counters (e.g. ) involved in Eq.(1) can be cached and updated in constant time for each being sampled, Eq.(1) can be calculated in constant time. Thus, sampling all takes linear time w.r.t the number of posts. Next, we sample community indicators using Eq.(2). Since we have implicitly modeled negative links in Bayesian piror (i.e., the Beta prior for ), we only need to sample and for positive links . Hence the complexity is reduced from quadratic (w.r.t the number of users) to linear (w.r.t the number of links). It significantly saves computation cost due to the sparseness of networks. Finally, sampling all and by Eq.(3), (4) and (5) is linear in the number of words. Overall the inference algorithm takes linear time in the amount of data.
4 Applications Based on CosTot
In this section, we demonstrate the usefulness of our approach by various representative applications on real-world social media data. We show that CosTot can effectively uncover communities and topics, and simultaneously capture temporal dynamics of topics in different communities. Based upon the patterns inferred by our model, we are allowed to explore topic dynamics at multiple granularities, identify bursty events, and give an in-depth analysis of particular communities. Our method can also support time stamp prediction and link prediction.
Real Data Setting: We first introduce the data set used in the following study. Our data is crawled from Sina Weibo111http://weibo.com, one of the most popular microblog platforms in China. After removing stop words and low active users with fewer than 20 posts, we obtain our dataset consisting of about K users, M links, M posts and M words with a vocabulary of size K. The posts are distributed evenly in the time period from December 1st 2012 through February 28th 2013. Each post is labeled by the date it was posted. Therefore, time stamps of the dataset range from 1 to 90.
4.1 Multi-scale Topic Temporal Dynamics
In addition to most of existing works that only captures global trends of topics, CosTot can detect community-specific trends of topics. This allows us to have a multi-scale view of temporal dynamics, as well as gain deeper insight on how topics attract attentions from different communities.
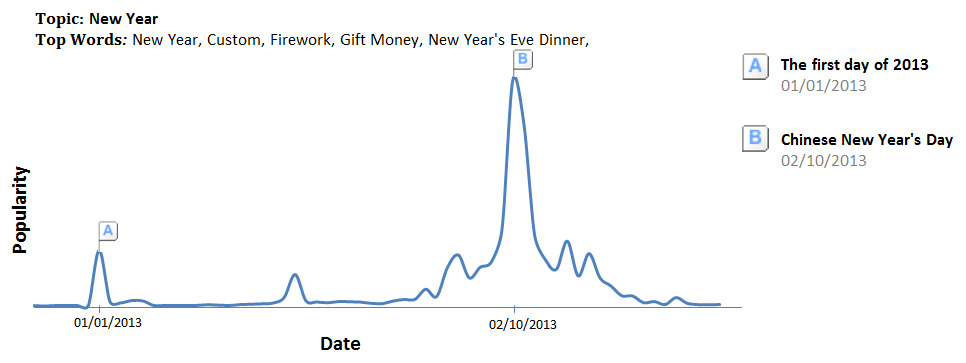
Figure 4 shows the global trends of topic “New Year” in Sina Weibo, where the global popularity of topic at time stamp is obtained by summing over all communities (denoted as ) and users (denoted as ),
where we assume the prior distribution of each user is constant. We label the spikes of timeline with lettered flags. To better understanding the semantic context of the spikes, we manually check the posts generated around corresponding time stamps and give a brief explanation for each spike. For example, the spike “B” on Feb 10th, 2013 is the Chinese New Year’s Day, while the lower spike “A” on Jan 1st, 2013 corresponds to the first day of 2013. (Note our data was from Sina Weibo, a Chinese website.)
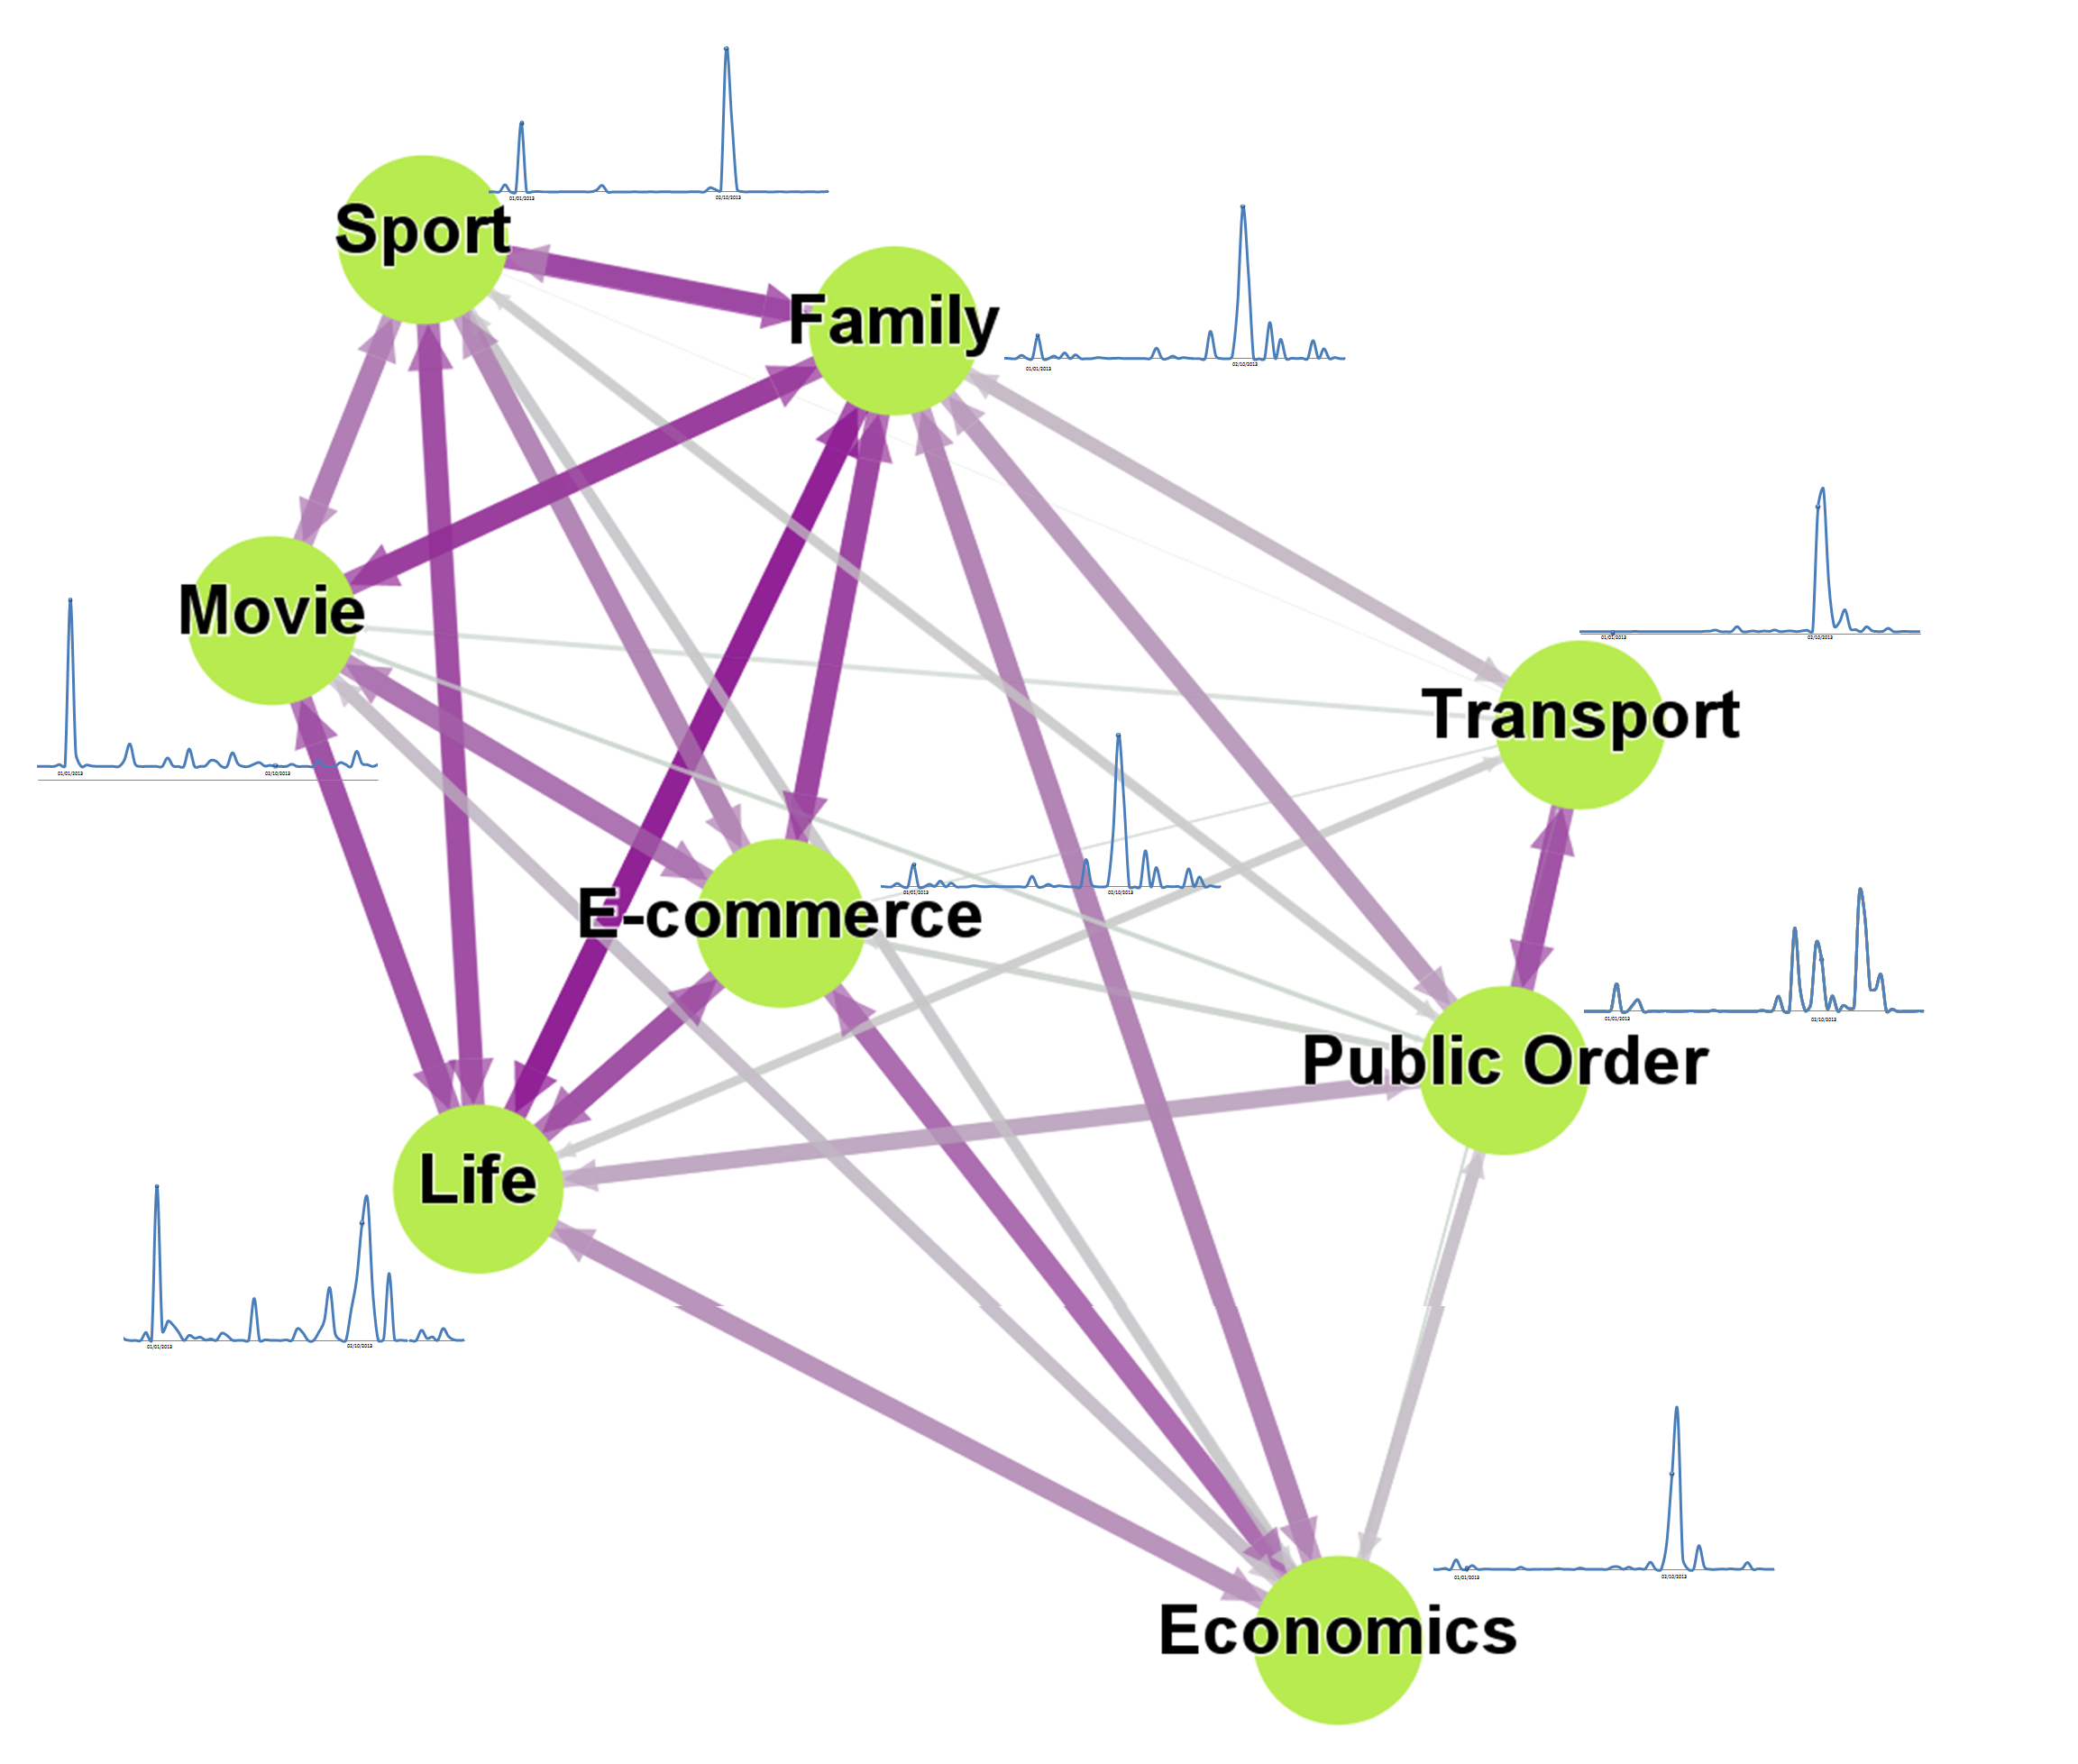
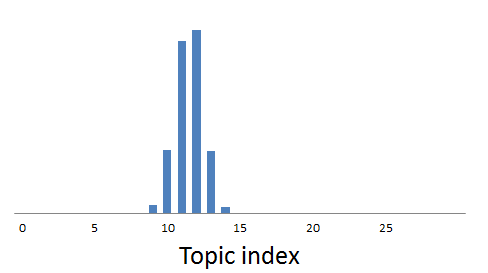
Figure 5 shows part of the communities in Sina Weibo, where each node represents a community. We choose a label for each community based on its distribution over topics. For example, community “Movie” puts high probabilities on movie-related topics 222It is worth mentioning that, in the results inferred by our model, there is no community whose topic probability vector is dominated by topic “New Year”. This is consistent with the fact that New Year is a temporary event and unlikely to be some community’s major interest..
The darkness of the color of edges indicates the link probability between corresponding communities—the darker the color is, the higher the probability. For instance, there is a probability of that the users in community “Family” follow the users in community “Life”, while the probability that the users in community “Transport” follow the users in community “’Movie” only achieves . For comparison, we put the community-specific dynamics of topic “New Year” near the corresponding nodes (communities). We see that while most of the timelines peak around the Chinese New Year’s Day (i.e. spike “B” in Figure 4), only those communities on the left (e.g. community “Movie”) have spikes around the first day of 2013 (i.e. spike “A” in Figure 5), and communities on the right (e.g. community “Transport”) pay little attention to the topic at that time. One possible explanation for the phenomenon is that the communities on the left are more relevant to entertainment, while those on the right seem to be more concerned with professional stuff. Furthermore, strong links between communities tend to make the temporal dynamics in corresponding communities more similar, because they provide more effective channels for information diffusion. The community-specific temporal dynamics also suggest that the huge spike “B” in the global dynamic is contributed by most communities of the social media, and by contrast, the small spike “A” is formed due to the attentions from part of the communities.
4.2 Characters of Extracted Communities
Here we demonstrate that, by focusing on community-specific results, CosTot model enables us to step into a finer granularity and get in-depth characteristics of particular communities.
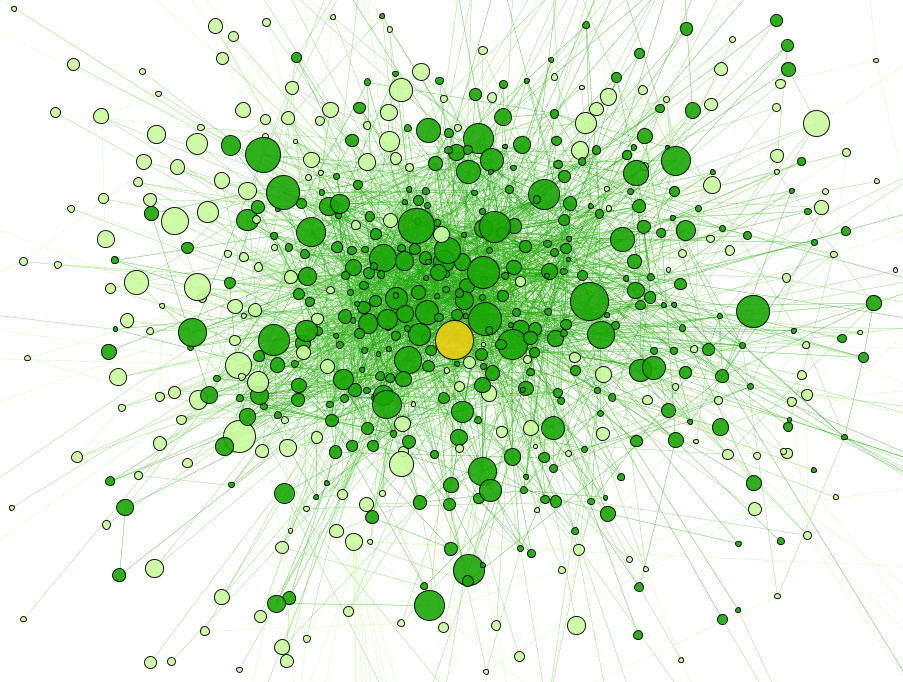
Community connectivities and user contributions. Figure 6 provides a visualization for community “E-commerce”. Since our model captures mixed membership of users, we define the contribution of a user to a community by considering both the membership probability and number of posts generated by , as
For community “E-commerce”, we calculate contributions of all users, and find that the contribution distribution approximately follows a classic power law. Due to the space constraint, we omit this distribution figure. We select top users with contributions larger than , which yields a subset of about users (Figure 6). The size of each node is proportional to the user’s contribution. We further recognize the central actor [24] of the community as the user with highest contribution (the yellow node), and as in [18], we highlight the nodes that can reach the central actor within 2 steps along the directed edges (i.e. “following” relationship). From the figure we see that most of the nodes are highlighted, suggesting that the members are closely connected.
Topic dynamics within the same community.
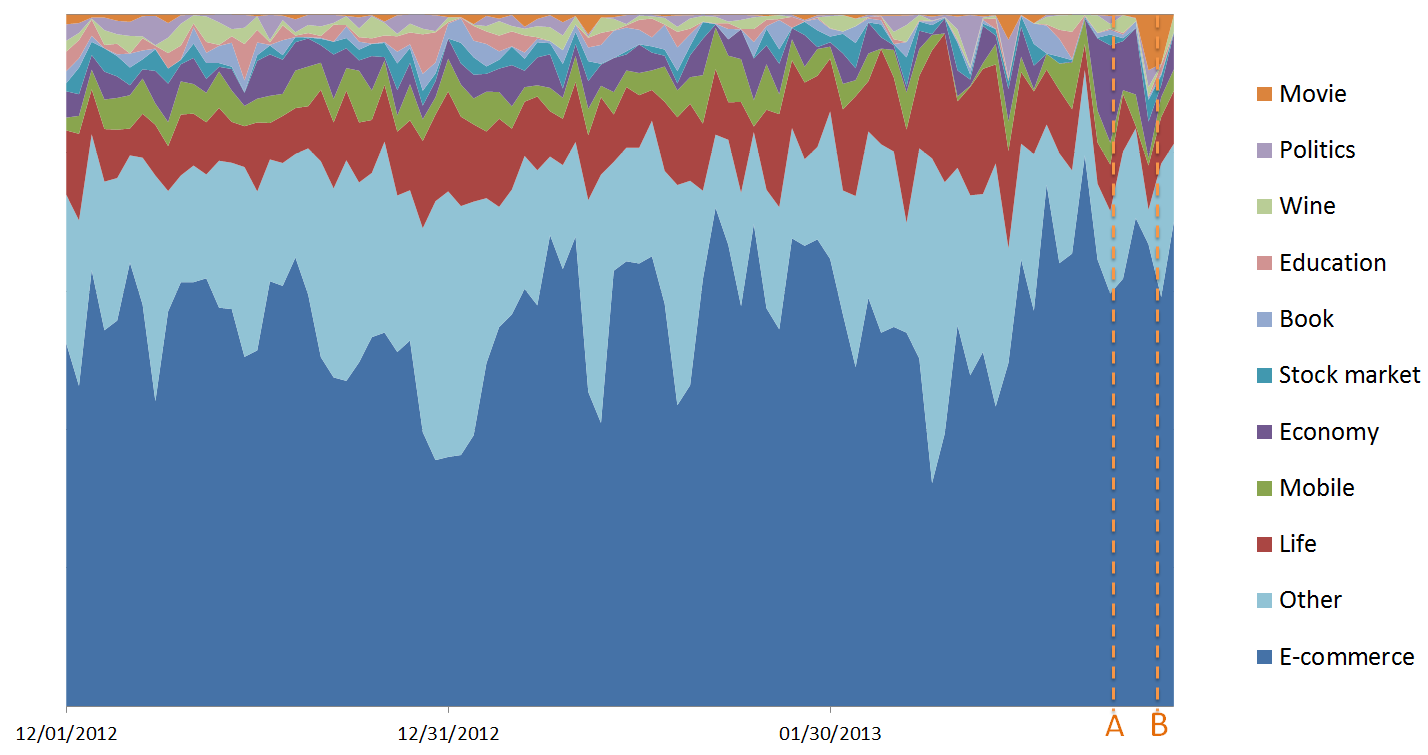
To give a holistic view of the temporal dynamics of the community’s attention to different topics, we compute the community’s distribution over topics given time with the Bayes rule:
Figure 7 shows the resulting patterns. The height of a topic’s region indicates the relative popularity of the topic in the community “E-commerce” at given time. We can observe that the attentions of the community members change over time, while topic “E-commerce” dominates the focus. (That is why we name the community as “E-commerce”.) It is also notable that other minor topics are also competing for the attention from the community. For example, at time stamp , topic “Economy” gains more concern among these minor topics, while afterwards (at time stamp ) topic “Movie” successfully catches the eyes of the members.
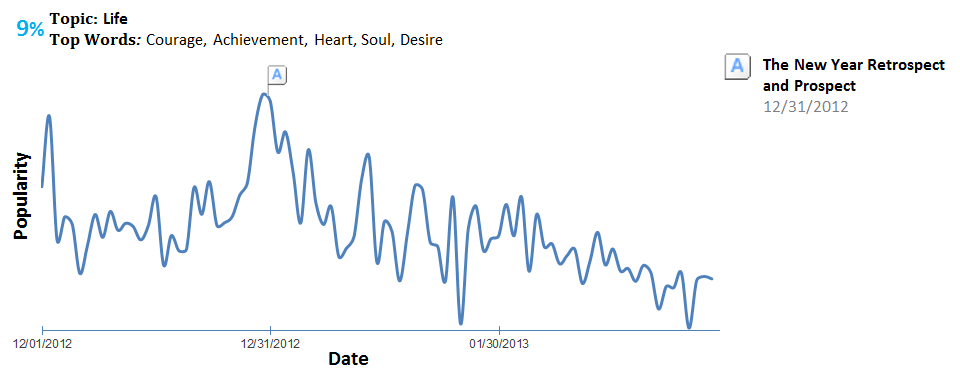
It is also interesting to step further by focusing on individual topics and analyzing their temporal dynamics in the particular community. We select two topics and display their variation within community “E-commerce” in Figure 8. We find that it is Ang Lee’s win for best director in the Academy Award that boosts topic “Movie” at time stamp in Figure 7. It can also be observed that timelines of topics with higher levels of interest tend to be smoother, while topics with low levels of interest receive spiky attentions from the members. The result indicates that temporal dynamics of topics in “unrelated” communities can facilitate bursty event detection. We further verify this claim in the next section.

4.3 Event Identification
Bursty event detection [9, 5] aims to capture the most popular events that have drawn the public’s attentions. When we want to find such events related to a certain topic, one may intuitively focus on the community whose major interests lie in the particular topic, and analyze the behaviors of its members to detect bursts. Our results, however, suggest that analyzing communities that are not regularly concerned with the topic may provide a easier way for bursty event detection.


An example is shown in Figure 9, where (a) demonstrates the temporal dynamic of topic “Sports” in community “Sports” (i.e. the community takes major interest in topic “Sports”), whereas (b) is the temporal dynamic of the same topic in community “Movie”. The percentages shown on the top left corner represent the topic probability of corresponding communities. From Figure 9(b) we can more easily identify the bursts, such as the burst “C” which coincides with the Australian Open Final the famous Chinese professional tennis player Na Li attended. On the contrary, the timeline in Figure 9(a) is much smoother and without clear spikes. By examining the data, we found that community “Sports” did talk about the particular events detected by Figure 9(b) when they happened. However, these bursty behaviors are concealed since members keep talking about sports throughout the time period, and this results in no clear spikes. On the other hand, members in community “Movie” are not concerned with sports-related topic in the daily life, but their attentions would still be drawn when significant events happened. It is worth mentioning that although the probability that community “Movie” generates sports-related posts is low, there are still many members and large number of such posts involved due to the large size of the data. Thus, the spikes represent the attentions from this whole community, rather than from a small portion of its members.
4.4 Time Stamp/Link Prediction
Time Stamp Prediction. Another application of modeling temporal dynamics is to predict the time stamp of a previously unseen document based on its content. It can be used to recover time stamps of documents with missing or incorrect meta-data [22].
Given the words in a post and its author, we predict its time stamp by choosing the one that gives maximum likelihood. Specifically, for a post by user , its predicted time stamp is:
Link Prediction. Our framework also supports to predict the probability of a link between two users. Link prediction in social media not only helps in analyzing networks with missing data, but also can be used to recommend friends or followees by identifying very likely but not yet existent links [13].
Based on the results of CosTot, the link prediction algorithm works as follows: for a pair of users (, ), we compute the probability of a link from user to as
and predict that the link exists if exceeds some threshold.
We will present the empirical improvements of time stamp and link prediction tasks in the later experimental study.
5 Experiments
In this section, we conduct extensive experiments on both synthetic and real-world data to evaluate our proposed approach. For synthetic dataset, our experimental results show that CosTot is able to precisely uncover the hidden patterns. For real-world dataset, we demonstrate the superiority of our method by comparing it with state-of-the-art methods in various aspects.
5.1 Experiments on Synthetic Data
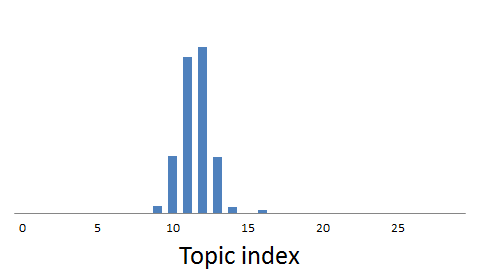
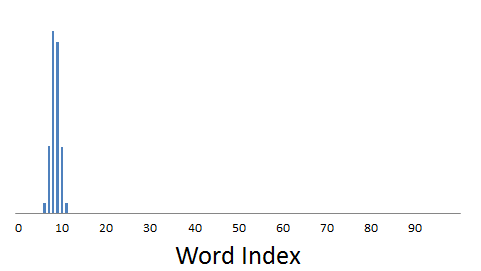
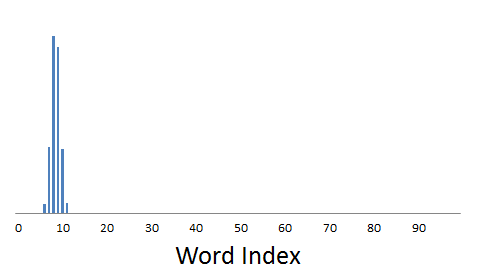
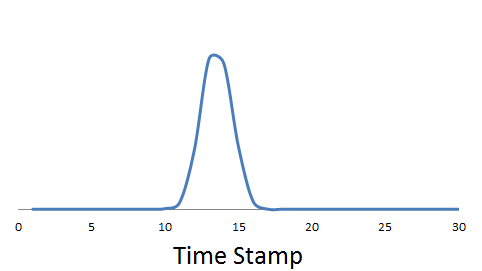
Topic and community Generation. We generate topics each associated with a multinomial distribution over words obtained by discretizing Gaussian distributions with means sampled uniformly on . One example of generated topic-word distribution is shown in Figure 10(b.1). We then generate synthetic communities each associated with a multinomial distribution over topics obtained by the similar method to topic-word distribution but with the mean sampled on . Figure 10(a.1) shows the topic distribution of one of the communities. For each (topic, community) pair, we also use a discretized Gaussian distribution to mimic the temporal variation of the topic in the community, with the mean sampled uniformly on . Here is the number of time stamps. One example of temporal variation is demonstrated in Figure 10(c.1), where we use smoothed curve to fit the discrete values.
We also generate users, each of which is randomly assigned a community label denoting the major community that the user belongs to.
Text Generation. Each user has posts. To mimic the property of mixed membership in social media, the community that a user belongs to when she creates the post is sampled from a discretized Gaussian distribution over communities, with the mean equal to her community label. After that, topic, words and time stamp of the post are generated according to the generative process described above (with background topic omitted). Each post contains words.
Link Generation. First we devise the following link probability between two communities and ,
| (6) |
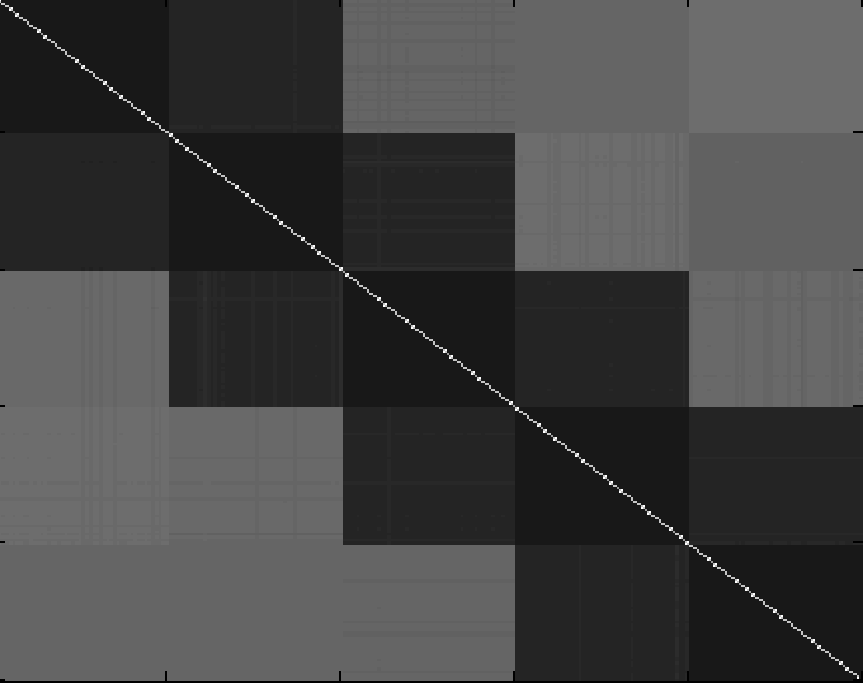
where and are the natural number indexes of the communities; denotes the link probability within a community (i.e. ); is the slope; and is the threshold minimum link probability between two communities. Eq.(6) implies that links are more likely generated between communities indexed by consecutive numbers. Second, for each user pair, we find their major communities of each and use the link probability between those two communities to generate links between the user pair. Figure 10(d.1) shows the adjacency matrix of users indicated by the generated links. Here rows (i.e. users) are reordered according to their community labels. The resulting block structure due to Eq.(6) allows easy comparison with the estimated link probabilities from our model.
Experimental Results. We set , , , , , , , , and . All Gaussian variances are set to . We train CosTot on this synthetic data, with the numbers of communities and topics set to the true values.
 |
 |
| (a.1) | (a.2) |
 |
 |
| (b.1) | (b.2) |
 |
 |
| (c.1) | (c.2) |
 |
 |
| (d.1) | (d.2) |
5.2 Experiments on Real-world Data
We now present empirical results of our approach on Sina Weibo dataset (Section 4). We first describe the settings of experiments, then quantitatively evaluate our model in terms of three aspects: time stamp prediction for evaluating the capacity of capturing temporal dynamics, link prediction for measuring the capacity of modeling network, and perplexity for evaluating the capacity of modeling text. We only report the optimal results of different methods after tuning the parameters, and leave the study of parameter impacts for the end of the section.
5.2.1 Experimental Settings
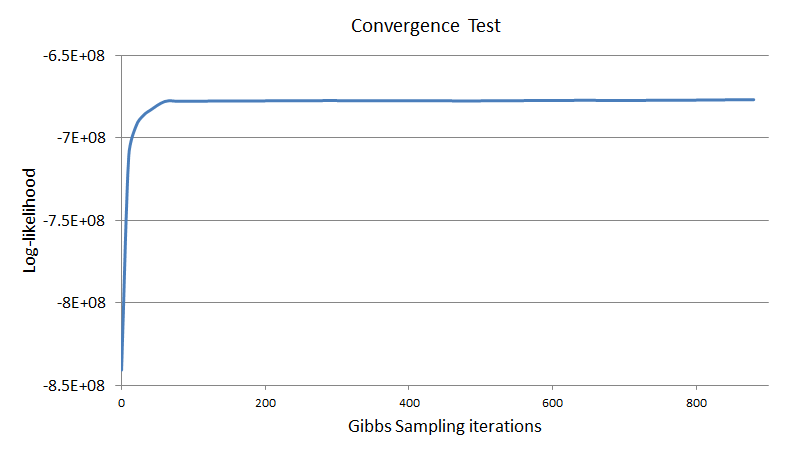
We fix the hyperparameters to and , and and are determined as described in Section 3.3. We calculate the complete log-likelihood of the data as the proxy to monitor the convergence of the Gibbs sampling algorithm,
where the first part on the RHS is the log-likelihood of text and time, and the second part is that of links. Figure 11 shows that the log-likelihood as a function of the number of iterations. It converges after a small number of iterations. The convergence behavior is roughly the same under different configurations of the number of communities and the number of topics. In particular, we set the number of iterations to 500 in the following experiments. All our experiments are conducted on a Linux Server with eight 2.4GHz CPU cores and 32G memory.
5.2.2 Time Stamp Prediction
The task of time stamp prediction provides a way to quantitatively evaluate the capacity of capturing temporal dynamics of topics [23]. We compare our proposed CosTot with the following four competitors, where the first two are the existing methods providing state-of-the-art performance on this task; the third one corresponds to a subpart of CosTot; and the last one is an alternative approach of uncovering community-specific temporal variations.
Topics over Time (TOT). Similar to CosTot, TOT [23] jointly models the text and time stamp of a document by treating both words and time stamps as variables generated by latent topics. It employs a Beta distribution to model the time distribution of each topic. TOT does not exploits link data.
Enhanced User-Temporal Model with Burst-weighted Smoothing (EUTB). EUTB [29] incorporates time information by assuming that a topic is generated either by a user or a time stamp. Hence it models the topic distributions of users and time stamps. Network data is exploited as a regularization based on the observation that neighbors in social network tend to have similar interests. Note that an array of regularization methods are proposed in [29], while EUTB, with the link regularization and burst-weighted smoothing, performs best in the time stamp prediction task among a host of competitors.
CosTot without Link (CosTot-NoLink). CosTot-NoLink is a subpart of CosTot with the network component (Section 3.3) removed. Hence it provides a more fairly comparison with TOT. We can also take a look at the impact of considering link information by comparing to CosTot.
Simple Approach of Community-specific Temporal Variations (Simple-CTV). One alternative method to analyze community-specific topic dynamics is to exploit network and text data step by step: we begin by dividing users into communities using well-established network community detection techniques, then uncover topic variation in certain community by running TOT on the posts generated by its members. By comparing with the simple approach, we gain insight into the benefits of combining the two aspects of community and topic in the CosTot way. In the experiment, we capture user multiple memberships by running MMSB on user network and assigning each user to two communities [25] with highest probabilities.
We randomly select of the posts as the test set, while the remaining posts and all links are used to train the models. We set the hyperparameters in above baselines closely resemble those in our model. Here we only report the best results of each with tuned parameters. The impact of model parameters is discussed in later section.
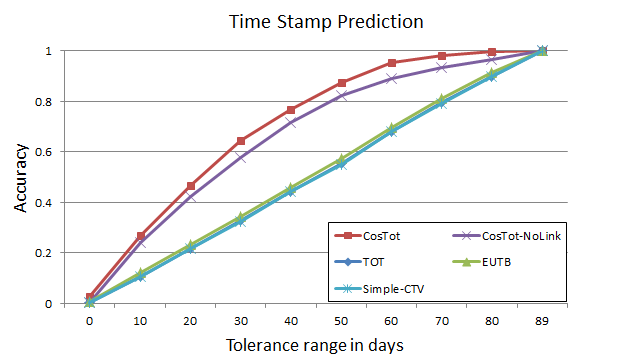
Figure 12 shows the prediction accuracy as a function of tolerance range for these models. From the figure, we see that our model performs better than all competitors. Moreover, CosTot-NoLink outperforms TOT and EUTB, justifying the advantage of distinguishing temporal variations of topics in different communities, while the superiority of CosTot to CosTot-NoLink shows the benefit brought by incorporating link structures in social media.
We also observe that, Simple-CTV, despite taking into account community-specific topic dynamics, has poor performance as TOT. The reason is that it exploits network and content information separately, while ignores the correlations between them. Another drawback of Simple-CTV worth mentioning is that, since it runs TOT separately on different corpus, topics in a certain community are not shared by others. Therefore, it only provides us with disjoint views of different communities, and fails to consider the social media as a whole.
5.2.3 Link Prediction
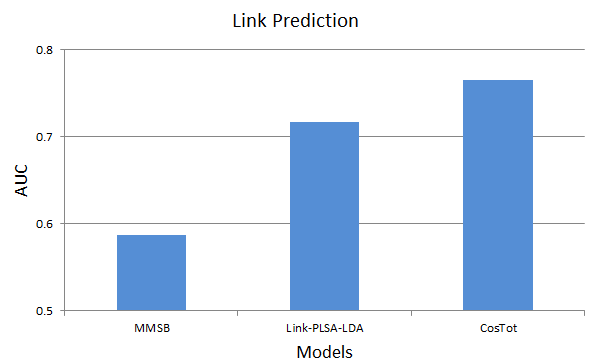
Link prediction is a natural generalization task in networks, and a way to measure the quality of our model in modeling link structures. As discussed in Section 4.4, we can predict links between users where the probability is above some threshold. However, since we are unaware of this threshold, we turn to area under the receiver operating characteristic curve (AUC) [7] as the metric of the accuracy of prediction algorithm. Given the rank of all non-observed links, the AUC value can be interpreted as the probability that a randomly chosen true positive link is ranked above a randomly chosen true nonexistent link.
We compare CosTot with MMSB [1] and Link-PLSA-LDA [16]. MMSB exploits only the network data, while Link-PLSA-LDA incorporates both network and text information.
Mixed Membership Stochastic Blockmodel (MMSB). Similar to CosTot, MMSB infers a probability distribution over communities for each user, and a link formation probability for each community pair. MMSB does not exploits text data.
Link-PLSA-LDA. Link-PLSA-LDA defines a generative process for both text and citations between documents, where text generation is following the LDA approach, and citations are models as multinomial sampling of the target document from a topic-specific distribution over documents. We can also interpret Link-PLSA-LDA in another way by regarding documents as users in social media, words as user-generated text, and citations as directed links between users. In this perspective, links and text are generated by the same latent factor, which means one community is bound to one topic (as we see the latent factor as community when generating links, and as topic when generating text).
We randomly select of the positive links and of the negative links to evaluate the AUC; models are trained on the remaining links and all posts. Figure 13 gives the AUC values for the three models. We see that by incorporating content information of users, Link-PLSA-LDA and CosTot outperform MMSB significantly. CosTot outperforms Link-PLSA-LDA, since it is coherent with the fact that a community in the real world have varying levels of interests in multiple topics.
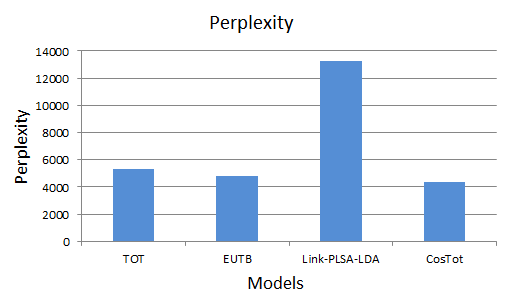
5.2.4 Perplexity
We evaluate the quality of our proposed CosTos in modeling text by computing the perplexity [3] of a held-out test set. As a widely used metric in language modeling, perplexity monotonically decreases in the likelihood of the test data. A lower perplexity value indicates better generalization performance. For a test set of posts, the perplexity is:
where is the probability of the words in the test post; for CosTot, it is computed as:
where is the author of the post.
We compare CosTot with three competitors: TOT, EUTB and Link-PLSA-LDA, and the results are shown in Figure 14. We see that CosTot has the lowest perplexity (i.e. best text prediction performance) among all the competitors. In contrast, Link-PLSA-LDA shows a poor performance, since its topics are tangled with communities in the same latent factor, and thus their fitness in modeling text is weakened by links.
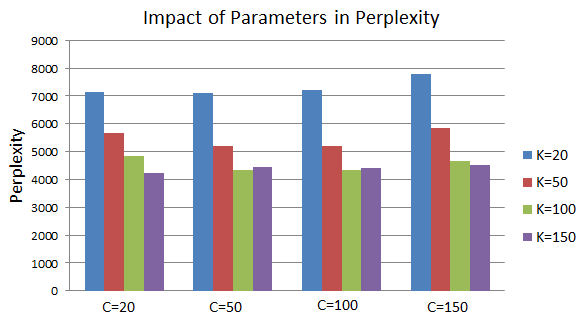
5.2.5 Parameter Study
The two parameters, i.e., the number of communities and the number of topics , are critical to the performance of CosTot. We therefore study the impacts of these parameters in different tasks. Here we show the experimental results for link prediction and perplexity, which demonstrate the different roles of and in determining the model performance.
Figure 15 shows the AUC values of link prediction under different settings, and . We see that given a fixed , the AUC value at first increases as increases, and there is an intermediate value of (i.e. 100) at which CosTot has the best performance. After that the AUC value decreases as continues to increase. On the other hand, given any fixed , the result fluctuates slightly without a clear pattern as varies, indicating that the number of topics is less important for link prediction than the number of communities. The underlying reason is that, in CosTot links are generated by mixture of communities, hence the number of communities directly impacts the capacity of modeling network. In contrast, although there exists correlations between text and network, the influence of topics on network modeling is indirect.
Figure 16 shows the impacts of and with regard to the quality of CosTot in text modeling. We see that perplexity decreases with the increasing number of topics, while remain stable as the number of communities varies. The result is reasonable since topics account for generating text. It is also worth mentioning that the performance does not change significantly when is larger than 100.

6 Conclusion
In this paper, we have addressed the problem of temporal topic dynamics within different communities in social media. We presented CosTot (Community Specific Topics-over-Time), a probabilistic longitudinal model jointly over network, text and time, to simultaneously uncover the hidden topics and communities, and capture the community-specific temporal variation of topics. We provided efficient inference implementation and abundant applications to demonstrate the feasibility and usefulness of this model. In the empirical study, our model achieved best performance in the tasks of time stamp prediction, link prediction and text perplexity among several competitors. We also provided several novel visualization examples of topic temporal patterns at different granularities, which clearly show how topics attract attentions from different communities.
For future work, we are interested in extending the model to further capture network dynamics. We also would like to incorporate information diffusion among different communities that leads to the observed temporal patterns.
References
- [1] E. M. Airoldi, D. M. Blei, S. E. Fienberg, and E. P. Xing. Mixed membership stochastic blockmodels. JMLR, 9:1981–2014, 2008.
- [2] D. M. Blei and J. D. Lafferty. Dynamic topic models. In Proc. of ICML, pages 113–120, 2006.
- [3] D. M. Blei, A. Y. Ng, and M. I. Jordan. Latent dirichlet allocation. JMLR, 3:993–1022, 2003.
- [4] J. Chang and D. M. Blei. Relational topic models for document networks. In Proc. of Artificial Intelligence and Statistics, pages 81–88, 2009.
- [5] Q. Diao, J. Jiang, F. Zhu, and E.-P. Lim. Finding bursty topics from microblogs. In Proc. of ACL, pages 536–544, 2012.
- [6] P. Doreian, V. Batagelj, and A. Ferligoj. Generalized blockmodeling, volume 25. Cambridge University Press, 2005.
- [7] J. A. Hanely and B. J. McNeil. The meaning and use of the area under a receiver operating characteristic (roc) curve. Radiology, 143(1).
- [8] Q. Ho, R. Yan, R. Raina, and E. P. Xing. Understanding the interaction between interests, conversations and friendships in facebook. CoRR, abs/1211.0028, 2012.
- [9] J. Kleinberg. Bursty and hierarchical structure in streams. Data Mining and Knowledge Discovery, 7(4):373–397, 2003.
- [10] J. Leskovec, K. J. Lang, and M. Mahoney. Empirical comparison of algorithms for network community detection. In Proc. of WWW, pages 631–640, 2010.
- [11] Y.-R. Lin, D. Margolin, B. Keegan, and D. Lazer. Voices of victory: a computational focus group framework for tracking opinion shift in real time. In Proc. of WWW, pages 737–748, 2013.
- [12] Y. Liu, A. Niculescu-Mizil, and W. Gryc. Topic-link lda: joint models of topic and author community. In Proc. of ICML, pages 665–672, 2009.
- [13] L. Lü and T. Zhou. Link prediction in complex networks: A survey. Physica A: Statistical Mechanics and its Applications, 390(6):1150–1170, 2011.
- [14] Y. Matsubara, Y. Sakurai, B. A. Prakash, L. Li, and C. Faloutsos. Rise and fall patterns of information diffusion: model and implications. In Proc. of KDD, pages 6–14, 2012.
- [15] J. D. Mcauliffe and D. M. Blei. Supervised topic models. In Proc. of NIPS, pages 121–128, 2007.
- [16] R. Nallapati and W. W. Cohen. Link-plsa-lda: A new unsupervised model for topics and influence of blogs. In ICWSM, 2008.
- [17] R. M. Nallapati, A. Ahmed, E. P. Xing, and W. W. Cohen. Joint latent topic models for text and citations. In Proc. of KDD, pages 542–550, 2008.
- [18] N. Pathak, C. DeLong, A. Banerjee, and K. Erickson. Social topic models for community extraction. In The 2nd SNA-KDD Workshop, volume 8, 2008.
- [19] L. Ren, D. B. Dunson, and L. Carin. The dynamic hierarchical dirichlet process. In Proc. of ICML, pages 824–831, 2008.
- [20] Y. Ruan, D. Fuhry, and S. Parthasarathy. Efficient community detection in large networks using content and links. In Proc. of WWW, pages 1089–1098, 2013.
- [21] M. Sachan, D. Contractor, T. A. Faruquie, and L. V. Subramaniam. Using content and interactions for discovering communities in social networks. In Proc. of WWW, pages 331–340, 2012.
- [22] D. D. Walker, K. Seppi, and E. K. Ringger. Topics over nonparametric time: A supervised topic model using bayesian nonparametric density estimation. In UAI Applications Workshop, 2012.
- [23] X. Wang and A. McCallum. Topics over time: a non-markov continuous-time model of topical trends. In Proc. of KDD, pages 424–433, 2006.
- [24] S. Wasserman. Social network analysis: Methods and applications, volume 8. Cambridge university press, 1994.
- [25] J. Xie, S. Kelley, and B. K. Szymanski. Overlapping community detection in networks: The state-of-the-art and comparative study. ACM Comput. Surv., 45(4):43:1–43:35, Aug 2013.
- [26] J. Yang and J. Leskovec. Patterns of temporal variation in online media. In Proc. of WSDM, pages 177–186, 2011.
- [27] J. Yao, B. Cui, Y. Huang, and X. Jin. Temporal and social context based burst detection from folksonomies. In Proc. of AAAI, pages 1474–1479, 2010.
- [28] Z. Yaojia, Y. Xiaoran, G. Lise, and M. Cristopher. Scalable text and link analysis with mixed-topic link models. In Proc. of KDD, 2013.
- [29] H. Yin, B. Cui, H. Lu, Y. Huang, and J. Yao. A unified model for stable and temporal topic detection from social media data. In Proc. of ICDE, 2013.
- [30] J. Zhang, Y. Song, C. Zhang, and S. Liu. Evolutionary hierarchical dirichlet processes for multiple correlated time-varying corpora. In Proc. of KDD, pages 1079–1088, 2010.
- [31] W. X. Zhao, J. Jiang, J. Weng, J. He, E.-P. Lim, H. Yan, and X. Li. Comparing twitter and traditional media using topic models. In Proc. of ECIR, pages 338–349, 2011.