Homogeneous ice nucleation at moderate supercooling from molecular simulation
Abstract
Among all the freezing transitions, that of water into ice is probably the most relevant to biology, physics, geology or atmospheric science. In this work we investigate homogeneous ice nucleation by means of computer simulations. We evaluate the size of the critical cluster and the nucleation rate for temperatures ranging between 15 K and 35 K below melting. We use the TIP4P/2005 and the TIP4P/Ice water models. Both give similar results when compared at the same temperature difference with the model’s melting temperature. The size of the critical cluster varies from 8000 molecules (radius nm) at 15 K below melting to 600 molecules (radius nm) at 35 K below melting. We use Classical Nucleation Theory (CNT) to estimate the ice-water interfacial free energy and the nucleation free energy barrier. We obtain an interfacial free energy of 29(3) mN/m from an extrapolation of our results to the melting temperature. This value is in good agreement both with experimental measurements and with previous estimates from computer simulations of TIP4P-like models. Moreover, we obtain estimates of the nucleation rate from simulations of the critical cluster at the barrier top. The values we get for both models agree within statistical error with experimental measurements. At temperatures higher than 20 K below melting we get nucleation rates slower than the appearance of a critical cluster in all the water of the hydrosphere in the age of the universe. Therefore, our simulations predict that water freezing above this temperature must necessarily be heterogeneous.
I Introduction
When a liquid is cooled below its freezing point it is supposed to freeze. Usually, impurities or the solid boundaries of the liquid provide preferential sites for the formation of the solid phase. However, even in the absence of impurities, small nuclei of the new phase may be formed within the bulk metastable liquid. This mechanism of formation of the solid phase is called homogeneous nucleation.Debenedetti (1996); Kashchiev (2000) Homogeneous nucleation is an activated process since the formation of a critical nucleus requires the surmounting of a free energy barrier. After that, the crystalline nucleus can grow (nucleation-and-growth mechanism). In general, at moderate supercooling, the limiting step is the formation of the critical cluster rather than the crystal growth. The most relevant quantity to characterize nucleation is the nucleation rate, i.e. the number of nucleating clusters per unit time and volume.
Water freezing is arguably the most important liquid-to-solid transition. For example, ice formation in atmospheric clouds is a key factor to the global radiation budget and to climate change.Cantrell and Heymsfield (2005); Baker (1997); DeMott et al. (2010) Water freezing is also a big issue, for instance, in the cryopreservation of cells and tissues.Morris and Acton (2013) Moreover, ice formation is relevant to microbiologyHirano and Upper (2000), food industryMaki et al. (1974); Li and Lee (1995), materials scienceMichaelides and Morgenstern (2007), geologyGerrard (1988) or physics.Pruppacher (1995); Debenedetti (1996); Taborek (1985); Knopf and Rigg (2011); Moore and Molinero (2011a); Li et al. (2011); Riechers et al. (2013)
Despite its great importance, our understanding of water freezing is far from complete. Not even homogeneous nucleation, the simplest conceivable mechanism by which ice can be formed, is fully understood. One of the reasons for this is the need to perform experiments with small droplets (10-100m) to avoid heterogeneous nucleation.Kramer et al. (1999); Stockel et al. (2005); Murray et al. (2010); Mishima (2010) This, and the time that the droplets can be stabilized, sets the order of magnitude that can be probed for the nucleation rate, . Thus, experimental measurements for (m-3s-1)) typically range between and and . This corresponds to a temperature window spanning from 239 K to 233 K, the latter often referred to as “homogeneous nucleation temperature”.Debenedetti (2003) Our knowledge of the nucleation rate outside this temperature window is limited to extrapolations based on CNT. Such extrapolations must be taken with care since the uncertainties in the nucleation rate and the narrow range of temperatures for which J can be measured lead to important differences in the estimated value of the interfacial free energy and/or the kinetic prefactor.Murray et al. (2010) Moreover, it has not been possible so far to observe a critical ice nucleus in experiments because critical nuclei are relatively small and short-lived. Therefore, we only have estimates of the critical cluster size based on experimental measurements of .Pruppacher (1995); Mori et al. (1996); Jeffery and Austin (1997); Kramer et al. (1999); Kiselev (2001); Liu et al. (2007) The purpose of this paper is to fill these gaps by obtaining the first estimate of the size of the critical cluster and of the nucleation rate at high temperatures which is not entirely based on theoretical extrapolations from measurements at low temperatures. We will make use of computer simulations to achieve these goals.
Computer simulations are a valuable tool to investigate nucleationten Wolde and Frenkel. (1997); Auer and Frenkel (2001a) since they provide a microscopic description of the process. It is therefore somehow surprising that the number of simulation studies dealing with ice nucleation is rather small.Sear (2012) On the one hand, it has been shown that ice nucleation can occur spontaneously (without the aid of special simulation techniques) when an electric field is appliedSvishchev and Kusalik (1994), when crystallization is assisted by a substrateKoga et al. (2001); Moore et al. (2010) or by an interfaceVrbka and Jungwirth (2006), when coarse-grained models with accelerated dynamics are simulated at high supercoolings,Moore and Molinero (2011a); Moore and Molinero (2010); Moore and Molinero (2011b) or when small systems are simulatedMatsumoto et al. (2002); Yamada et al. (2002); Kesselring et al. (2013). On the other hand, if nucleation does not happen spontaneously, rare event techniques must be used. The number of such works is limited and the agreement between different groups is not entirely satisfactory. Radhakrishnan and TroutRadhakrishnan and Trout (2003a); Radhakrishnan and Trout (2003b), Quigley and RodgerQuigley and Rodger (2008) and Brukhno et al.Brukhno et al. (2008) determined the free energy barrier for the formation of ice critical clusters with the TIP4P water model at 180 K (50 degrees below the model’s melting temperature), but mutually consistent results were not found. Reinhardt and DoyeReinhardt and Doye (2012) and Li et al.Li et al. (2011) evaluated the nucleation rate of the mW model at 55 K below freezing finding a discrepancy of six orders of magnitude. Very recently, Reinhardt et al. investigated ice nucleation at moderate supercoolings,Reinhardt and Doye (2013) to estimate the free energy of formation of small pre-critical clusters. It is almost certain that more ice nucleation studies are on the way and, hopefully, the discrepancies will become smaller.
None of the studies mentioned in the previous paragraph deal with large systems at moderate supercoolings like the present investigation does. By supercooling, , we mean the difference between the melting temperature and the temperature of interest. Note that the melting temperature of a model does not necessarily coincide with the experimental melting temperature or with the melting temperature of other models. In this work we determine, by means of computer simulations, the size of critical ice clusters and the nucleation rate for ranging from 15 to 35 K. In this way we provide, for the first time, nucleation rates for lower than 35 K, where experimental measurements are not currently feasible (CNT based estimates of can in principle be made for any supercooling but, to the best of our knowledge, there are no such estimates available for ).Pruppacher (1995); Kashchiev (2000); Murray et al. (2010) Our simulations predict that for K it is impossible that homogeneous ice nucleation takes place. Therefore, ice must necessarily nucleate heterogeneously for supercoolings lower than 20 K. Moreover, we can directly compare our results for the largest studied supercoolings to the experimental measurements. We find, within uncertainty, a good agreement with experimental nucleation rates. We predict that the radius of the critical cluster goes from 40 Å(8000 molecules) at ca. 15 K to 17 Å(600 molecules) at ca. 35 K. We also estimate the surface free energy via CNT. We obtain, in agreement with predictions based on experimental measurements,Pruppacher (1995); Zobrist et al. (2007); Alpert et al. (2011) that the surface free energy decreases with temperature. An extrapolation of the interfacial free energy to the melting temperature gives a value of 29 mN/m, in reasonable agreement with experimental resultsHardy (1977), and with calculations by simulation.Davidchack et al. (2012)
We use two simple, yet realistic, water models; namely TIP4P/2005Abascal and Vega (2005) and TIP4P/IceAbascal et al. (2005). The melting temperatureAbascal and Vega (2005); Abascal et al. (2005) and the ability of these models to predict properties of real water has already been well established.Vega and Abascal (2011) The results obtained for both water models are quite similar provided that they are compared at the same .
II Methodology
To evaluate the size of critical ice clusters we follow a similar approach to that proposed by Bai and LiBai and Li (2006) to calculate the solid-liquid interfacial energy for a Lennard-Jones system. They employ spherical crystal nuclei embedded in the supercooled liquid and determine the temperature at which the solid neither grows nor melts. The key issue of this methodology is that determining the melting temperature of a solid cluster embedded in its corresponding supercooled liquid water is equivalent to the determination of the critical size of the cluster for a certain given temperature. Thus, in a sense, this methodology can be regarded as the extension to nucleation phenomena of the well known direct coexistence technique.Ladd and Woodcock (1978) A similar method was applied to water by Pereyra et al.Pereyra et al. (2011) They inserted an infinitely long (through periodical boundary conditions) ice cylinder in water and determined the melting temperature of the cylinder. Recently, the approach of Bai and Li has been used to investigate the nucleation of clathrate hydrates.Jacobson and Molinero (2011); Knott et al. (2012)
Here we shall implement this methodology to study a three-dimensional spherical ice cluster embedded in supercooled water. This follows closely the experimental situation where the incipient ice embryo is fully immersed into liquid water. Such brute force approach requires very large systems (containing up to 2 water molecules). However, molecular dynamics simulations can be efficiently parallelised so that it is nowadays possible to deal with such system size. The methodology can then be implemented in a rather straightforward way, and is particularly useful at moderate supercooling, where other techniques (such as umbrella samplingAuer and Frenkel (2004a); Auer and Frenkel (2001b), Forward Flux SamplingAllen et al. (2005) or Transition Path SamplingBolhuis et al. (2002)) may become numerically too expensive.
Once we calculate the critical cluster size we make use of CNT Volmer and Weber (1926); Becker and Doring (1935); Kelton (1991) in its version for spherical clusters to estimate the surface free energy, :
| (1) |
where is the number density of the solid and is the chemical potential difference between the metastable liquid and the solid at the temperature under consideration. This expression allows us to obtain a value for associated to each cluster. CNT can also be used to estimate the height of the nucleation free-energy barrier, :
| (2) |
Once is known, we can use the following CNT-based expression to evaluate the nucleation rateAuer and Frenkel (2004b):
| (3) |
where is the Zeldovich factor, , and is the attachment rate of particles to the critical cluster. The CNT form of the Zeldovich factor is
| (4) |
which can be obtained from our calculations of . We follow Ref. Auer and Frenkel, 2004b to calculate as a diffusion coefficient of the cluster at the top of the barrier:
| (5) |
Therefore, in order to obtain nucleation rates we combine CNT predictions with simulations of the critical clusters.
By using the methodology here described, the nucleation rate of clathrate hydrates has been recently calculated.Knott et al. (2012) The validity of this approach relies on the ability of CNT to make good estimates of the free energy barrier from measured values of the critical cluster size. CNT is expected to work well for big critical clusters. We are confident that the cluster sizes we deal with in this work are big enough for CNT to produce meaningful predictions. We discuss why in Sec. V.1.
III Technical details
III.1 Simulation details
We carry out GROMACSHess et al. (2008) molecular dynamics simulations (MD) of a system that consists of one spherical ice-Ih cluster surrounded by supercooled water molecules. We use two different rigid non-polarizable models of water: TIP4P/2005Abascal and Vega (2005) and TIP4P/Ice.Abascal et al. (2005) TIP4P/2005 is a model that provides a quantitative account of many water propertiesVega et al. (2009); Vega and Abascal (2011) including not only the well known thermodynamic anomalies but also the dynamical ones.Pi et al. (2009); Gonzalez and Abascal (2010) TIP4P/Ice was designed to reproduce the melting temperature, the densities and the coexistence curves of several ice phases. One of the main differences between the two models is their ice Ih melting temperature at 1 bar: K for TIP4P/2005 and K for TIP4P/Ice. We evaluate long range electrostatic interactions using the smooth Particle Mesh Ewald methodEssmann et al. (1995) and truncate both the LJ and real part of the Coulombic interactions at 9 Å. We preserve the rigid geometry of the water model by using constraints. All simulations are run at the constant pressure of bar, using an isotropic Parrinello-Rahman barostatParrinello and Rahman (1981) and at constant temperature, using the velocity-rescaling thermostat.Bussi et al. (2007) We set the MD time-step to 3 fs.
III.2 Order parameter
To determine the time evolution of the cluster size, we use the rotationally invariant order parameters proposed by Lechner and Dellago, .Lechner and Dellago (2008) In Fig. 1 we show the values for 5000 molecules of either liquid water, ice Ih or ice Ic at 1 bar and 237 K for TIP4P/2005. The cut-off distance to identify neighbors for the calculation of is Å between the oxygen atoms. This approximately corresponds to the position of the first minimum of the oxygen-oxygen pair correlation function in the liquid phase.
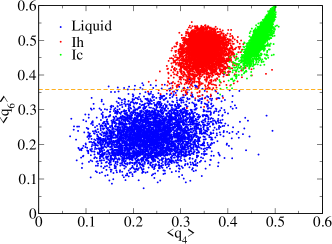
From Fig. 1 it is clear that alone is enough to discriminate between solid-like and fluid-like molecules, as already suggested in Ref. Reinhardt et al., 2012. As a threshold to separate the liquid from the solid clouds in Fig. 1 we choose , represented as a horizontal dashed line in the figure. This threshold separates the liquid from both ice Ih and Ic. Therefore, even though we prepare the clusters with ice-Ih structure, ice-Ic molecules would be detected as solid-like should they appear as the clusters grow. Unlike Refs. Ghiringhelli et al., 2008 and Li et al., 2009 we do not consider as solid-like particles on the surface which are neighbor to solid-like particles. Once molecules are labelled either as solid or liquid-like, the solid cluster is found by means of a clustering algorithm that uses a cut-off of 3.5 Å to find neighbors of the same cluster.
III.3 Initial configuration
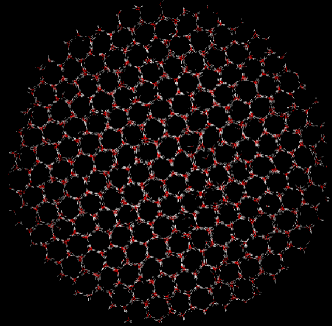
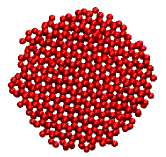
We prepare the initial configuration by inserting a spherical ice-Ih cluster (see Fig. 2 for a cluster of 4648 molecules) into a configuration of supercooled water with times as many molecules as the cluster.
To obtain the cluster, we simply cut a spherical portion of a large equilibrated ice Ih crystal. Next, we insert the ice cluster in the supercooled liquid removing the liquid molecules that overlap with the cluster. Finally, we equilibrate the system for about 0.2 ns at 200 K. This time is long enough to equilibrate the cluster-liquid interface (see Supporting Information). We then perform simulations for three different system/cluster sizes labeled as H (Huge), L (Large) and B (Big) (see Table 1). As far as we are aware, the studied system size are beyond any previous numerical study of ice nucleation. Calculations were performed in the Spanish super-computer Tirant. For system H we use 150 nodes yielding 0.72 ns/day; for system L, 50 nodes at 1.5 ns/day and, for system B, 32 nodes at 4.7 ns/day.
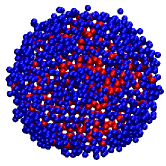
Our order parameter allows us to correctly identify as solid-like the great majority of the molecules belonging to the cluster shown in Fig. 2 (4498 out of 4648). Fig. 3(a) shows that indeed most molecules of the inserted ice cluster are detected as solid-like (red) as opposed to liquid-like (blue). Notice that most blue particles in Fig. 3(a) are located at the interface. This is not surprising giving that our order parameter was tuned to distinguish between liquid-like and solid-like particles in the bulk. Fig. 3(a) corresponds to the cluster just inserted in the liquid. After 0.2 ns of equilibration our order parameter detects that the number of molecules in the cluster drops down to 3170. To explain the origin of this drop we show in Fig. 3(b) a snapshot of the 4648 inserted molecules after the 0.2 ns equilibration period. Clearly, the drop comes from the fact that the outermost layer of molecules of the inserted cluster becomes liquid-like during equilibration. By removing the liquid-like molecules from Fig. 3(b) one can easily identify again the hexagonal channels typical of ice (Fig. 3(c)). Therefore, the drop from 4648 to 3170 molecules in the ice cluster is due to the equilibration of the ice-water interface. The size of the equilibrated clusters, , is given in Table 1.
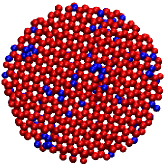
(a)
 (b)
(b)
 (c)
(c)
System B 22712 1089 600 600 16.7 16.8 L 76781 4648 3170 3167 29.1 29.2 H 182585 9998 7931 7926 39.5 39.7
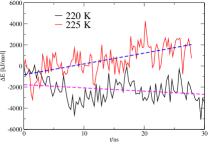
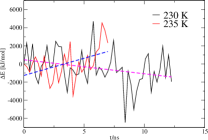
Once the interface is equilibrated for ns, the number of molecules in the cluster grows or shrinks (depending on the temperature) at a much slower rate (typically requiring several nanoseconds as it is shown in Fig. 4). The initial time in our simulations corresponds to the configuration equilibrated after 0.2 ns. We run MD simulations of the system with the equilibrated interface at several temperatures below the bulk melting temperature of the model. The objective is to find a temperature range within which the cluster can be considered to be critical. The temperature range is comprised between the lowest temperature at which the solid cluster melts and the highest at which it grows. We monitor the number of molecules in the cluster and the global potential energy to find whether the cluster melts or grows.
IV Results
IV.1 Size of the critical clusters
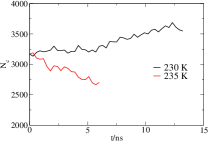
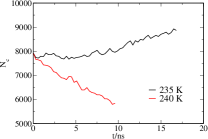
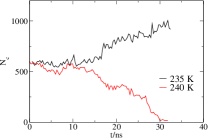
In Fig. 4 we represent the number of molecules in the ice cluster versus time for system H, TIP4P/2005.
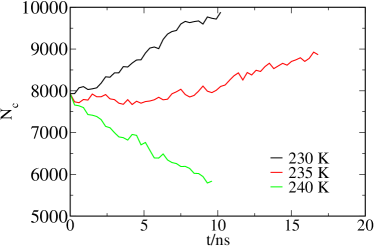
Depending on the temperature the cluster either grows (230 K and 235 K) or shrinks (240 K). The highest temperature at which the cluster grows is 235 K and the lowest temperature at which it melts is 240 K. Hence, a cluster of 7900 molecules (as detected by our order parameter) is critical at K. An analogous result can be obtained by monitoring the potential energy of the system as a function of time. (see Supporting Information). A decrease in the energy corresponds to the cluster’s growth whereas an increase in the energy corresponds to its melting. By doing this analysis for both models (TIP4P/2005 and TIP4P/Ice ) and for the three cluster sizes (H, L, and B ), we obtain the results summarized in Table 2.
Model System TIP4P/2005 B 600 222.5 29.5 0.114 20.4 77 TIP4P/2005 L 3170 232.5 19.5 0.080 24.9 275 TIP4P/2005 H 7931 237.5 14.5 0.061 25.9 515 TIP4P/Ice B 600 237.5 34.5 0.133 23.6 85 TIP4P/Ice L 3167 252.5 19.5 0.083 25.4 261 TIP4P/Ice H 7926 257.5 14.5 0.063 26.3 487
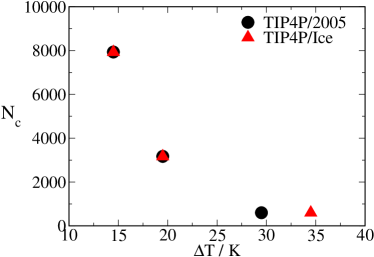
For the temperatures explored in this work (from about 15 K to 35 K below the melting temperature of both TIP4P/2005 and TIP4P/Ice) the size of the ice critical cluster ranges from nearly 8000 (radius of 4 nm) to about 600 molecules (radius of 1.7 nm). This compares reasonably well with a critical cluster radius of 1.3 nm obtained by applying CNT to experimental measurements at a supercooling of about 40 K.Liu et al. (2007); Kiselev (2001) Our results are also consistent with CNT based estimates of the critical size at lower supersaturations.Bogdan (1997); Kashchiev (2000) For instance, in Fig. 15.7 of Ref. Kashchiev (2000), a critical cluster size ranging from 1000 to 300 molecules is predicted for 25 K 30 K. An interesting remark is that the temperatures of the TIP4P/Ice are basically shifted 20 K above the the corresponding ones for TIP4P/2005 with the same nucleus size. This is precisely the difference between the melting temperatures of both models and, thus, the supercoolings are very similar for a given ice cluster size in both models. This is more clearly shown in Fig. 5 where the size of the critical cluster is plotted as a function of the the difference between the melting temperature of the model and the temperature of interest . We observe that, within our error bar, the critical cluster size of both models scales in the same way with respect to their melting temperatures. This is not so surprising since TIP4P/2005 and TIP4P/Ice present a similar charge distribution and mainly differ in the choice of the potential parameters.
In previous worksVega and de Miguel (2007); Vega et al. (2009); Vega and Abascal (2011) we observed that, for a number of properties, the values of TIP4P/2005 lie in the middle of the values obtained for TIP4P and TIP4P/Ice. Therefore, it is expected that TIP4P gives similar results to TIP4P/2005 and TIP4P/Ice regarding the dependence of with . Matsumoto et al.Matsumoto et al. (2002) studied ice nucleation at 230 K and a density of 0.96 g/cm3 using the TIP4P model. This thermodynamic state point corresponds to a pressure of about -1000 bar and 5 K.Sanz et al. (2004) By extrapolating the data of Fig. 5 to one gets a critical cluster of the order of hundreds of thousand molecules. Therefore, it is likely that the results obtained by Matsumoto et al.Matsumoto et al. (2002), although pioneering and useful to learn about the ice nucleation pathway, may suffer from system size effects and may not be valid to estimate either the size of the critical cluster or the nucleation rate.
In an important paper, Koop et al.Koop et al. (2000) showed that the homogeneous nucleation rate (and therefore the temperature of homogeneous nucleation) of pure water and of water solutions can be described quite well by a function that depends only on the water activity. This conclusion has been confirmed in more recent experiments.Knopf and Rigg (2011) Although the nucleation rate for an aqueous solution is the same as for pure water, the freezing points are different. One is then tempted to suggest that the size of the critical cluster at the homogeneous nucleation temperature could be the same for pure water and for aqueous solutions. Moreover, the fact that thermodynamics is sufficient to predict the rate seems to indicate that the water mobility is also determined by the free energy of water. A microscopic study of the relationship between crystallization rates, structure and thermodynamics of water which may explain the empirical findings of Koop and coworkers has recently been presented in Ref. Moore and Molinero, 2011a.
IV.2 Interfacial free energy and free energy barrier
Once the size of the critical cluster is known, one can use Eq. 1 to estimate the solid-liquid interfacial free energy. Since ice density changes little with temperatureNoya et al. (2007), the density at coexistence is used in our calculations (=0.906 g/cm3 and =0.921 g/cm3). For most substances it is possible to approximate by , where is the melting enthalpy and is the melting temperature. For water, however, this may not be a good approximation because significantly changes with temperature as a manifestation of the anomalous sharp increase of the heat capacity of water as temperature decreases.Jeffery and Austin (1997); Kumar et al. (2007) Hence, one needs to do a proper evaluation of the chemical potential difference between both phases to get the surface free energy from Eq. 1. We have calculated at every temperature by means of standard thermodynamic integration Frenkel and Smit (1996) from the coexistence temperature, at which . In Table 2 we report the values we obtain for and .
First of all we note that decreases with temperature for both models. This is in qualitative agreement with experimental estimates of the behavior of with .Pruppacher (1995); Zobrist et al. (2007); Alpert et al. (2011) A more quantitative comparison is not possible in view of the large discrepancies between different estimates (see Fig. 10 in Ref. Pruppacher, 1995). Motivated by the fact that the interfacial free energy can only be measured at coexistence, we extrapolate our results to the melting temperature. To do that, we take the two largest clusters and evaluate the slope of . We get a value for the slope of 0.18 mN/(m K) for both models, in very good agreement with a recent calculation for the TIP4P/2005 model.Reinhardt and Doye (2013) With a linear extrapolation we get a value for at of 28.7 mN/m for both models, which can be compared to experimental measurements. In contrast with the vapor-liquid surface tension, the value of for the solid-fluid interface is not well established. Experimental values range from 25 to 35 mN/m.Granasy et al. (2002) Our calculated data for at coexistence lies in the middle of that range, so our models predict a surface free energy which is consistent with current experimental data. We now compare our estimated to direct calculations from simulations using a planar interface. The value of depends on the plane in contact with the liquid. Since the cluster used here is spherical we shall compare with the average of the values obtained for the basal and prismatic planes. Davidchak et al. computed for a planar fluid-solid interface using two models similar to those used in this work: TIP4P and TIP4P-Ew. For TIP4P, in an initial publication the authors reported a value of mN/mHandel et al. (2008) that was later on modified (after improving their methodology) to mN/m.Davidchack et al. (2012) For the TIP4P-EwHorn et al. (2004) Davidchak et al. reported (using the improved methodology) a value of mN/m.Davidchack et al. (2012) TIP4P-Ew is known to predict water properties in relatively close agreement to those of TIP4P/2005. Therefore, our results are also consistent with the calculations reported in the literature for similar models. To conclude, our values of seem to be reasonable estimates of the interfacial free-energy of the planar ice-water interface.
To estimate the height of the nucleation free-energy barrier we make use of Eq. 2. Our results are summarized in Table 2. In view of the height of the nucleation barrier for the clusters of systems L and H, around 250 and 500 respectively, it seems virtually impossible to observe homogeneous nucleation of ice for supercoolings lower than 20 K. The height of the nucleation barrier provides an estimate of the concentration of critical clusters in the metastable fluid as , where is the number density of the fluid. For , one critical cluster would appear on average in a volume 1060 times larger than the volume of the whole hydrosphere. From the values of of Table 2 we may infer why spontaneous ice nucleation has never been observed in previous studies of supercooled water with the TIP4P/2005 modelAbascal and Vega (2010, 2011); Wikfeldt et al. (2011). Our results show that the free energy barrier for nucleation even for temperatures as low as 35 K below melting is still of about 80 . This is much larger than the typical barrier found in studies where spontaneous crystallization occurs in brute force simulations Filion et al. (2010); Lundrigan and Saika-Voivod (2009) (about ). It is worth mentioning that neither Shevchuk and RaoShevchuk and Rao (2012) nor Overduin and PateyOverduin and Patey (2013) find any evidence of ice nucleation in TIP4P models after runs of several microseconds which is consistent with the results of this work. Our results may be of great interest to studies in which the competition between the crystallization time and the equilibration time of water is crucialLimmer and Chandler (2013); Poole et al. (2013); Liu et al. (2012).
IV.3 Nucleation rate
Although the free energy barriers alone provide a strong indication that ice can not appear on our planet via homogeneous nucleation at moderate supercoolings ( K), it is worth calculating the nucleation rate, , to confirm such statement. The nucleation rate takes into account not only the concentration of the clusters but also the speed at which these are formed. Moreover, the supercoolings for the smallest clusters we investigate are comparable to those where most experimental measurements of have been made ( 35 K).Taborek (1985); Pruppacher (1995); Knopf and Rigg (2011); Riechers et al. (2013); Pruppacher and Klett (1997)
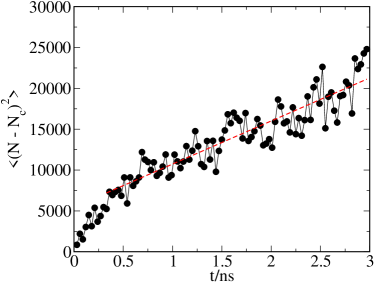
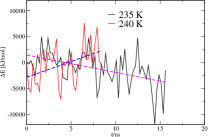
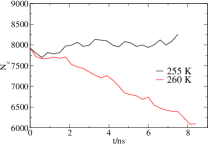
To calculate the nucleation rate we use Eq. 3. First, we compute from Eq. 5 by running 30 simulations of the cluster at the temperature at which it was determined to be critical. We monitor and average it over all the runs. In Fig. 6 we plot versus time for the system L, TIP4P/2005. From the slope at long times we can infer .Auer and Frenkel (2004b) We get . The Zeldovich factor for this particular case is , and the density of the liquid is 0.977 g/cm3. With this, we have all the ingredients needed to calculate the nucleation rate via Eq. 3. The final result for this case is (m-3s-1))=-83.
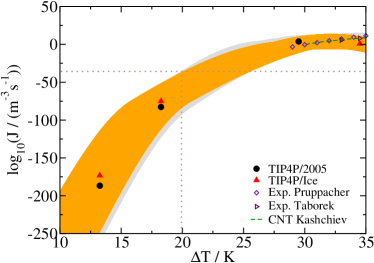
The same procedure is used to calculate the nucleation rate for the rest of the systems described in Table 1. The results for the nucleation rate as a function of the supercooling are presented in Fig. 7 and compared to the experimental measurements of PruppacherPruppacher (1995) and TaborekTaborek (1985). The horizontal dashed line corresponds to the nucleation rate required for the appearance of one critical cluster in the volume of Earth’s hydrosphere in the age of the universe, which we call “impossible nucleation rate”. The vertical line shows at which temperature the impossible nucleation rate line intercepts the upper limit of our error bars (grey and orange shadows for TIP4P/2005 and TIP4P/Ice respectively). In view of this figure we can confidently claim what the free energy barriers previously hinted: it is impossible that ice nucleates homogeneously in our planet for K. In other words, heterogeneous nucleation must take place in order for water to freeze for supercoolings lower than 20 K. This is consistent with the fact that, when heterogeneous nucleation is suppressed, moderately supercooled water can remain metastable long enough for its thermodynamic properties to be measured.Speedy and Angell (1976); Hare and Sorensen (1987); Mishima (2010); Debenedetti (2003); Holten et al. (2012) From our results it is also clear that ice formation should not be expected in brute force molecular dynamics simulations at moderate supercoolings (provided that the system is large enough not to be affected by finite size effects).Matsumoto et al. (2002) To observe ice formation in brute force simulations the nucleation rate should be higher than (m-3s-1)) = 32 (this number is obtained assuming the formation of ice after running about 100 ns in a system of about 50nm3, which are typical values in computer simulations of supercooled water). Notice also that the maximum in the isothermal compressibility at room pressureAbascal and Vega (2010, 2011) found at about K for the TIP4P/2005 model can not be the ascribed to the transient formation of ice as the nucleation rate of ice at this temperature is negligible.
Another interesting aspect of Fig. 7 is the comparison with experiment. Both models give nucleation rates that reproduce the experimental measurements within the uncertainty of our method. This excellent result brings confidence in the ability of the selected models to predict relevant quantities for the nucleation of ice such as the nucleation rate, the critical cluster size, and the surface free energy.
We also include in Fig. 7 a green dashed line that corresponds to the CNT based estimates of shown in Fig. 13.6 of Ref. Kashchiev (2000) The agreement between CNT, simulations and experiments is quite satisfactory. To the best of our knowledge, there are no CNT estimates of available for supersaturations lower than 30 K to compare our results with.Pruppacher (1995); Kashchiev (2000); Murray et al. (2010)
By using Forward Flux SamplingAllen et al. (2005), Li et al. determined for the mW model of water for temperatures between 35 and 55 K below the model’s melting temperature.Li et al. (2011) Since we are interested in ice nucleation at moderate supersaturation, our study deals with lower supercoolings ( K K). Nonetheless, our highest supercooling (34.5 K) is very close to the lowest one of Li et al. (35 K) so we can compare both results. The values of Li et al. for are 5-8 orders of magnitude below the experimental ones when compared at the same absolute temperature (the deviation increases when the comparison is made at the same degree of supercooling). The nucleation rates calculated in this work for TIP4P/2005 and TIP4P/ice are similar (although slightly larger) to those for the mW model. Initially this may appear surprising as the mW model is a coarse grained model of water with no hydrogens, which makes its dynamics faster than that of both real water and TIP4P-like models.Molinero and Moore (2009) However the free energy barrier of mW may be larger, compensating this kinetic effect. In fact the interfacial free energy of mW has been foundLi et al. (2011) to be mN/m (larger than the values found in this work for TIP4P/2005 and TIP4P/Ice). This high value of may be partially compensated by a significant overestimate of the ice density of this model (0.978 g/cm3 to be compared to the experimental result 0.91 g/cm3). The net balance is that the values of of the mW model are similar, although somewhat lower, than those for TIP4P/2005 and TIP4P/ice.
As for the size of the critical cluster, we find that it is of about 600 water molecules for TIP4P/Ice at 237.5 K ( K). Li et al. have reported a critical cluster size of about 850 molecules for the mW model at 240 K ( K). Both results are compatible since Li et al. include in the ice cluster molecules which are neighbor to the solid cluster, and we do not. In summary, our results for TIP4P/2005 and TIP4P/Ice are consistent with Li’s et al. for mW.
V Discussion
V.1 Validity and possible sources of error
The methodology we have used is subject to two main error sources: the determination of the cluster size and the location of the temperature at which the clusters are found to be critical. Moreover, our approach relies on the validity of CNT. In the following paragraphs we discuss the extent to which our results may be affected by these issues.
In nucleation studies, the size of the largest solid cluster is usually considered a good reaction coordinate. To identify the cluster, we first need to distinguish between liquid-like and solid-like molecules. The chosen criterion should be able to identify the majority of molecules of the bulk solid as solid-like, and the majority of molecules of the bulk fluid as liquid-like. One could in principle find several criteria that successfully perform this task. However, when interfaces are present in the system (as in the case of a solid-liquidFilion et al. (2010) or a solid-vaporVega et al. (2006); Conde et al. (2008) interface) depending on the chosen criterion one might assign differently the interfacial molecules (see for instance References Reinhardt and Doye, 2012 and Li et al., 2011 for an illustration of this problem for the mW water model).
How does the choice of a criterion to distinguish liquid from solid-like molecules affect our results? Whether the cluster grows or shrinks for a given temperature does not depend on the particular choice of the order parameter (see Supporting Information). The same trend can be obtained by monitoring global thermodynamic properties of the system, such as the total potential energy (see Supporting Ingormation). Therefore, the fact that the cluster shown in Fig. 3 is critical at 232.5 K is independent on the particular choice of the criterion to distinguish liquid from solid-like molecules.
A different problem arises if one asks the question: how many ice molecules are present in Fig.3b? Different criteria provide different answers even though the configuration presented in Fig.3b is unique. Since the origin of this arbitrarity is due to the interfacial region, it is expected that the arbitrarity will become smaller as the ice cluster becomes larger. However, for the system sizes considered in this work the interface region still matters. To take this effect into account we have estimated the error bars in Fig. 7 considering an arbitrarity of 60% in the labeling of interfacial molecules. This would affect the value of by 7%, and the free-energy barriers height by up to 20%. Although this estimated error seems large, it is worth pointing out that differences between the free-energy barrier estimated by different groups may be, in the case of water, much larger than that.Radhakrishnan and Trout (2003b); Radhakrishnan and Trout (2003a); Quigley and Rodger (2008); Brukhno et al. (2008) In summary we conclude that the liquid/solid criterion chosen in this work provides reasonable estimates of , and when used within the CNT framework allows to interpret our simulations results in a rather straightforward way.
Another important error source in the calculation of is the location of the temperature at which a cluster is critical. As we show in Fig. 4, by performing runs at different temperatures we identify, within a certain range, the temperature that makes critical a given ice cluster. We assign the temperature in the middle of the range to the corresponding cluster, but the temperature that really makes the cluster critical could in principle be any other within the range. This uncertainty has a strong contribution to the error bars in Fig 7, particularly at low supercoolings, where the variation of with is very steep. This error could, in principle, be easier to reduce than that coming from the arbitrarity in the determination of the number of particles in the cluster. One simply has to do more runs to narrow the temperature range. However, these simulations are very expensive given the large system sizes we are dealing with. It is interesting to point out that temperature control is also seen as a major error source in experiments.Riechers et al. (2013)
Our results for , , and rely on the validity of CNT. Classical Nucleation Theory is expected to break down for small clusters, when the view of nucleation as a competition between bulk and surface free energies starts to be questionable (in clusters of a few hundred particles most molecules are placed at the surface). However, for the large cluster sizes investigated in this work it seems reasonable to assume that CNT works well. The satisfactory comparison of our estimate of with that obtained in simulations of a flat interfaceDavidchack et al. (2012) is certainly encouraging in this respect. Moreover, we have applied the methodology described in this paper to calculate the nucleation rate of the mW water model and we get, within error, the same nucleation rate as in Ref.Li et al. (2011) This is a very stringent test to our approach, given that in RefLi et al. (2011) a method that relies neither on CNT nor on the definition of the cluster size was used (Forward Flux Sampling). This comparison is made for a supercooling of 35 K, the deepest investigated in this work. For lower supercoolings, where the critical cluster is larger, the methodology is expected to be even more robust. The advantage of the approach used here is that it allows to estimate (at a reasonable computational cost) critical cluster sizes and nucleation rates at low and moderate supercooling.
V.2 Novelty
In this paper we provide values for the homogeneous nucleation rate of ice at moderate supercoolings ( K). For the first time, this is done without extrapolating from measurements at high supercoolings. The experimental determination of is limited to a narrow temperature window at high supercoolings (between 233 K and 239 K). In that window, can be directly measured without introducing any type of approximation. It only requires the knowledge of the droplet volume, the cooling rate and the fraction of freezing events. Differences in the value of between different experimental groups are relatively small (between one and two orders of magnitude). Therefore, the experimental value of is well established for the narrow range of temperatures in which the current experimental techniques can probe the nucleation rate.Taborek (1985); Pruppacher (1995); Knopf and Rigg (2011); Riechers et al. (2013); Pruppacher and Klett (1997) To obtain values of outside that temperature window one can either extrapolate the data or make an estimate via CNT. An extrapolation from such a narrow temperature window would not be very reliable because changes sharply with T. In turn, an estimate of based on CNT relies in the knowledge of the interfacial free energy. Unfortunately, our current knowledge of for the water-ice interface is far from satisfactory in at least three respects. Firstly, the calculated values of different groups using CNT differ significantly (see for instance Tables I and II in Ref Murray et al., 2010). Secondly, the values obtained for from CNT seem to be different from those determined for a planar ice-water interface at the melting point (see for instance Fig. 8 in Ref Bartell and Huang, 1994). Finally, there is even no consensus about the value of for a planar interface at the melting point of water, a magnitude that in principle could be obtained from direct experiments without invoking CNT (values between 25 and 35 mN/m have been reported). A look to Fig. 10 of the classic paper of PruppacherPruppacher (1995) is particularly useful. It shows the enormous uncertainty that exists at any temperature about the value of for the ice-water interface. Since enters in the estimation of as a power of three in an exponential term, the enormous scatter implies that, at this moment, there is no reliable estimate of the value of for moderately supercooled water arising from CNT. In other words, you can get many different estimates of from the different estimates of shown in the paper by Pruppacher. In addition, to the best of our knowledge, no one has estimated using CNT for supersaturations lower than 30 K. Pruppacher (1995); Kashchiev (2000); Murray et al. (2010)
Regarding the critical nucleus size, it is not possible at the moment to measure it experimentally by direct observation. Therefore, the prediction of the critical cluster at moderate and experimentally accessible supercoolings is a novel result. Since the TIP4P/2005 has been quite successful in describing a number of properties of water (notably including the surface tension for the vapor-liquid equilibrium) we believe that the values reported here for and from our analysis of the critical cluster are a reasonable estimate for the corresponding values for real water.
V.3 Summary and outlook
We have studied homogeneous ice nucleation by means of computer simulations using the TIP4P/2005 and TIP4P/Ice water models. This is the first calculation of the size of the critical cluster and the nucleation rate at moderate supercoolings (14.5-35 K). Both models give similar results when compared at the same supercooling.
To determine the size of the critical cluster, we use a numerical approach in the spirit of direct coexistence methods. We prepare an initial configuration by inserting a large ice cluster (about 10000, 4600 and 1000 molecules) in an equilibrated sample of liquid water. Then, we let the interface equilibrate for 0.2 ns at 200 K. Finally, we perform molecular dynamic runs at several temperatures to detect either the melting or the growth of the inserted cluster by monitoring its size. We find that the size of the critical cluster varies from 8000 molecules (radius nm) at 15 K below melting to 600 molecules (radius nm) at 35 K below melting.
We use CNT to estimate the interfacial free energy and the nucleation free energy barrier. Our predictions show that the interfacial free energy decreases as the supercooling increases, in agreement with experimental predictions. An extrapolation of the interfacial free energy to the melting temperature gives a value of 29(3) mN/m, which is in reasonable agreement with experimental measurements and with estimates obtained from computer simulations for TIP4P-like models. We get free energy barriers higher than 250 kT for supercoolings lower than 20 K. This strongly suggests that homogeneous ice nucleation for supercoolings lower than 20 K is virtually impossible. We confirm this by calculating the nucleation rate. To do that we compute, by means of molecular dynamics simulations, the rate at which particles attach to the critical clusters. These calculations show that, indeed, for supercoolings lower than 20 K it is impossible that ice nucleates homogeneously. According to this prediction, ice nucleation must necessarily be heterogeneous for supercoolings lower than 20 K. The nucleation rate we obtain at higher supercoolings (30-35 K) agrees, within the statistical uncertainty of our methodology, with experimental measurements.
It would be interesting to extend this work in several directions. Modifying the shape of the inserted
cluster (inserting for instance a small crystal with planar faces) or even inserting a block of
cubic ice Ic to analyse whether this cluster may be more stable as suggested by some studiesHuang and Bartell (1995); Murray et al. (2010)
are interesting issues that deserve further studies.
Secondly, it would be of interest to consider other water models, to analyse the possible similarities/differences
with respect to nucleation of different potential models varying significantly either in the charge distribution
as TIP5PMahoney and Jorgensen (2000) or in the way the tetrahedral order is induced as in the mW model.Molinero and Moore (2009)
Analyzing the behaviour at higher degrees of supercooling than those presented here is another interesting problem as
well as the determination of the growth rate of ice.Razul and Kusalik (2011)
We foresee that all these issues will be the centre of significant activity in the near future.
VI Supporting Information to “Homogeneous ice nucleation at moderate supercooling from molecular simulation”
VI.1 Equilibration of the initial configuration
The preparation protocol used for all cluster sizes is the following. After having inserted the ice cluster in the supercooled liquid, we remove the liquid molecules overlapping with the solid ones. Next, we equilibrate the system for about 0.2 ns at 200 K. To make sure that the chosen 0.2 ns is a proper equilibration time, long enough to allow for annealing mismatches at the interface, we run a simulation starting from the initial configuration at time zero. In Fig. 8, we represent the cluster size for the Large system of the TIP4P/2005 model as a function of time.
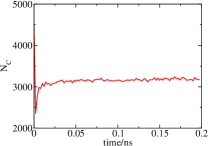
The figure shows that, even though the dynamics is very slow at such low temperatures, the chosen equilibration time is long enough. This result is independent on the chosen cluster size or water model potential.
VI.2 Choice of the order parameter to distinguish between liquid/solid particles
The use of an alternative order parameter to identify solid-like particles () does not affect the observed response of the cluster to temperature. This is shown in Fig. 9, where the number of particles in the cluster is monitored with two different order parameters for three different temperatures. Both order parameters allow to conclude that the inserted cluster is critical between 235 and 240 K. Obviously, the number of particles that belong to the cluster does depend on the order parameter. The order parameter we use in this work should at least work well for the inner particles given that, according to Fig. 1 of the main text, it is able to discriminate between bulk liquid and bulk solid particles. The main ambiguity in the number of particles belonging to the cluster comes from those particles that lie in the interface. In view of Fig. 3 of the main text, it seems that our order parameter is doing reasonably well in identifying such particles either. Nonetheless, we have considered an error as large as 60% in the identification of the interfacial particles to estimate the error of the nucleation rate. In this way the unavoidable ambiguity in the determination of the cluster size is reflected in the error bar of .
VI.3 Cluster size and potential energy versus time for all system sizes and model potentials studied
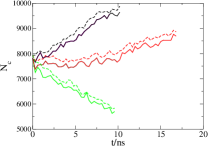
In order to determine the temperature at which the cluster was critical, we evaluated the highest temperature at which the cluster grows and the lowest temperature at which it melts. In Fig. 4 of the main text we represented the number of molecules in the ice cluster versus time for system H simulated with TIP4P/2005 potential. In what follows, we present the results of the cluster size versus time for all sizes (B,L and H) for both the TIP4P/2005 (Fig.10) and TIP4P/Ice water models (Fig.11). An analogous result could have been obtained by monitoring the potential energy of the system as a function of time (see the right panels at Figs. 10 and 11).
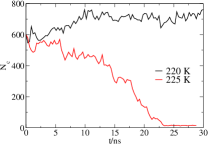
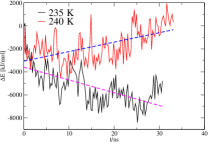
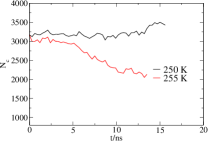
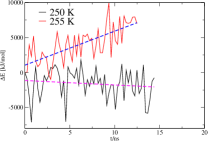
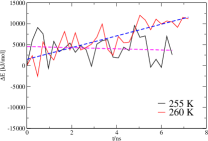
The energy is much less sensitive to changes in the cluster size than the order parameter. This is due to the fact that the number of molecules in the cluster is a small fraction of the total number of molecules. Nonetheless, by making a linear fit to the time evolution of the energy we obtain in all cases consistent results with the analysis based in the order parameter: the cluster grows when the slope is negative and shrinks when it is positive.
VII Acknowledgments
E. Sanz acknowledges financial support from the EU grant 322326-COSAAC-FP7-PEOPLE-2012-CIG and from the Spanish grant Ramon y Cajal. C. Valeriani acknowledges financial support from the EU grant 303941-ANISOKINEQ-FP7-PEOPLE-2011-CIG and from the Spanish grant Juan de la Cierva. Fundings also come from MECD Project FIS2010-16159 and from CAM MODELICO P2009/ESP/1691. All authors acknowledge the use of the super-computational facility Tirant at Valencia from the Spanish Supercomputing Network (RES), along with the technical support and the generous allocation of CPU time to carry out this project (through projects QCM-2012-2-0017, QCM-2012-3-0038 and QCM-2013-1-0047). One of us (C. Vega) would like to dedicate this paper to the memory of Prof. Tomas Boublik. We thank the three referees for their useful comments and to A. Reinhardt and J.P.K. Doye for sending us a preprint of their work prior to publication.
References
- Debenedetti (1996) P. G. Debenedetti, Metastable liquids: Concepts and Principles (Princeton University Press, 1996).
- Kashchiev (2000) D. Kashchiev, Nucleation: Basic Theory with Applications (Butterworth-Heinemann, Oxford, 2000).
- Cantrell and Heymsfield (2005) W. Cantrell and A. Heymsfield, Bull. Amer. Meteor. Soc. 86, 795 (2005).
- Baker (1997) M. B. Baker, Science 276, 1072 (1997).
- DeMott et al. (2010) P. J. DeMott, A. J. Prenni, X. Liu, S. M. Kreidenweis, M. D. Petters, C. H. Twohy, M. S. Richardson, T. Eidhammer, and D. C. Rogers, Proc. Nat. Acad. Sci. USA 107, 11217 (2010).
- Morris and Acton (2013) G. J. Morris and E. Acton, Cryobiology 66, 85 (2013).
- Hirano and Upper (2000) S. S. Hirano and C. D. Upper, Microbiol. Molec. Biol. Rev. 64, 624 (2000).
- Maki et al. (1974) L. R. Maki, E. L. Galyan, C. M.M., and D. R. Caldwell, Appl. Microbiol. 28, 456 (1974).
- Li and Lee (1995) J. K. Li and T. C. Lee, Trends in Food Sci. & Tech. 6, 259 (1995).
- Michaelides and Morgenstern (2007) A. Michaelides and K. Morgenstern, Nature Materials 6, 597 (2007).
- Gerrard (1988) A. G. Gerrard, Rocks and Landforms (Springer Netherlands, 1988).
- Pruppacher (1995) H. R. Pruppacher, J. Atmosph. Sci. 52, 1924 (1995).
- Taborek (1985) P. Taborek, Phys. Rev. B 32, 5902 (1985).
- Knopf and Rigg (2011) D. A. Knopf and Y. J. Rigg, J. Phys. Chem. A 115, 762 (2011).
- Moore and Molinero (2011a) E. B. Moore and V. Molinero, Nature 479, 506 (2011a).
- Li et al. (2011) T. Li, D. Donadio, G. Russo, and G. Galli, Phys. Chem. Chem. Phys. 13, 19807 (2011).
- Riechers et al. (2013) B. Riechers, F. Wittbracht, A. Hutten, and T. Koop, Phys. Chem. Chem. Phys. 15, 5873 (2013).
- Kramer et al. (1999) B. Kramer, O. Hubner, H. Vortisch, L. Woste, T. Leisner, M. Schwell, E. Ruhl, and H. Baumgartel, J. Chem. Phys. 111, 6521 (1999).
- Stockel et al. (2005) P. Stockel, I. M. Weldinger, H. Baumgartel, and T. Leisner, J. Phys. Chem. A 109, 2540 (2005).
- Murray et al. (2010) B. J. Murray, S. L. Broadley, T. W. Wilson, S. J. Bull, R. H. Wills, H. K. Christenson, and E. J. Murray, Phys. Chem. Chem. Phys. 12, 10380 (2010).
- Mishima (2010) O. Mishima, J. Chem. Phys. 133, 144503 (2010).
- Debenedetti (2003) P. G. Debenedetti, J. Phys. Condens. Matter 15, R1669 (2003).
- Mori et al. (1996) A. Mori, M. Maruyama, and Y. Furukawa, J. Phys. Soc. Japan 65, 2742 (1996).
- Jeffery and Austin (1997) C. A. Jeffery and P. H. Austin, J. Geophys. Research 102, 25269 (1997).
- Kiselev (2001) S. B. Kiselev, Int. J. Thermophys. 22, 1421 (2001).
- Liu et al. (2007) J. Liu, C. E. Nicholson, and S. J. Cooper, Langmuir 23, 7286 (2007).
- ten Wolde and Frenkel. (1997) P. R. ten Wolde and D. Frenkel., Science 277, 1975 (1997).
- Auer and Frenkel (2001a) S. Auer and D. Frenkel, Nature 409, 1020 (2001a).
- Sear (2012) R. P. Sear, Internat. Materials Rev. 57, 328 (2012).
- Svishchev and Kusalik (1994) I. Svishchev and P. G. Kusalik, Phys. Rev. Lett. 73, 975 (1994).
- Koga et al. (2001) K. Koga, G. T. Gao, H. Tanaka, and X. C. Zeng, Nature 412, 802 (2001).
- Moore et al. (2010) E. B. Moore, E. de la Llave, K. Welke, D. A. Scherlis, and V. Molinero, Phys. Chem. Chem. Phys. 12, 4124 (2010).
- Vrbka and Jungwirth (2006) L. Vrbka and P. Jungwirth, J. Phys. Chem. B 110, 18126 (2006).
- Moore and Molinero (2010) E. B. Moore and V. Molinero, J. Chem. Phys. 132, 244504 (2010).
- Moore and Molinero (2011b) E. B. Moore and V. Molinero, Phys. Chem. Chem. Phys. 13, 20008 (2011b).
- Matsumoto et al. (2002) M. Matsumoto, S. Saito, and I. Ohmine, Nature 416, 409 (2002).
- Yamada et al. (2002) M. Yamada, S. Mossa, H. E. Stanley, and F. Sciortino, Phys. Rev. Lett. 88, 195701 (2002).
- Kesselring et al. (2013) T. A. Kesselring, E. Lascaris, G. Franzese, S. V. Buldyrev, H. J. Hermann, and H. E. Stanley, J. Chem. Phys. 138, 244506 (2013).
- Radhakrishnan and Trout (2003a) R. Radhakrishnan and B. Trout, J. Am. Chem. Soc 125, 7743 (2003a).
- Radhakrishnan and Trout (2003b) R. Radhakrishnan and B. L. Trout, Phys. Rev. Lett. 90, 158301 (2003b).
- Quigley and Rodger (2008) D. Quigley and P. M. Rodger, J. Chem. Phys. 128, 154518 (2008).
- Brukhno et al. (2008) A. V. Brukhno, J. Anwar, R. Davidchack, and R. Handel, J. Phys. Condens. Matter 20, 494243 (2008).
- Reinhardt and Doye (2012) A. Reinhardt and J. P. K. Doye, J. Chem. Phys. 136, 054501 (2012).
- Reinhardt and Doye (2013) A. Reinhardt and J. P. K. Doye, The Journal of Chemical Physics 139, 096102 (2013).
- Zobrist et al. (2007) B. Zobrist, T. Koop, B. P. Luo, C. Marcolli, and T. Peter, J. Phys. Chem. C 111, 2149 (2007).
- Alpert et al. (2011) P. A. Alpert, J. Y. Aller, and D. A. Knopf, Phys. Chem. Chem. Phys. 13, 19882 (2011).
- Hardy (1977) S. C. Hardy, Philos. Mag. 35, 471 (1977).
- Davidchack et al. (2012) R. L. Davidchack, R. Handel, J. Anwar, and A. V. Brukhno, J. Chem. Theory Comput. 8, 2383 (2012).
- Abascal and Vega (2005) J. L. F. Abascal and C. Vega, J. Chem. Phys. 123, 234505 (2005).
- Abascal et al. (2005) J. L. F. Abascal, E. Sanz, R. G. Fernandez, and C. Vega, J. Chem. Phys. 122, 234511 (2005).
- Vega and Abascal (2011) C. Vega and J. L. F. Abascal, Phys. Chem. Chem. Phys 13, 19663 (2011).
- Bai and Li (2006) X. M. Bai and M. Li, J. Chem. Phys. 124, 124707 (2006).
- Ladd and Woodcock (1978) A. J. C. Ladd and L. Woodcock, Molec. Phys. 36, 611 (1978).
- Pereyra et al. (2011) R. G. Pereyra, I. Szleifer, and M. A. Carignano, J. Chem. Phys. 135, 034508 (2011).
- Jacobson and Molinero (2011) L. C. Jacobson and V. Molinero, J. Am. Chem. Soc 133, 6458 (2011).
- Knott et al. (2012) B. C. Knott, V. Molinero, M. F. Doherty, and B. Peters, J. Am. Chem. Soc. 134, 19544 (2012).
- Auer and Frenkel (2004a) S. Auer and D. Frenkel, Ann. Rev. Phys. Chem. 55, 333 (2004a).
- Auer and Frenkel (2001b) S. Auer and D. Frenkel, Nature 409, 1020 (2001b).
- Allen et al. (2005) R. J. Allen, P. B. Warren, and P. R. ten Wolde, Phys. Rev. Lett. 94, 018104 (2005).
- Bolhuis et al. (2002) P. G. Bolhuis, D. Chandler, C. Dellago, and P. L. Geissler, Ann. Rev. Phys. Chem. 53, 291 (2002).
- Volmer and Weber (1926) M. Volmer and A. Weber, Z. Phys. Chem. 119, 277 (1926).
- Becker and Doring (1935) R. Becker and W. Doring, Ann. Phys. 24, 719 (1935).
- Kelton (1991) K. F. Kelton, Crystal Nucleation in Liquids and Glasses, vol. 45 (Academic Press, Boston, 1991).
- Auer and Frenkel (2004b) S. Auer and D. Frenkel, J. Chem. Phys. 120, 3015 (2004b).
- Hess et al. (2008) B. Hess, C. Kutzner, D. van der Spoel, and E. Lindahl, J. Chem. Theory Comput. 4, 435 (2008).
- Vega et al. (2009) C. Vega, J. L. F. Abascal, M. M. Conde, and J. L. Aragones, Faraday Discuss. 141, 251 (2009).
- Pi et al. (2009) H. L. Pi, J. L. Aragones, C. Vega, E. G. Noya, J. L. F. Abascal, M. A. Gonzalez, and C. McBride, Molec. Phys. 107, 365 (2009).
- Gonzalez and Abascal (2010) M. A. Gonzalez and J. L. F. Abascal, J. Chem. Phys. 132, 096101 (2010).
- Essmann et al. (1995) U. Essmann, L. Perera, M. L. Berkowitz, T. Darden, H. Lee, and L. G. Pedersen, J. Chem. Phys. 103, 8577 (1995).
- Parrinello and Rahman (1981) M. Parrinello and A. Rahman, J. Appl. Phys. 52, 7182 (1981).
- Bussi et al. (2007) G. Bussi, D. Donadio, and M. Parrinello, J. Chem. Phys. 126, 014101 (2007).
- Lechner and Dellago (2008) W. Lechner and C. Dellago, J. Chem. Phys. 129, 114707 (2008).
- Reinhardt et al. (2012) A. Reinhardt, J. P. K. Doye, E. G. Noya, and C. Vega, J. Chem. Phys. 137, 194504 (2012).
- Ghiringhelli et al. (2008) L. M. Ghiringhelli, C. Valeriani, J. H. Los, E. J. Meijer, A. Fasolino, and D. Frenkel, Molec. Phys. 106, 2011 (2008).
- Li et al. (2009) T. Li, D. Donadio, L. M. Ghiringhelli, and G. Galli, Nature Mat. 8, 726 (2009).
- Bogdan (1997) A. Bogdan, The Journal of Chemical Physics 106, 1921 (1997).
- Vega and de Miguel (2007) C. Vega and E. de Miguel, J. Chem. Phys. 126, 154707 (2007).
- Sanz et al. (2004) E. Sanz, C. Vega, J. L. F. Abascal, and L. G. MacDowell, Phys. Rev. Lett. 92, 255701 (2004).
- Koop et al. (2000) T. Koop, B. Luo, A. Tslas, and T. Peter, Nature 406, 611 (2000).
- Noya et al. (2007) E. G. Noya, C. Menduina, J. L. Aragones, and C. Vega, J. Phys. Chem. C 111, 15877 (2007).
- Kumar et al. (2007) P. Kumar, S. V. Buldyrev, S. R. Becker, P. H. Poole, F. W. Starr, and H. E. Stanley, Proc. Nat. Acad. Sci. 104, 9575 (2007).
- Frenkel and Smit (1996) D. Frenkel and B. Smit, Understanding Molecular Simulation (Academic Press, London, 1996).
- Granasy et al. (2002) L. Granasy, T. Pusztai, and P. F. James, J. Chem. Phys. 117, 6157 (2002).
- Handel et al. (2008) R. Handel, R. L. Davidchack, J. Anwar, and A. Brukhno, Phys. Rev. Lett. 100, 036104 (2008).
- Horn et al. (2004) H. W. Horn, W. C. Swope, J. W. Pitera, J. D. Madura, T. J. Dick, G. L. Hura, and T. Head-Gordon, J. Chem. Phys. 120, 9665 (2004).
- Abascal and Vega (2010) J. L. F. Abascal and C. Vega, J. Chem. Phys. 133, 234502 (2010).
- Abascal and Vega (2011) J. L. F. Abascal and C. Vega, J. Chem. Phys. 134, 186101 (2011).
- Wikfeldt et al. (2011) K. T. Wikfeldt, C. Huang, A. Nilsson, and L. G. M. Pettersson, J. Chem. Phys. 134, 214506 (2011).
- Filion et al. (2010) L. Filion, M. Hermes, R. Ni, and M. Dijkstra, J. Chem. Phys. 133, 244115 (2010).
- Lundrigan and Saika-Voivod (2009) S. E. M. Lundrigan and I. Saika-Voivod, J. Chem. Phys. 131, 104503 (2009).
- Shevchuk and Rao (2012) R. Shevchuk and F. Rao, J. Chem. Phys. 137, 036101 (2012).
- Overduin and Patey (2013) S. D. Overduin and G. N. Patey, J. Chem. Phys. 138, 184502 (2013).
- Limmer and Chandler (2013) D. T. Limmer and D. Chandler, J. Chem. Phys. 138, 214504 (2013).
- Poole et al. (2013) P. H. Poole, R. K. Bowles, I. Saika-Voivod, and F. Sciortino, J. Chem. Phys. 138, 034505 (2013).
- Liu et al. (2012) Y. Liu, J. C. Palmer, A. Z. Panagiotopoulos, and P. G. Debenedetti, J. Chem. Phys. 137, 214505 (2012).
- Pruppacher and Klett (1997) R. Pruppacher and J. D. Klett, Microphysics of Clouds and Precipitation (Kluwer Academic Publishers, 1997).
- Speedy and Angell (1976) R. J. Speedy and C. A. Angell, J. Chem. Phys. 65, 851 (1976).
- Hare and Sorensen (1987) D. E. Hare and C. M. Sorensen, J. Chem. Phys. 87, 4840 (1987).
- Holten et al. (2012) V. Holten, C. E. Bertrand, M. A. Anisimov, and J. V. Sengers, J. Chem. Phys. 136, 094507 (2012).
- Molinero and Moore (2009) V. Molinero and E. B. Moore, J. Phys. Chem. B 113, 4008 (2009).
- Vega et al. (2006) C. Vega, M. Martin-Conde, and A. Patrykiejew, Mol. Phys. 104, 3583 (2006).
- Conde et al. (2008) M. M. Conde, C. Vega, and A. Patrykiejew, J. Chem. Phys. 129, 014702 (2008).
- Bartell and Huang (1994) L. S. Bartell and J. F. Huang, J. Phys. Chem. 98, 7455 (1994).
- Huang and Bartell (1995) J. F. Huang and L. S. Bartell, J. Phys. Chem. 99, 3924 (1995).
- Mahoney and Jorgensen (2000) M. W. Mahoney and W. L. Jorgensen, J. Chem. Phys. 112, 8910 (2000).
- Razul and Kusalik (2011) M. S. G. Razul and P. G. Kusalik, J. Chem. Phys. 134, 014710 (2011).