On the Evolution of the Cosmic Ionizing Background.
Abstract
We study the observed cosmic ionizing background as a constraint on the nature of the sources responsible for the reionization of the Universe. In earlier work, we showed that extrapolations of the Ultra-Violet Luminosity Function (LF) of Lyman Break Galaxies (LBGs) at fixed Lyman continuum photon escape fraction () are not able to reproduce the redshift evolution of this background. Here, we employ extrapolations of the high-z LFs to describe the contribution of LBGs to the ionizing photon rate, taking into account the smoothing of the baryonic perturbations, due to the background itself (i.e. the filtering mass), as well as a possible sharp increase of in dwarf galaxies. Under the hypothesis of a dominant contribution of LBGs to cosmic reionization, our results suggest that sources fainter than the current observational limits should be characterised by values of the order of (larger than the current estimates for bright galaxies) to account for a reionization and the measured evolution of cosmic ionizing background, at the same time. The contribution to the background from quasars turns out to be relevant at . Overall, our results support the case for dedicated observations of faint galaxies in the rest-frame UV, in order to better determine their physical properties. Observed values outside our proposed range bear relevant consequences on the nature of the astrophysical sources responsible for cosmic reionization and/or its buildup process.
keywords:
galaxies: evolution - cosmology: observations - Early Universe1 Introduction
The epoch of cosmic reionization is a crucial signpost to understand the formation of the first cosmic structures, the thermal history of the inter-galactic medium (IGM) and the interaction between energetic photons and the different gas phases (which are responsible for the onset of processes like gas cooling and star formation). A number of astrophysical evidences, ranging from the analysis of the cosmic microwave background (Komatsu et al., 2011; Planck Collaboration et al., 2013), to the Gunn-Peterson test applied to the Lyman forest (McGreer et al., 2011), to the fraction of Lyman emitters among Lyman Break Galaxies (LBGs, Pentericci et al. 2011) broadly constrain the epoch of Hydrogen reionization at (with a peak probability at if instantaneous reionization is assumed).
On the other hand, the nature of the astrophysical sources responsible for the reionization is still a matter of considerable debate. Star forming galaxies and active galactic nuclei (AGNs) have been usually suggested as the main contributors to reionization and their role has been the subject of extensive research (Haiman & Loeb, 1998; Schirber & Bullock, 2003; Robertson et al., 2010; Bouwens et al., 2012). Nonetheless, the global details of the process are still elusive and one of the major puzzles is the evidence that given the properties of observed galaxies and AGNs none of the known astrophysical populations is able of account alone for the whole ionizing photon budget required to complete reionization at , thus not excluding a relevant contribution of more exotic sources (Scott et al., 1991; Madau et al., 2004; Pierpaoli, 2004; Dopita et al., 2011). We recently reviewed the combined contribution of both galaxies and AGNs to reionization (Fontanot et al., 2012, hereafter FCV12): we showed that AGNs alone cannot be responsible for cosmic reionization, but they can indeed provide a relevant, although sub-dominant contribution to the photon budget, thus alleviating the constraints for the LBG contribution. In fact, we also showed that the required ionizing photon density can be produced by the LBG population, only if their escape fractions (, i.e. the fraction of ionizing photons, which are able to escape the local environment and ionize the IGM) is of the order of 0.2 and/or a substantial contribution is due to faint galaxies mostly beyond the reach of present technology (see also Bouwens et al., 2012; Kuhlen & Faucher-Giguère, 2012; Alvarez et al., 2012; Robertson et al., 2013).
In particular, is a key parameter for the determination of the relative contribution of different galaxy populations to reionization, but it is very poorly constrained by direct observations. Due to their hard spectra, AGNs are supposed to have large escape fractions, possibly reaching unity in the most luminous QSOs (). However, it is not well established yet if such a conclusion holds also for fainter sources (i.e. AGNs), given that the fraction of obscured (Type-II) sources increases with magnitude (see e.g., Simpson, 2005). On the other hand, galaxies are characterised by softer spectra blue-ward of Ly and their is expected to be lower than for AGNs, given the presence of cold gas and dust, which absorb most of the Lyman continuum emission (see e.g., Haehnelt et al., 2001). Direct detection of Lyman continuum photons at has been elusive so far ( Leitherer et al., 1995; Cowie et al., 2009), while estimates at cover a wide range of results, from low (, Vanzella et al. 2010), to relatively high values (, Iwata et al. 2009; Nestor et al. 2013, but see Vanzella et al. 2012). From the theoretical side, numerical simulations provide contrasting suggestions, reporting opposite (i.e. negative and positive) dependencies on the environment and a relevant object-to-object scatter (Gnedin et al., 2008; Yajima et al., 2011).
A strong constraint on the evolution of ionizing sources comes from the measure of the intensity of the ionizing background: the observed photoionization rate per unit comoving volume is only a few times larger than the required minimum value for the reionization of the Universe (Madau et al., 1999; Pawlik et al., 2009), thus narrowing the allowed parameter space for and the limiting magnitude at 145 of the luminosity function () of the contributing sources. In FCV12 we showed that the observed redshift evolution of the astrophysical sources translates into an evolution of the predicted photoionization rates contrasting with the observational data, thus exacerbating the difficulties in reproducing the background and achieving reionization at . In particular, at fixed the background constraint implies strong limits for and vice-versa, thus favouring models which assume a redshift (and/or luminosity) evolution for , or both.
Indeed, several authors (see e.g., Ciardi et al., 2012) proposed a variable as a function of redshift and/or luminosity as a viable solution to avoid a relevant contribution to reionization from faint sources (which also implies an extended reionization epoch, Kuhlen & Faucher-Giguère 2012). A more extreme scenario requires reionization to be dominated at by ultra-faint galaxies: these sources should be characterised by higher values (close to unity) and live in host dark matter (DM) haloes. This implies that these sources would not have formed at in ionized regions (therefore not contributing to the background), due to suppression by heating from the UV background (see e.g. Babul & Rees, 1992; Gnedin, 2000; Barkana & Loeb, 2002; Somerville, 2002; Ciardi & Ferrara, 2005; Okamoto et al., 2008). Such an important hypothesis is clearly difficult to test observationally due to the increasing complexity of a direct measurement of for faint objects at high redshift (Vanzella et al., 2012). In this paper, we employ toy models, based on the observed evolution of AGN and LBG LFs, in order to build a plausible scenario for the reionization and the production and evolution of the UV background, as well as to tailor observational tests to be performed on the faintest galaxies accessible.
This paper is organised as follows. In Section 2, we present the formalism to estimate the ionizing background from observed LFs. This will be used in Section 3 to provide constraints on the expected value for faint sources and we discuss our conclusions in Section 4. Throughout this paper we assume that quasi-stellar objects (QSOs) represent the luminous sub-population of the homogeneous AGN population, and that LBGs are a good tracer of the overall galactic population.
2 Synthesis of the Ionizing Background
We consider two different estimates of the ionizing background, in order to constrain the expected physical properties of the sources responsible for cosmic reionization. We thus compare the observationally determined photoionization rates as a function of redshift, with the prediction of theoretical models for the synthesis of the background, based on the redshift evolution of the luminosity functions (LFs) of different astrophysical sources (i.e. LBGs and AGNs). It is worth stressing that the two estimates of the background are completely independent. On the one hand, the direct determinations of the photoionization rates are based on the observed Ly-forest effective opacity (Bolton & Haehnelt, 2007; Becker et al., 2007; Faucher-Giguère et al., 2008; Wyithe & Bolton, 2011; Becker & Bolton, 2013) and on the QSO proximity effect (Giallongo et al., 1996; D’Odorico et al., 2008; Calverley et al., 2011). In most cases, the hydrogen photoionization rates are derived from the mean opacity of the IGM to Ly photons (quantified in terms of an effective optical depth), via a determination of the temperature of the IGM. The large scatter between the different determinations of the ionizing background is mainly due to the different assumptions for the IGM temperature, Ly and ionizing opacities among the different authors (see e.g., Becker & Bolton, 2013, and discussion herein): it is then indicative of our limited knowledge of the properties of the IGM at different redshifts. On the other hand, our theoretical determination of the expected ionizing background does not require any assumption on the detailed properties of the IGM (like its temperature and density), but it is mainly based on our understanding of galaxy evolution; therefore its main uncertainties are tightly linked to our limited knowledge of the statistical properties of the galaxy populations and how UV photons are able to escape from them (, and the faint-end slope of the LF). In the following, we will take advantage of these independent estimates to explore the theoretical parameter space and put the tightest possible constraints on .
2.1 AGN/LBG contribution to the ionizing background
As in FCV12, we estimate the expected contribution of different galaxy populations to the ionizing background, by considering a reference set of LFs at different redshifts. In particular, we focus on the determination of the bolometric AGN-LF from Hopkins et al. (2007), on the X-ray selected AGN-LF by Fiore et al. (2012), on the and UV-LFs of LBGs by Reddy & Steidel (2009) and Bouwens et al. (2011), respectively. As in FCV12 we first compute the monochromatic luminosity density from a given luminosity function, and we use it to estimate both the LBG rate of emitted ionizing photons per unit comoving volume as a function of redshift,
| (1) |
and the corresponding AGN rate,
| (2) |
In equation (1), we define the conversion factor111In equation 1, we implicitly assume, as in FCV12, a first conversion from to the star formation rate density , which is then used to estimate . The conversion factors and critically depend (up to roughly ) on the assumptions on the properties of the underlying stellar population, like its Initial Mass Function, metallicity and dust content. An alternative approach has been proposed by, e.g., Kuhlen & Faucher-Giguère (2012), which is based on an assumption of the typical galaxy spectral energy distribution and a single conversion from to the photon ionizing luminosity. Here we note that the combination is in good agreement with both the fiducial parameter used in Kuhlen & Faucher-Giguère (2012) and the range of values for different choice of stellar population parameters discussed in Robertson et al. (2013, their Fig. 1). (Salpeter IMF) from UV luminosity density to the star formation rate density and is the number of LyC photons produced per unit star formation rate (see e.g., Shull et al. 2012). In equation 2, is the frequency at Å, and (assuming a cutoff at 4 Ryd, since more energetic photons are mainly absorbed on He II, Madau et al. 1999). The absorbing cross section for neutral hydrogen is assumed to be unity between and , and zero outside this range. In practice, we consider in the calculations a QSO spectral continuum of the form blue-ward of the Ly line, as suggested by Telfer et al. (2002), where represents the monochromatic flux at the frequency . In both equations and represent the escape fraction for the LBG and AGN population, respectively. It is worth stressing that most observational works prefer to use a relative escape fraction, i.e. the fraction of escaping LyC photons, relative to the fraction of escaping non-ionizing ultraviolet photons. Since in this quantity dust attenuation is already taken into account, it is commonly used to convert the observed luminosity density at Å into Lyman continuum emission. For the sake of simplicity, in the following we will neglect any dust correction in our computations, thus making the two definitions equivalent in our context.
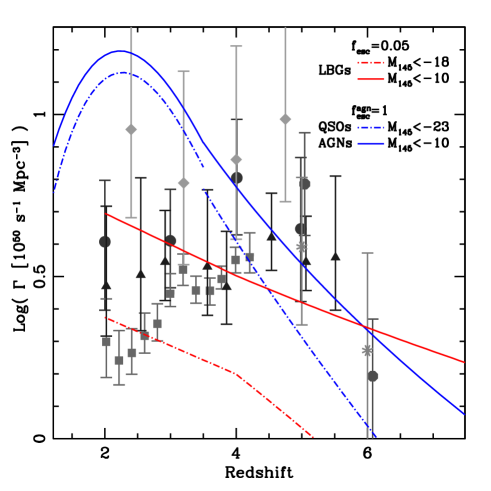
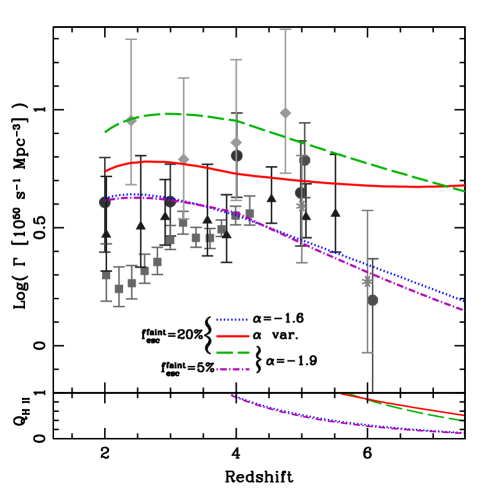
In Fig. 1 we compare our empirical predictions with a collection of observational constraints (grey dots) obtained by converting photoionization rates, into ionizing photons per unit comoving volume, following the same procedure and assumptions as in Kuhlen & Faucher-Giguère (2012). The blue lines correspond to the predicted , assuming . Solid and dashed lines correspond to different lower limits in the integration of the luminosity function ( and respectively, the usual discriminator between AGNs and QSOs). Red lines222We smooth the redshift evolution of the binned LBG-LFs at by requiring a linear evolution of the break magnitude () and normalization () of the LF between the value as in Reddy & Steidel (2009) and the value as in Bouwens et al. (2011), at fixed faint-end slope (). At we use the evolutionary model of Bouwens et al. (2011). show the corresponding predictions for , assuming . Also in this case, solid and dashed lines correspond to different lower limits in the integration of the luminosity function ( and , respectively). In both cases, we extrapolate the observed LFs beyond their magnitude limits, assuming that their faint-end slope estimates are a good proxy for the statistical properties of fainter galaxies. We discuss uncertainties associated with this extrapolation later in this work.
As already suggested in FCV12 the redshift evolution of the contribution of ionizing radiation coming from both the galaxy and AGN populations evolves differently in comparison to the observed evolution of the background (at fixed ). The observed background shows almost no evolution (or at most a mild increase) with redshift in the range , while simple models predict a strong decrease of all background contributions with redshift: there is no straightforward way to reconcile, at fixed , the predicted redshift evolution of the ionizing background with the data by changing the values of the main parameters in equation (2) and (1). In particular, we notice that the high values required for a significant contribution of AGNs to the ionizing background at correspond to a large AGN contribution to the background at , where QSOs are expected to dominate the emission of ionizing photons. These large ionizing rates are in agreement with recent estimates by Becker & Bolton (2013), but systematically exceed earlier results (i.e. observations by Bolton & Haehnelt 2007 and Faucher-Giguère et al. 2008); even if most of the data are still compatible with the model at a level.
2.2 Suppression Galaxy Formation through IGM heating
A possible solution to the tension shown in Fig. 1 lies in postulating an evolution of with redshift and/or luminosity. However, the theoretical scenario is uncertain: star formation, feedback, metallicity and dust content, the geometry and distribution of the ISM are all important ingredients that have to be taken into account; moreover, an explicit treatment of radiative transfer is required to follow the ionization history in detail. Contrasting results have been presented in the literature, suggesting that can either increase (Razoumov & Sommer-Larsen, 2006; Ferrara & Loeb, 2013) or decrease (Wood & Loeb, 2000) with redshift; or that it decreases with increasing (Ricotti & Shull, 2000; Yajima et al., 2011) or decreasing (Gnedin et al., 2008; Ferrara & Loeb, 2013) halo mass. In general, in order to achieve reionization with LBGs, it is necessary to postulate that increases for dwarf galaxies and/or in smaller haloes, with respect to brighter and more massive systems. In the following we test a possible alternative scenario that is able to reconcile the present constraints from the LFs with the observational determination of the ionizing background. It is based on a redshift dependent integration limit for the LBGs UV-LF.
In fact, the presence of a background UV flux provides photoheating to the gas, which has strong effects on galaxy formation in small dark matter (DM) haloes. This delays cooling and reduces the efficiency of galaxy formation in these environments since pressure support prevents gas in halos with a circular velocity lower than the sound speed of ionized gas from collapsing: baryonic fluctuations on small scales thus grow at a slower rate than the corresponding DM fluctuations. It is possible to describe this mechanism in linear theory by introducing a characteristic “filtering” scale (Gnedin & Hui, 1998) for the smoothing of baryonic fluctuations, which is related to the linear growth function , the scale factor , the Hubble function by the following equation:
| (3) |
where represents the Jeans wave number defined as:
| (4) |
where denotes the temperature at the mean total mass density of the Universe , is the Boltzmann constant, the mean molecular weight, the proton mass and the denominator corresponds to the linear sound speed. It is thus straightforward to define the filtering mass () as the mass enclosed in a sphere with comoving radius and it corresponds to the mass of the halo which would lose half of the baryons, compared to the universal baryon fraction (Gnedin, 2000). The filtering mass is thus a convenient indicator of the mass scale at which galaxy formation becomes inefficient: therefore we assume that it should correspond to the typical DM halo mass that hosts the fainter galaxies whose statistical properties are still consistent with the observed UV-LFs. We thus assume that for smaller DM haloes galaxy formation becomes so inefficient that those haloes do not contribute to the ionizing background.
The definition of depends on the details of the assumed thermal history and in the following we will discuss results relative to three different choices, covering a reasonable range of possibilities. Recently, there has been another non-gravitational heating mechanism suggested in addition to photoheating. TeV photons emitted by luminous hard blazars pair produce and annihilate on the extragalactic background light, which is emitted by galaxies and QSOs. Powerful plasma instabilities appear to be able to dissipate the kinetic energy of the electron-positron pairs at a rate that is faster than the inverse Compton cooling rate (Broderick et al., 2012; Schlickeiser et al., 2012, 2013). This leads to a temperature-density relation that is partially inverted toward the low-density voids (Chang et al., 2012), which is in agreement with all statistics on the Lyman-alpha forest (Puchwein et al., 2012). Additionally, this implies a dramatic increase in the entropy of the IGM following He ii reionization at and increases the filtering mass (Pfrommer et al., 2012). Following Pfrommer et al. (2012), we consider a pure photoheating (green lines in Fig. 2 and 4) and a “standard” blazar heating (blue lines) model with sudden reionization for H i (at ) and He ii (at ). Thermal and entropy histories for these models have been extensively discussed in Pfrommer et al. (2012, see their Figure 1). Finally we consider a model with constant () temperature (red lines).
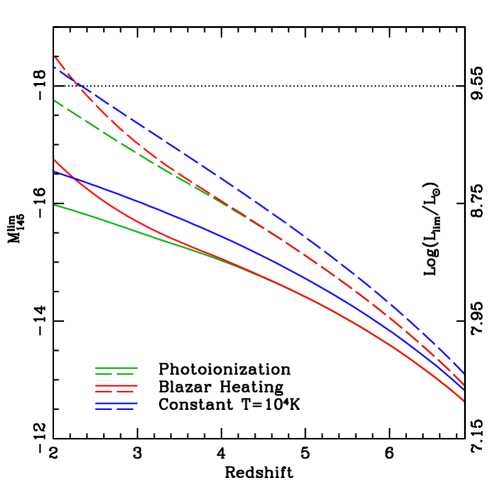
The filtering mass obtained through equation (3) is an estimate of the relevant mass scale in linear perturbation theory. However, the exact mass scale below which galaxy formation becomes inefficient depends also on the details of non-linear structure formation, which can be followed accurately by means of cosmological -body simulations (see e.g Hoeft et al., 2006; Okamoto et al., 2008). These results predict a characteristic mass (), defined as the halo mass at which haloes have lost (on average) half of their baryons, roughly one order of magnitude smaller than the filtering mass estimate at . It is worth stressing that, according to the previous definition, does not correspond to the mass scale at which the production of ionizing photons ceases (as in the filtering mass approach). In the following we will assume that marks the mass scale at which the faint-end of the LBG-LF drops and the contribution of fainter galaxies to reionization becomes negligible; we thus assume an effect similar to . In order to capture the (redshift dependent) relation between and , we follow Macciò et al. (2010) and we introduce a correction factor that was calibrated to results by Okamoto et al. (2008, from their Fig. B1):
| (5) |
We then consider the problem of estimating the UV luminosity of the typical galaxy hosted in a halo of mass or . To this aim we use the improved conditional luminosity function proposed by Trenti et al. (2010), which we describe as:
| (6) |
The resulting limiting magnitudes corresponding to our different choices of filtering/characteristic mass are shown in Fig. 2. It is important to keep in mind that this improved conditional luminosity function is defined for and we are extrapolating it to lower redshifts. Moving from the filtering to the characteristic mass definition implies a magnitude difference of , while the difference between the difference thermal histories are smaller. In particular, blazar heating differs from photoionization heating only for and accounting for almost a magnitude difference at . These results show that the different definitions of the limiting DM halo masses are more relevant for the estimate of , than the details in the assumed thermal history.
3 Results & Discussion
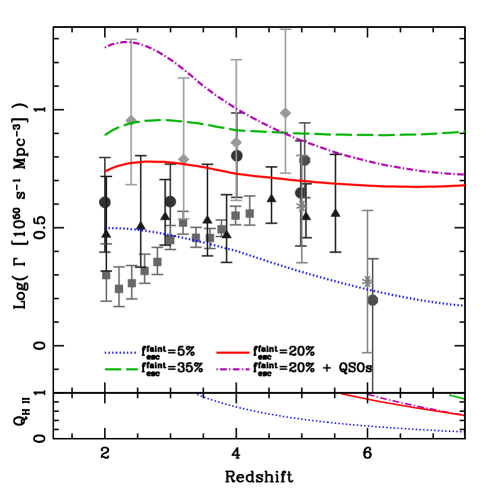
For each definition and redshift evolution of the filtering/characteristic mass, we compute the ionizing background, by integrating the UV-LF up to the corresponding . Since the resulting at is brighter than , it is not possible to achieve reionization at and reproduce the ionizing background with a constant over the whole magnitude range (see discussion in FCV12). We thus explore the effect of an increase of for the fainter galaxies. For the purpose of the present work, we assume a sharp increase in () for all galaxies with (the present limit of faint LBG searches according to Bouwens et al. 2011), while keeping for brighter galaxies:
| (7) |
We want to study whether this hypothesis is able to reconcile the shape of the evolution of the ionizing background with reionization at and infer the expected range of values in LBGs. We propose to test such a prediction with dedicated observations (to be performed with present and future facilities). In the following, we define a reference model (i.e. a thermal history which accounts for photo- and blazar heating for the case of the characteristic mass) and discuss the dispersion of our predictions, against variations of the main parameters of our approach. In Fig. 3, we then show how our predictions scale with varying : we consider (the upper limit for estimates of bright galaxies), (a value often advocated to achieve cosmic reionization by LBGs only, see e.g Bouwens et al. 2012) and a higher (to explore the limits of our approach). As a reference, we compute the reionization epoch associated to our toy models by considering in the bottom panel the filling factor of reionized hydrogen () solving the following differential equation (as in Madau et al. 1999):
| (8) |
where is the mean comoving density of hydrogen atoms and the equation for has been computed following Kuhlen & Faucher-Giguère (2012):
| (9) |
assuming for each toy model the appropriate thermal history and the redshift dependent clumping factor derived in Haardt & Madau (2012):
| (10) |
This gives typical values of the order unity, which is in line with the other recent estimates of the clumping factor for gas with overdensities below 100 (see e.g., Pawlik et al., 2009; Shull et al., 2012). Using the above calculations it is also possible to estimate the Thomson scattering optical depth to cosmic microwave background, :
| (11) |
where represents the Thomson cross section and is the fraction of mass in Helium, which we assume to be singly ionized () at and doubly ionized () at lower redshift.
From our analysis, it is evident that both ingredients (i.e. a redshift-dependent and ) are necessary to recover the redshift evolution of the observed background together with reionization at (which we assume to happen in our toy models, when reaches unity in the bottom panel). Comparison with the data points clearly favour : the lower bound is well constrained by the reionization epoch, while the upper bound is relatively unconstrained, due to the systematic uncertainties in the observed ; agrees reasonably well with most of the points over a wide redshift range. These conclusions are confirmed by the predicted values for our toy models: they are quite low () for , and consistent333While a value of is statistically consistent with CMB Planck data at the 1- confidence level, we caution that the inferred values for may also be an underestimate owing to the simplified assumption of a symmetric reionization history. An extended epoch that is skewed toward early times, a delay in reionization, or an early incomplete reionization epoch at high may increase this value (Zahn et al., 2012; Park et al., 2013) to harmonize with the latest measurements of as deduced by a joined analysis of CMB data by Planck, high-multipole experiments, WMAP polarization and baryon-acoustic oscillations (Planck Collaboration et al., 2013). with the cosmological constraints for and ( and respectively).
For the sake of completeness, we also consider a model summing up the QSO contribution to the model (purple dot-dashed line, ): including this contribution to the ionizing photon budget induces a marked redshift evolution of the background444It is worth stressing that an evolution of the ionizing background can also be achieved by assuming a redshift dependent dust correction (see e.g Cucciati et al., 2012).. The total background is compatible with the Becker & Bolton (2013) data, but it overpredicts previous results at a 3 level, thus favouring lower values. Of course, different combinations of and lead to similar predictions of the redshift evolution of the ionizing background. Indeed, several theoretical works suggest an evolution of with AGN luminosity (see e.g., Giallongo et al., 2012, and references herein). As an example, if we consider our reference model for LBG contribution with and if we require the total background to be compatible with the lowest redshift point in Becker & Bolton (2013), we predict (assuming ) or (assuming ). This makes the case for a better estimate of , in order to get an even better constraint of . This may be achieved by detailed observation of sources.
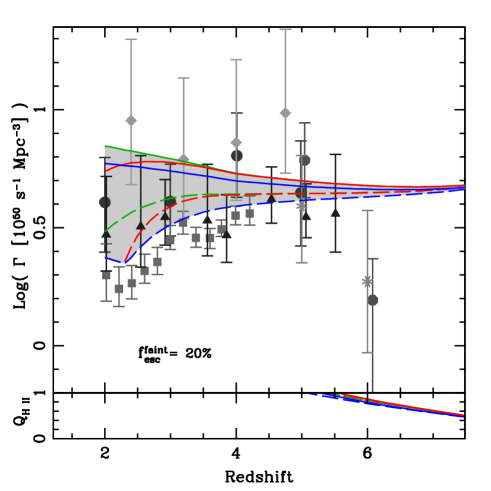
We then explore the parameter space associated with our theoretical model to check the robustness of our results. First of all, we test the dependency of our results on the details of equation (7): brightening the break magnitude to increases the predicted background by a few per cents (leaving our conclusions unchanged), while decreasing the fiducial value of for bright galaxies has the opposite effect. In Fig. 4, we then study the effect of the uncertainties on , by fixing and consider different choices for the IGM thermal histories: green, red and blue lines correspond to the predicted ionizing background for the pure photoheating, blazar heating and constant temperature cases, respectively, while solid (dashed) lines refer to characteristic (filtering) masses. We mark the allowed area between the different estimates of the filtering and the characteristic masses with grey shading. The predicted background is almost constant with redshift for models based on the characteristic mass, while it has a mild redshift evolution for models based on the filtering mass. Within the uncertainties all models agree with the lower observational estimates for the background. It is worth stressing that the filtering mass approach predicts that no galaxy fainter than our current accessible depth should exist at ; this result is in tension with recent findings of ultra-faint UV galaxies () at as magnified sources in the background of the lower-redshift () lensing galaxy cluster Abell 1689 (Alavi et al., 2013). On the other hand, at least for the characteristic mass scenario, the mere existence of galaxies fainter than the limits shown in Fig. 2 does not indicate a substantial discrepancy between theory and observations. In fact, we assume as an indication of the magnitude scale at which galaxy formation becomes ineffective, i.e. the magnitude at which we expect the UV-LF either to drop or to flatten, thus assuming a negligible contribution to the background from fainter sources. From their ultra-faint UV sample, Alavi et al. (2013) conclude that the UV-LF is consistent with a Schechter function until , but we caution the reader that, at the faintest magnitudes, this result is based on a limited sample with fairly relevant completeness corrections. Our predictions thus make the search for faint galaxies in this redshift interval, and the characterisation of their properties, a relevant goal for future surveys.
We then discuss the effect of the uncertainties on the faint-end slope . In our standard prescription (red solid line - ), we assume a redshift evolution for at , following the results of Bouwens et al. (2011); in Fig. 5 we explore the effect of considering a redshift independent . We consider two extreme values for ( and ), which corresponds to the range of allowed values at (see e.g., Fig. 2 in Bouwens et al., 2011). Our results clearly show that the flat redshift evolution of the background is mainly due to the assumed redshift evolution of in the reference model, while models with fixed slope predict an increasing with decreasing redshift. The slope of this relation is shallower with respect to the analogous relation in Fig. 1 (red lines - where we use a fixed and a variable ). The dispersion of the models is of the same amplitude as in Fig. 3. To test that our main conclusion still holds, we add in Fig. 5 a model (purple dot-dashed line) with and : this realization clearly shows that even in the most favourable case (steeper faint-end slope), a model with as low as the current estimates at the bright-end, fails to achieve cosmic reionization at .
4 Conclusions
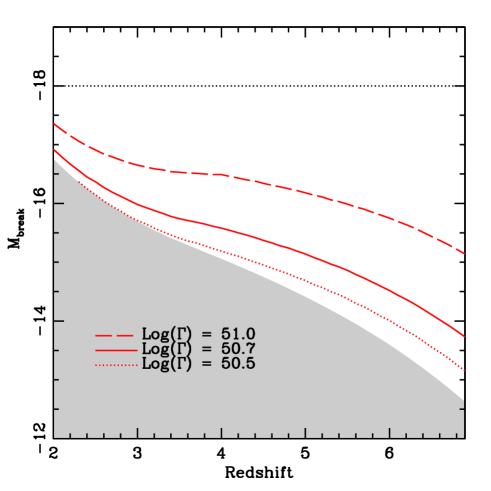
In this paper, we study the nature of the sources responsible for cosmic reionization by using the observed cosmic ionizing background as a constraint. Our approach, under the hypothesis that cosmic reionization is mainly driven by star forming galaxies, makes the case for an increase of in fainter sources. Overall, we thus propose that a reliable measure of for galaxies fainter than the present observational limits () will provide valuable insight into the galaxy population responsible for cosmic reionization. Low values () would imply either that star forming galaxies are not the main contributors for cosmic reionization (thus leaving room for more exotic explanations), or that the bulk of the contribution comes from even fainter galaxies (with even higher ). Extrapolating our approach, it is then possible to give a rough estimate of the critical luminosity, beyond which low values of would imply that star forming galaxies are not the main contributors to the background. We define it as the value required to reproduce a given background level with . We show the predicted for three different background levels and our reference model in Fig. 6. On the other hand, high values of () would favour the highest observational estimates of , i.e. lower IGM temperatures, thus providing additional insight into the IGM properties at the relevant redshifts (conversely, a better agreement on the observational determinations of will allow tighter constraints on the ). Even higher values (), on the other hand, lead to an overpredictions of the ionizing background at higher redshift, thus implying a large object-to-object scatter in . Our predictions can be tested directly in the context of present and future facilities (e.g., Hubble Space Telescope/Wide Field Camera 3, James Webb Space Telescope, Extremely Large Telescope) or through indirect techniques (see e.g., Robertson et al., 2010; Vanzella et al., 2012) and show the importance of a clean determination of for the fainter galaxies accessible, in order to get a better insight into the nature of the sources responsible for cosmic reionization.
Acknowledgements
We thank the anonymous referee for comments that helped to improve the paper. We also thank Volker Springel and Michele Trenti for enlightening discussions and suggestions. FF and CP acknowledge financial support from the Klaus Tschira Foundation. FF acknowledges financial support from the Deutsche Forschungsgemeinschaft through Transregio 33, “The Dark Universe”. FF, SC and EV acknowledge financial contribution from the grant PRIN MIUR 2009 “The Intergalactic Medium as a probe of the growth of cosmic structures”.
References
- Alavi et al. (2013) Alavi A., Siana B., Richard J., Stark D. P., Scarlata C., Teplitz H. I., Freeman W. R., Dominguez A., Rafelski M., Robertson B., Kewley L., 2013, ArXiv e-prints (arXiv:1305.2413)
- Alvarez et al. (2012) Alvarez M. A., Finlator K., Trenti M., 2012, ApJ, 759, L38
- Babul & Rees (1992) Babul A., Rees M. J., 1992, MNRAS, 255, 346
- Barkana & Loeb (2002) Barkana R., Loeb A., 2002, ApJ, 578, 1
- Becker & Bolton (2013) Becker G. D., Bolton J. S., 2013, ArXiv e-prints (arXiv:1307.2259)
- Becker et al. (2007) Becker G. D., Rauch M., Sargent W. L. W., 2007, ApJ, 662, 72
- Bolton & Haehnelt (2007) Bolton J. S., Haehnelt M. G., 2007, MNRAS, 382, 325
- Bouwens et al. (2011) Bouwens R. J., Illingworth G. D., Oesch P. A., Labbé I., Trenti M., van Dokkum P., Franx M., Stiavelli M., Carollo C. M., Magee D., Gonzalez V., 2011, ApJ, 737, 90
- Bouwens et al. (2012) Bouwens R. J., Illingworth G. D., Oesch P. A., Trenti M., Labbé I., Franx M., Stiavelli M., Carollo C. M., van Dokkum P., Magee D., 2012, ApJ, 752, L5
- Broderick et al. (2012) Broderick A. E., Chang P., Pfrommer C., 2012, ApJ, 752, 22
- Calverley et al. (2011) Calverley A. P., Becker G. D., Haehnelt M. G., Bolton J. S., 2011, MNRAS, 412, 2543
- Chang et al. (2012) Chang P., Broderick A. E., Pfrommer C., 2012, ApJ, 752, 23
- Ciardi et al. (2012) Ciardi B., Bolton J. S., Maselli A., Graziani L., 2012, MNRAS, 423, 558
- Ciardi & Ferrara (2005) Ciardi B., Ferrara A., 2005, Space Sci. Rev., 116, 625
- Cowie et al. (2009) Cowie L. L., Barger A. J., Trouille L., 2009, ApJ, 692, 1476
- Cucciati et al. (2012) Cucciati O., Tresse L., Ilbert O., Le Fèvre O., Garilli B., Le Brun V., Cassata P., Franzetti P., et al. 2012, A&A, 539, A31
- D’Odorico et al. (2008) D’Odorico V., Bruscoli M., Saitta F., Fontanot F., Viel M., Cristiani S., Monaco P., 2008, MNRAS, 389, 1727
- Dopita et al. (2011) Dopita M. A., Krauss L. M., Sutherland R. S., Kobayashi C., Lineweaver C. H., 2011, Ap&SS, 335, 345
- Faucher-Giguère et al. (2008) Faucher-Giguère C.-A., Lidz A., Hernquist L., Zaldarriaga M., 2008, ApJ, 682, L9
- Ferrara & Loeb (2013) Ferrara A., Loeb A., 2013, MNRAS, 431, 2826
- Fiore et al. (2012) Fiore F., Puccetti S., Grazian A., Menci N., Shankar F., Santini P., Piconcelli E., Koekemoer A. M., Fontana A., Boutsia K., Castellano M., Lamastra A., Malacaria C., Feruglio C., Mathur S., Miller N., Pannella M., 2012, A&A, 537, A16
- Fontanot et al. (2012) Fontanot F., Cristiani S., Vanzella E., 2012, MNRAS, 425, 1413
- Giallongo et al. (1996) Giallongo E., Cristiani S., D’Odorico S., Fontana A., Savaglio S., 1996, ApJ, 466, 46
- Giallongo et al. (2012) Giallongo E., Menci N., Fiore F., Castellano M., Fontana A., Grazian A., Pentericci L., 2012, ApJ, 755, 124
- Gnedin (2000) Gnedin N. Y., 2000, ApJ, 542, 535
- Gnedin & Hui (1998) Gnedin N. Y., Hui L., 1998, MNRAS, 296, 44
- Gnedin et al. (2008) Gnedin N. Y., Kravtsov A. V., Chen H.-W., 2008, ApJ, 672, 765
- Haardt & Madau (2012) Haardt F., Madau P., 2012, ApJ, 746, 125
- Haehnelt et al. (2001) Haehnelt M. G., Madau P., Kudritzki R., Haardt F., 2001, ApJ, 549, L151
- Haiman & Loeb (1998) Haiman Z., Loeb A., 1998, ApJ, 503, 505
- Hoeft et al. (2006) Hoeft M., Yepes G., Gottlöber S., Springel V., 2006, MNRAS, 371, 401
- Hopkins et al. (2007) Hopkins P. F., Richards G. T., Hernquist L., 2007, ApJ, 654, 731
- Iwata et al. (2009) Iwata I., Inoue A. K., Matsuda Y., Furusawa H., Hayashino T., Kousai K., Akiyama M., Yamada T., Burgarella D., Deharveng J.-M., 2009, ApJ, 692, 1287
- Komatsu et al. (2011) Komatsu E., Smith K. M., Dunkley J., Bennett C. L., Gold B., et al., 2011, ApJS, 192, 18
- Kuhlen & Faucher-Giguère (2012) Kuhlen M., Faucher-Giguère C.-A., 2012, MNRAS, 423, 862
- Leitherer et al. (1995) Leitherer C., Ferguson H. C., Heckman T. M., Lowenthal J. D., 1995, ApJ, 454, L19
- Macciò et al. (2010) Macciò A. V., Kang X., Fontanot F., Somerville R. S., Koposov S., Monaco P., 2010, MNRAS, 402, 1995
- Madau et al. (1999) Madau P., Haardt F., Rees M. J., 1999, ApJ, 514, 648
- Madau et al. (2004) Madau P., Rees M. J., Volonteri M., Haardt F., Oh S. P., 2004, ApJ, 604, 484
- McGreer et al. (2011) McGreer I. D., Mesinger A., Fan X., 2011, MNRAS, 415, 3237
- Nestor et al. (2013) Nestor D. B., Shapley A. E., Kornei K. A., Steidel C. C., Siana B., 2013, ApJ, 765, 47
- Okamoto et al. (2008) Okamoto T., Gao L., Theuns T., 2008, MNRAS, 390, 920
- Park et al. (2013) Park H., Shapiro P. R., Komatsu E., Iliev I. T., Ahn K., Mellema G., 2013, ApJ, 769, 93
- Pawlik et al. (2009) Pawlik A. H., Schaye J., van Scherpenzeel E., 2009, MNRAS, 394, 1812
- Pentericci et al. (2011) Pentericci L., Fontana A., Vanzella E., Castellano M., Grazian A., Dijkstra M., Boutsia K., Cristiani S., Dickinson M., Giallongo E., Giavalisco M., Maiolino R., Moorwood A., Paris D., Santini P., 2011, ApJ, 743, 132
- Pfrommer et al. (2012) Pfrommer C., Chang P., Broderick A. E., 2012, ApJ, 752, 24
- Pierpaoli (2004) Pierpaoli E., 2004, Physical Review Letters, 92, 031301
- Planck Collaboration et al. (2013) Planck Collaboration Ade P. A. R., Aghanim N., Armitage-Caplan C., Arnaud M., Ashdown M., Atrio-Barandela F., Aumont J., Baccigalupi C., Banday A. J., et al. 2013, ArXiv e-prints (arXiv:1303.5076)
- Puchwein et al. (2012) Puchwein E., Pfrommer C., Springel V., Broderick A. E., Chang P., 2012, MNRAS, 423, 149
- Razoumov & Sommer-Larsen (2006) Razoumov A. O., Sommer-Larsen J., 2006, ApJ, 651, L89
- Reddy & Steidel (2009) Reddy N. A., Steidel C. C., 2009, ApJ, 692, 778
- Richards et al. (2005) Richards G. T., Croom S. M., Anderson S. F., Bland-Hawthorn J., Boyle B. J., De Propris R., Drinkwater M. J., Fan X., et al. 2005, MNRAS, 360, 839
- Ricotti & Shull (2000) Ricotti M., Shull J. M., 2000, ApJ, 542, 548
- Robertson et al. (2010) Robertson B. E., Ellis R. S., Dunlop J. S., McLure R. J., Stark D. P., 2010, Nature, 468, 49
- Robertson et al. (2013) Robertson B. E., Furlanetto S. R., Schneider E., Charlot S., Ellis R. S., Stark D. P., McLure R. J., Dunlop J. S., Koekemoer A., Schenker M. A., Ouchi M., Ono Y., Curtis-Lake E., Rogers A. B., Bowler R. A. A., Cirasuolo M., 2013, ApJ, 768, 71
- Schirber & Bullock (2003) Schirber M., Bullock J. S., 2003, ApJ, 584, 110
- Schlickeiser et al. (2012) Schlickeiser R., Ibscher D., Supsar M., 2012, ApJ, 758, 102
- Schlickeiser et al. (2013) Schlickeiser R., Krakau S., Supsar M., 2013, ArXiv e-prints (arXiv:1308.4594)
- Scott et al. (1991) Scott D., Rees M. J., Sciama D. W., 1991, A&A, 250, 295
- Shull et al. (2012) Shull J. M., Harness A., Trenti M., Smith B. D., 2012, ApJ, 747, 100
- Simpson (2005) Simpson C., 2005, MNRAS, 360, 565
- Somerville (2002) Somerville R. S., 2002, ApJ, 572, L23
- Telfer et al. (2002) Telfer R. C., Zheng W., Kriss G. A., Davidsen A. F., 2002, ApJ, 565, 773
- Trenti et al. (2010) Trenti M., Stiavelli M., Bouwens R. J., Oesch P., Shull J. M., Illingworth G. D., Bradley L. D., Carollo C. M., 2010, ApJ, 714, L202
- Vanzella et al. (2010) Vanzella E., Giavalisco M., Inoue A. K., Nonino M., Fontanot F., Cristiani S., Grazian A., Dickinson M., Stern D., Tozzi P., Giallongo E., Ferguson H., Spinrad H., Boutsia K., Fontana A., Rosati P., Pentericci L., 2010, ApJ, 725, 1011
- Vanzella et al. (2012) Vanzella E., Guo Y., Giavalisco M., Grazian A., Castellano M., Cristiani S., Dickinson M., Fontana A. e. a., 2012, ApJ, 751, 70
- Vanzella et al. (2012) Vanzella E., Nonino M., Cristiani S., Rosati P., Zitrin A., Bartelmann M., Grazian A., Broadhurst T., Meneghetti M., Grillo C., 2012, MNRAS, 424, L54
- Wood & Loeb (2000) Wood K., Loeb A., 2000, ApJ, 545, 86
- Wyithe & Bolton (2011) Wyithe J. S. B., Bolton J. S., 2011, MNRAS, 412, 1926
- Yajima et al. (2011) Yajima H., Choi J.-H., Nagamine K., 2011, MNRAS, 412, 411
- Zahn et al. (2012) Zahn O., Reichardt C. L., Shaw L., Lidz A., Aird K. A., Benson B. A., Bleem L. E., Carlstrom J. E., et al. 2012, ApJ, 756, 65
- Zahn et al. (2005) Zahn O., Zaldarriaga M., Hernquist L., McQuinn M., 2005, ApJ, 630, 657