Multi-wavelength emissions from the millisecond pulsar binary PSR J1023+0038 during an accretion active state
Abstract
Recent observations strongly suggest that the millisecond pulsar binary PSR J1023+0038 has developed an accretion disk since 2013 June. We present a multi-wavelength analysis of PSR J1023+0038, which reveals that 1) its gamma-rays suddenly brightened within a few days in June/July 2013 and has remained at a high gamma-ray state for several months; 2) both UV and X-ray fluxes have increased by roughly an order of magnitude, and 3) the spectral energy distribution has changed significantly after the gamma-ray sudden flux change. Time variabilities associated with UV and X-rays are on the order of 100-500 seconds and 50-100 seconds, respectively. Our model suggests that a newly formed accretion disk due to the sudden increase of the stellar wind could explain the changes of all these observed features. The increase of UV is emitted from the disk, and a new component in gamma-rays is produced by inverse Compton scattering between the new UV component and pulsar wind. The increase of X-rays results from the enhancement of injection pulsar wind energy into the intra-binary shock due to the increase of the stellar wind. We also predict that the radio pulses may be blocked by the evaporated winds from the disk and the pulsar is still powered by rotation.
Subject headings:
accretion, accretion disks—stars: close—pulsars: individual (PSR J1023+0038)1. Introduction
The formation and evolution of millisecond pulsars (MSPs) have been a subject of debate. It is widely believed that neutron stars in low-mass X-ray binaries (LMXBs) can be spun up to millisecond periods by gaining angular momentum from the accreting materials of the companion star (e.g. Alpar et al. 1982). When the accretion stops, the neutron stars become radio millisecond pulsars powered by rotation (e.g. Campana et al. 1998). The first direct observational evidence to support the link between MSPs and LMXBs comes from the discovery of the X-ray binary/millisecond pulsar PSR J1023+0038 (J1023 hereafter). J1023 was first identified as an LMXB with an orbital period of 4.75 hours based on its X-ray and optical properties (Woudt et al. 2004; Thorstensen & Armstrong 2005; Homer et al. 2006) and the millisecond pulsation (ms) was found subsequently (Archibald et al. 2009). The source clearly showed an accretion disk between 2000 and 2001 (Wang et al. 2009) and the disk has since disappeared (Archibald et al. 2009) while radio pulsation was found in 2007 confirming the MSP nature (Archibald et al. 2009). Therefore, J1023 is considered as a newly born MSP, representing the missing link of a rotation-powered MSP descended from an LMXB. In such a system that recently transited from the LMXB phase to the radio MSP phase, it is widely believed that the accretion disk of J1023 will reform due to an increase in mass transfer rate, and the radio MSP will then be switched off (Archibald et al. 2009; Wang et al. 2009; Tam et al. 2010). One very recent example is IGR J18245–2452 in the globular cluster M28 for which it has been switching between an accretion and a rotation-powered MSP (Papitto et al. 2013).
Since 2013 late-June, the radio pulsation of J1023 has disappeared between 350 MHz and 5 GHz (Stappers et al. 2013; Patruno et al. 2014). Meanwhile, recent optical spectroscopy shows strong double peaked H emission indicating that an accretion disk is formed (Halpern et al. 2013). Moreover, the X-ray emission has increased by a factor of at least 20 comparing with previous quiescent values (Kong 2013) and the UV emission has brightened by 4 magnitudes (Patruno et al. 2014). All these strongly indicate that J1023 is switching from a radio MSP to a LMXB with an accretion disk. In addition, the gamma-ray emission ( MeV) as seen with Fermi has been reported to brighten by a factor of 5 (Stappers et al. 2013; Patruno et al. 2014). It is somewhat unusual as we expect that the gamma-rays should be turned off like radio during the accretion state (e.g., Takata et al. 2010,2012). In fact, no LMXB has been detected by Fermi so far.
In this paper, we report a multi-wavelength (from optical to gamma-ray) study of J1023 during its recent accretion active state (§ 2), and propose a model to explain the multi-wavelength behaviors (§ 3). A brief summary and discussion on observed variabilities in multi-wavelength emissions are given in § 4.
2. Summary of multi-wavelength observations
2.1. Fermi Large Area Telescope -ray observations
Gamma-ray data were obtained, reduced and analyzed using the Fermi Science Tools package (v9r32p5), available from the Fermi Science Support Center 111http://fermi.gsfc.nasa.gov/ssc/data/analysis/software/. We selected events in the reprocessed Pass 7 ’Source’ class and used the P7REP_SOURCE_V15 version of the instrumental response functions. To reduce contamination from the Earth’s albedo, we excluded time intervals when the ROI was observed at zenith angles greater than 100° or when the rocking angle of the LAT was greater than 52°. We used photons between 0.1 and 300 GeV within a ROI centered at the position of J1023. The Fermi Large Area Telescope (LAT) was under the sky survey mode for most of the time considered, allowing the full sky to be surveyed every three hours.
We performed binned likelihood analyzes with the gtlike tool. For source modeling, all 2FGL catalog sources (Nolan et al., 2012) within of the ROI center, the galactic diffuse emission (gll_iem_v05.fits), and isotropic diffuse emission (iso_source_v05.txt) were included. For sources more than 10° away from the position of J1023, the spectral parameters were fixed to the catalog values.
2.1.1 Spectral Analysis
We used Fermi LAT data collected in two separate time intervals: from August 14, 2008 to May 31, 2013 and from July 1, 2013 to November 12, 2013, roughly corresponding to the time before and after the -ray state change (see below for a temporal analysis), respectively. In each of the two time intervals, we performed two separate fits. We modeled J1023 with a simple power law
| (1) |
as well as a power law with exponential cutoff (PLE)
| (2) |
Before the state change, the fit with a simple power law gives and photons cm-2 s-1. The fit with a PLE gives , GeV and photons cm-2 s-1. These spectral parameters are consistent with those first reported in Tam et al. (2010). The likelihood ratio test gives likelihood, indicating that the improvement by the PLE model has a significance of just below 3, noting that the PLE model has one more degree of freedom. Using 1.5 years of data, Tam et al. (2010) found that the two models fit the data equally well, due to the lower photon statistics.
After the state change, the best-fit parameters for the simple power law are and photons cm-2 s-1. The best-fit parameters for the PLE model are , GeV and photons cm-2 s-1. The likelihood ratio test gives likelihood, indicating that the improvement by the PLE model has a significance of slightly below 3. There is approximately a factor of 10 increase in the photon flux after the state change, confirming an earlier report (Stappers et al. 2013).
Spectral points were obtained by fitting the normalization factors of point sources within 6° from the pulsar and the diffuse backgrounds in individual energy bins. Other parameters were fixed to the best-fit values obtained in the full energy band analysis. The 95% c.l. upper limits were calculated in energy bins where J1023 had a significance below 3.
2.1.2 Temporal analysis
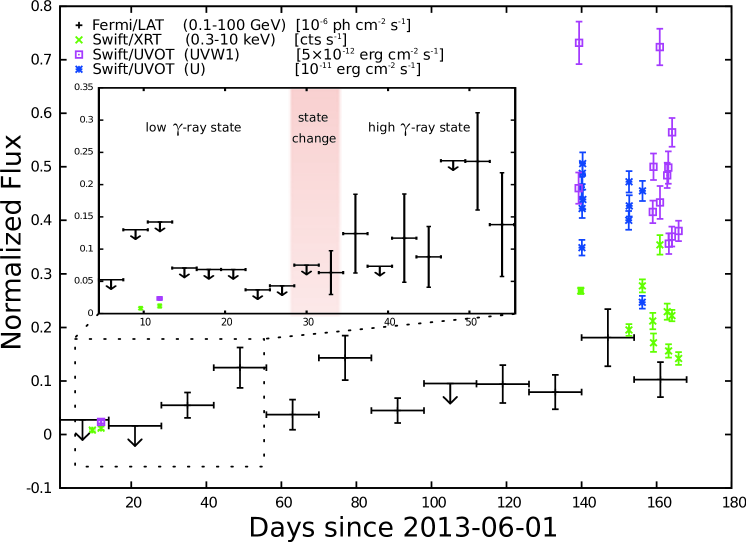
To show the change in -ray flux just before and after the state change, we constructed -ray light curves since June 2013, as shown in Fig. 1, with the one shown in the inset focusing on the time interval of the -ray state change seen in late June/early July. The same source model used in the aforementioned spectral analysis was used in deriving each flux value in the light curves, except that the power law model was assumed for J1023 due to the shorter time scales. The bin size is 14 days and 3 days for the main panel and inset, respectively. Upper limits were derived for those time intervals in which the TS values were below 9 (4) for the main panel (inset), assuming a power-law index of . It is clear that J1023 cannot be detected in two week’s time before July 2013; we designate such time interval as low -ray state. After the state change (a time interval we call high -ray state), the -ray flux has remained at a much higher level for most of the time.
We estimated the dates of the state-change, i.e., when the binary system changed from the low -ray state to the high -ray state, as follows. Likelihood analysis were performed for the time intervals spanning one week (7 days). The first time interval that we used starts at June 20 and ends June 26, then we shifted the analyzed time interval for one day, i.e., the next time interval is hence June 21–27, the third time interval is June 22–28, and so on. The last time interval is July 8–14.
In the beginning, TS values are below 10. The first bin having TS10 occurred at June 29–July 5. Note that never before (or, never since March 2013) could J1023 be detected at this significance with only one week of data, so during this particular week (June 29–July 5) J1023 has undergone a state change from the low state to high state in -rays. We indicate this time interval in Fig 1.
To look for orbital modulation, we mapped orbital phase to geocentric arrival time and divided the data into two halves in orbital phase, each centered at one of the conjunctions. We performed the same analysis as above in each phase interval and did not detect any significant orbital modulation.
2.2. XRT Observations
Since the disappearance of the radio pulsation of J1023, the pulsar has been monitored by Swift/XRT for the X-ray evolution. The X-ray properties observed in 2013 June 10 and 12 (Kong 2013) are roughly consistent with previous XMM-Newton observations taken in 2004 and 2008 (Archibald et al. 2010; Tam et al. 2010), indicating the system was still in quiescence. Since October 18, an enhanced X-ray emission was detected from a 10 ks XRT observation (Kong 2013; Patruno et al. 2014) reflecting a rapid X-ray activity in the binary system. Since then, a daily monitoring campaign was triggered to monitor J1023 almost daily in November (Pappito et al. 2013) and the X-ray source has stayed at a high flux level with high variabilities on timescales of a few tens of seconds. In this study, we mainly focus on the observations taken after the X-ray brightening (i.e., October 18) to investigate the origin of the enhanced X-ray radiations. All the Swift observations used in this analysis are listed in the Table 1.
We downloaded the observations from the Swift Quick Look Archive and extracted spectra as well as lightcurves by the HEAsoft (version 6.14) Swift-specific tasks xrtgrblc and xrtgrblcspec in which count-rate dependent regions are applied. As no significant spectral variability are seen among the individual observations during the high state, we combined all the selected events to construct an averaged X-ray spectrum (0.3–10 keV) with a total exposure time of 22.6 ks, which can be well described by an absorbed power-law model with best-fit parameters of cm-2 and ( with dof ), inferring an observed flux of erg cm-2 s-1 and an absorption corrected luminosity of erg s-1. Comparing with previous XMM-Newton results (Tam et al. 2010), the X-ray luminosity is increased by at least a factor of 20 with a much softer photon index. We also tried to improve the fit by adding a thermal model such as bbody and mekal (XSPEC built-in models). Although it slightly improves the chi-square statistic, the F-test indicates the null-hypothesis probabilities for the bbody and mekal cases to be 14% and 54%, respectively suggesting that the improvement is not significant. In addition, the featureless X-ray spectrum does not favor any plasma emission contributions.
As the average observed count rate is about 0.21 cts s-1, a 50-second bin time is used for the lightcurve binning to achieve a mean signal-to-noise ratio per bin approximately. Short term variabilities on timescales of a few tens of seconds are clearly seen in the curve with variations up to a factor of ten between two consecutive bins. Interestingly enough, at least 21 of the data bins (with fractional exposure equals one) have zero count rate, which are unlikely random events due to an extremely low Poisson probability of getting a null count in a 50-second exposure (i.e., 0.0027%). Some of the zero count bins are close enough with other low count rate bins ( 0.07 cts s-1) to form several low-flux intervals in ranges of 200 to 550 seconds. Meanwhile, the peak flux reaches cts s-1 which arises from cts s-1 in 100 seconds, stays for about 50 seconds, and then drops to cts s-1 in 100 seconds. However, no significant hardness variability is found despite the high flux variability. The HEAsoft tasks powspec and efsearch were employed to search for the signals from the known orbital and pulsar periods (Archibald et al. 2009; Wang et al. 2009). Although no reliable signal regarding to the orbit nor the pulsation is found, an unknown periodic signal of s is detected from UT 6:36:42 to 7:04:35 on October 19 (about 7 cycles), which is not detected in other observations.
2.3. UVOT Observations
During the X-ray high state, Swift/UVOT observed the source simultaneously with the XRT using the U (3465) and/or UVW1 (2600) band filters with IMAGE or EVENT mode (Table 1). The optical/UV counterpart is clearly detected in all UVOT images. Using the HEAsoft tasks uvotmaghist and uvotevtlc, we found that the UV magnitudes are much brighter than those quiescent measures taken in June by mag. The UV emission varies among the observations between 16.76–15.98 mag (U) and 16.90–16.12 mag (UVW1) with uncertainties less than 0.07 mag (extinction uncorrected). No trend can be found when folding the obtained lightcurve by the orbital period days (Thorstensen & Armstrong 2005) suggesting that the variability is not orbit related. EVENT mode observations were started from November 6, which allow us to investigate short term variabilities with timescales down to a few tens of seconds. We chose a binning factor of 50 seconds and found that the binned lightcurves are full of variabilities with timescales between and seconds. The corresponding XRT data were examined but no clear correlation between the UV lights and the X-rays was found.
| Obs Id | Date222All observations were taken in 2013. | Exp | UVOT filter | Mode333UVOT observing mode. I: IMAGE mode; E: EVENT mode. | X-ray state |
|---|---|---|---|---|---|
| (m/d) | (s) | (U/UVW1) | (I/E) | (High/Low) | |
| 80035001 | Jun 10 | 1918 | UVW2 | I | L |
| 80035002 | Jun 12 | 1863 | UVW1 | I | L |
| 80035003 | Oct 18/19 | 9907 | U & UVW1 | I | H |
| 33012001 | Oct 31 | 1910 | U | I | H |
| 33012002 | Nov 04 | 2083 | U | I | H |
| 33012003 | Nov 06 | 1011 | UVW1 | E | H |
| 33012004 | Nov 07 | 939 | UVW1 | E | H |
| 33012005 | Nov 08 | 1264 | UVW1 | E | H |
| 33012007 | Nov 10 | 1116 | UVW1 | E | H |
| 33012008 | Nov 11 | 1134 | UVW1 | E | H |
| 33012009 | Nov 12 | 2295 | UVW1 | E | H |
| 33012010 | Nov 13 | 1121 | UVW1 | E | H |
2.4. Keck/DEIMOS Optical Spectrum
We obtained a 500-second spectroscopic observation from the DEIMOS multi-object spectrograph with a 0.8 arcsec slit on the Keck II telescope at UT 15:29:15 on November 3. The spectrum covers from 4750 to 9600 at resolution. The DEEP2 DEIMOS Data Pipeline was used for the CCD processing and flux was calibrated using HD19445 and the last photometric measure of Halpern et al. (2013) (i.e., mag). Due to an unstable weather condition during the observation as well as the large spectral deviation between the calibrator (Ap) and the target (G-type+low temperature accretion disk), we note that the flux calibration may not be very accurate. Obvious emission lines of H, He i 5876, and He i 6678 are detected in the spectrum and a double peak feature is marginally seen in the H line profile with a peak separation of , equivalent to a radial velocity difference of that is consistent with the earlier spectroscopic analysis from Halpern et al. (2013). Similar to the SDSS spectrum taken during the last accretion state in 2000–2001 (Wang et al. 2009), the continuum can be well fitted by a multi-temperature disk model plus an irradiated G5V companion of 17.35 mag given that the observation was taken during the plateau of the companion’s modulated light curve (Thorstensen & Armstrong 2005; Wang et al. 2009). Detailed accretion disk modelling will be discussed in the theory section (§ 3).
2.5. Lulin One-Meter Telescope
On November 16, we observed J1023 with the Lulin One-Meter Telescope (LOT) at Lulin Observatory in Taiwan, using SDSS , , and filters. Two -band (one minute and two minutes), six -band (two minutes), plus one -band (two minutes) exposures were obtained under a good weather condition. Standard data reduction and aperture photometry were performed by the IRAF packages to compute the mean magnitudes ( mag, mag, and mag) for which the flux calibration was done by using three SDSS DR8 bright sources in the field (i.e., SDSS J102354.69+003516.2, J102357.97+004027.7, and J102338.46+003624.4) and the errors were calculated by assuming a Poisson distribution with standard propagation of errors. The photometry is roughly consistent but less bluer than the DEIMOS spectrum. For the -band images, we took the first image at 19:30 UT (near the time of inferior conjunction; see Thorstensen & Armstrong 2005 for details) and consecutively made the rest of the observations (every 140 seconds) 36 minutes later. A large magnitude change of is seen from the first two images and small variabilities up to in 140 seconds are shown in the consecutive data set. For the -band magnitudes, we transformed them from SDSS system to Johnson filter system (Jester et al. 2005) and compared them with the ones reported in Halpern et al. (2013). The transformed magnitudes ( and ) are very close to Halpern’s values at similar orbital phase.
2.6. Radio observations
The radio emission from the position of J1023 was first reported by the FIRST VLA 1.4 GHz survey (Becker, White, Helfand 1995). In re-examining the FIRST data, Bond et al. (2002) realized that the detection reported by Becker et al. (1995) was based on a single mJy flare from a 1.4 GHz observation on 10 August 1998. On the other hand, the observations on 3 August 1998 and 8 August 1998 resulted in non-detections and the corresponding limiting flux densities are mJy and mJy, respectively (Bond et al. 2002). These observations clearly demonstrate the variability of the radio emission from this binary system, which can vary by a factor of over a time interval as short as a week. However, without the optical spectroscopic results from this epoch, it remains uncertain whether the system was in a rotation-powered or an accretion-powered state. But transient radio emission from a neutron star in an accreting binary is possible (Gaensler, Stappers, & Getts 1999). During the rotation-powered phase, the radio emission from J1023 becomes more intense. Archibald et al. (2009) reported a mean flux density of mJy at 1.6 GHz. Recently, a long-term radio monitoring campaign of J1023 from mid-2008 to mid-2012 reports the variable radio properties such as variable eclipses, short-term disappearance of signal and excess dispersion measure at random orbital phases (Archibald et al. 2013).
Based on a radio observation at 1.4 GHz performed on 23 June 2013, Stappers et al. (2013) reported the non-detection of pulsed radio emission from J1023 with a limiting flux density of mJy. However, it should be cautious in interpeting the result as it does not necessarily provide evidence for the quench of coherent radio emission mechanism. For an alternative scenario, assuming the pulsar remains to be active, the matter transferred from the companion toward the neutron star can be ejected by the pulsar wind (Ruderman, Shaham & Tavani 1989). Also, the matter evaporated from the disk by the pulsar can further complicate the circumstellar environment. Therefore, even with the presence of active pulsar mechanism, the non-detection of pulsed radio emission can possibly due to the enhanced scattering/dispersion in the environment which results in a smearing of the pulsed signal. Here, we build a theoretical model to explain the multi-wavelength observations of J1023 in its current accretion active state.
3. Theoretical model
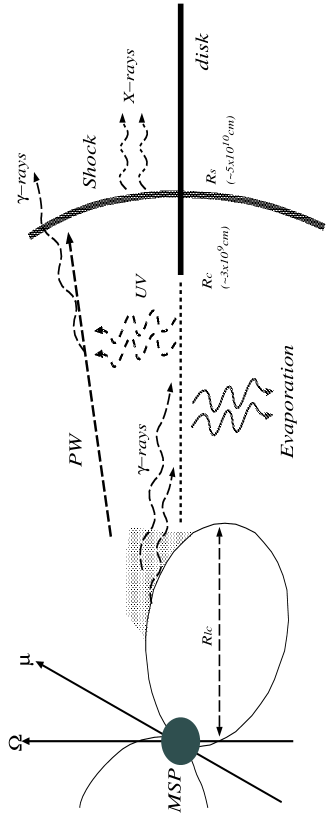
In this section, we discuss a possible scenario for the emission processes in multi-wavelength bands after 2013 late-June. Figure 2 shows a schematic view of the system discussed in this section. With the observed flux of the UV emissions (), the standard gas pressure supported disk model (Frank et al. 2002) implies a mass loss rate of and the inner edge of the accretion disk is cm from the pulsar. This result suggests that the accretion disk does not substantially extend down to the pulsar or the emissions from the disk below cm is inefficient. Indeed, from our optical spectroscopy, the peak velocity of H infers an outer disk size of cm. Takata et al. (2010) proposed that heating associated with deposition of the gamma-ray radiation from pulsar magnetosphere onto the accretion disk evaporates the accretion disk of a LMXB in quiescent state. The gamma-rays are absorbed via the so-called pair-creation process in a Coulomb field by nuclei (e.g. Lang 1999), if the disk column density exceeds . The energy conversion from the gamma-rays to the disk matter promotes the evaporation of the disk. Applying the standard disk model, the critical axial distance from the pulsar, below which the gamma-rays can evaporate the disk, is cm, where is the viscosity parameter in units of 0.1, is the accretion rate in units of and is the critical column density in units of .
We expect that below the critical radius, the accretion disk will move toward the pulsar with a lower accretion rate. The mass loss from the disk due to the gamma-ray deposition reduces the rate of the viscous dissipation, and the distance variation of surface temperature of the disk is more moderate than the one () predicted by the standard disk model, in which the accretion rate is constant with the axial distance. Because it is not obvious the temperature distribution of the accretion disk evaporation due to the irradiation of the gamma-rays, we assume a constant temperature at as the first order of approximation, where is the temperature at the critical distance and is estimated by the standard disk model. Beyond the critical distance , we apply the standard disk model, and we choose the temperature K, which corresponds to an accretion rate of , to explain the optical/UV data.
The existence of the GeV gamma-ray emissions even after the disappearance of the pulsed radio emission suggests that the accretion matter does not enter into the pulsar magnetosphere, and the rotation powered activities are still turned on. Hence, we assume that the disk extends beyond the light cylinder radius cm. The flux at the frequency from the disk is
| (3) |
where kpc is the distance to the system, is the Planck constant, is the speed of light, is the Boltzmann constant and (Wang et al. 2009) is the Earth viewing angle measured from the direction perpendicular to the orbital plane. With the present assumption of the temperature distribution, the luminosity of the disk emissions below is comparable to or smaller than that above .
Tam et al. (2010) expected that the GeV emissions during the pulsed radio state are originated from the outer gap in the pulsar magnetosphere, because the inverse-Compton processes of the shocked pulsar wind and the cold-relativistic pulsar wind could not explain the observed flux level. The increase in the flux by a factor of 10 after the the disappearance of the pulsed radio emissions implies that an additional component emerges and it dominates the magnetospheric component. We propose that the inverse-Compton scattering process of the cold-relativistic pulsar wind off the soft photons from the disk produces the additional gamma-rays. With the observed luminosity of the UV emissions from the disk, the depth of the inverse-Compton scattering process is estimated to be of order of , where is the number density of the soft photons, is the luminosity of optical/UV emissions from the disk, is the soft photon energy and is the Thomson cross section. Hence, if the disk extends below cm, the inverse-Compton of the cold-relativistic pulsar wind can produce the observable gamma-rays. We note that the up-scattered photons will be observed as a steady component with the orbital phase, because the accretion disk surrounds the pulsar.
It is believed that the cold-relativistic pulsar wind forms near the light cylinder and carries almost all of the spin down energy into the inter-stellar space. We assume that the pulsar wind mainly consists of the electrons, positrons and magnetic field, and that the energy distribution of the particles forms a mono-energetic function. The Lorentz factor () of the bulk motion of the pulsar wind is related to the magnetization parameter (), which is the ratio of the Poynting flux to the kinetic energy flux. Near the light cylinder, the magnetic energy dominates the particle energy, that is . Beyond the light cylinder, the magnetic field may be dissipated so that the magnetic energy is converted into the particle energy of the flow (Croniti 1990; Lyubarsky & Kirk 2001). The Lorentz factor at the distance is estimated as
| (4) |
where and are the magnetization parameter and the Lorentz factor at the light cylinder, respectively. Because of the theoretical uncertainties of the evolution of the magnetization parameter beyond the light cylinder, we assume a power law form of
| (5) |
where the index is the fitting parameter. In fitting the orbital dependent spectrum of the gamma-ray binary PSR 1259-63/LS2883, Kong et al (2011,2012) applied the above spatial dependent magnetization parameter to explain the observed data. We calculated the inverse-Compton scattering process with an isotropic photon field,
| (6) |
where is the soft photon field distribution from the disk, and the cross section is described by
where , with and (Blumenthal & Gould 1970). The isotropic soft-photon field is a good approximation because the solid angle of the disk measured from the pulsar wind is not small, and the inverse-Compton processes with various collision angles contribute to the emissions. We also take into account the anisotropic inverse-Compton scattering process of the pulsar wind off the stellar photons, although its contribution to the emissions after 2013 late-June is negligible.

After 2013 late-June, the X-ray emission does not show the orbital variation and increases by at least a factor of 20. Previous X-ray observations during the radio millisecond pulsar phase revealed orbital flux variation, implying the emissions from the intra-binary shock (Tam et al. 2010; Bogdanov et al. 2011). Bogdanov et al. (2011) suggested that the emission region near the companion star and its orbital variation are caused by the eclipse of the emission region by the companion star. The disappearance of the orbital variation after 2013 late-June may suggest that the size of the emission region is bigger than that of before 2013 late-June. We expect that the increase in the mass loss rate from the companion star pushes the emission region back toward the pulsar, and more fraction of the pulsar wind is stopped by the shock, resulting an increase in the X-ray emissions from the system. The momentum ratio () of the stellar wind and the pulsar wind is , indicating the intra-binary shock stands at a distance cm from the pulsar if the mass loss rate of the stellar wind after 2013 late-June increases to . With the momentum ratio , the fraction () of the pulsar wind stopped by the shock is estimated as , where (Eichler & Usov 1993). Before 2013 late-June, because we do not know the mass-loss rate from the companion star, we assume that the X-ray emission regions is close to the L1-Lagrangian point and the size of the emission region is approximately described by the size of the Roche-lobe. The solid angle of the Roche-lobe around the companion star measured from the pulsar is of order of with cm being the radius of the Roche-lobe and the separation between two stars. Hence, the fraction () of the pulsar wind stopped by the shock will increase from % before 2013 late-June to several ten percents after 2013 late-June.
We expect that a strong shock forms if the magnetization parameter is smaller than or comparable to unity and the shocked pulsar wind particles form a power law distribution described by . The maximum Lorentz factor () is determined from the condition for which the particle acceleration time scale is equal to the synchrotron radiation loss timescale, , where is the magnetic field just behind the shock. The minimum Lorentz factor and the normalization factor are calculated from the two conditions that and , where is the radial distance to the shock from the pulsar. With a simple one-dimensional model, we solve the distribution of the pulsar wind particles with the cooling processes via adiabatic expansion and radiation losses. We calculate the synchrotron radiation and the inverse-Compton radiation process from the shocked pulsar wind.
Figure 3 summarizes the results of the model fitting for the observed emissions before (left panel) and after (right panel) 2013 late-June. The dotted, dashed and dashed-dotted lines are the calculated spectra for the emissions from the outer gap (see Wang et al. 2010 for a detailed calculation), shocked pulsar wind and the cold-relativistic pulsar wind, respectively. The double-dotted line in the right panel shows the predicted spectrum of optical/UV emissions with the current model of the accretion disk. The flux predicted by inverse-Compton process of the cold-relativistic pulsar wind before 2013 late-June is of order of and its spectrum is not shown in the figure. As we can see in the figure that the observed GeV emissions after 2013 late-June can be explained well by the inverse-Compton scattering process of the cold-relativistic pulsar wind off the soft photons from the disk. We choose the parameters of the cold-relativistic pulsar wind described by equations (4) and (5) as , and the index , respectively. The observed flux level of the X-ray emissions after 2013 late-June is also reproduced by the shock emissions with a shock distance cm and a power law index . Before 2013 late-June, a harder energy distribution () of the particles at the shock is required to explain the observed photon index () of the X-ray emissions.
The matter evaporated from the disk will smear out the pulsed radio emissions from the neutron star via scattering and/or absorption, if the local plasma frequency is greater than the frequency of the radio wave. Assumed that the disk matter below cm are evaporated by the gamma-rays, one may estimate the local plasma frequency at the scattering region as , where is the evaporation of the disk matter, and is the velocity of the evaporated matter. This suggests that the matter evaporated from the disk smears out the pulsed radio emissions up to a frequency of several GHz, which is consistent with observations that no radio pulsation has been detected below 5 GHz during the accretion active state. In this scenario, the rotation-powered MSP is still active. While detecting the pulsation can be difficult, radio imaging can still be used to check the aforementioned scenario as such technique is not hampered by the complicated environment. Also, as the local charge density can possibly be increased by the aforementioned processes, if the observed frequency is below the local plasma density, this can lead to a non-detection even with imaging. In view of this, a high frequency radio imaging observation is encouraged to confirm/refute this alternative scenario.
4. Discussion
We performed a multi-wavelength study of the MSP binary J1023 using UV/optical, X-ray, and gamma-ray data during its accretion active state starting at late June 2013. Not only there are significant UV/optical and X-ray enhancements, the gamma-rays have increased by a factor of . We suggest that there is a newly formed accretion disk associated with UV emission and the enhanced gamma-rays are produced via inverse Compton scattering between the UV emission from the disk and pulsar wind. At the same time, some fraction of the pulsar wind is stopped by the intra-binary shock resulting an increase in X-ray radiation. Because of the gamma-rays from the pulsar magnetosphere, the accretion disk has been evaporated, smearing out the pulsed radio emission even though the rotation powered MSP is still active.
As Figure 1 indicates, the gamma-ray emission has brightened by a factor of 10 on a timescale of several days. In the inverse-Compton scenario discussed in § 3, the brightening timescale seen by corresponds to a migration timescale of the disk down to cm, where the inverse-Compton scattering process is more efficient with a shorter mean free path than the process occurred at outer part of the disk cm. If one assumes a standard disk model, one can see that the migration timescale of the disk from cm to cm is of order of several to ten days, that is, days, where is the radial velocity of the disk and .
Because UV/optical emissions are originated from the accretion disk, their variability timescale s may correspond to the Keplerian motion at the emission region. The standard disk model implies that UV/optical emissions with the observed luminosity level are mainly from the axial distance cm, corresponding to an orbital period of , which is consistent with the observed timescale.
In the X-ray energy bands, the origin of the timescale s of the observed variability is more speculative with the shock emission model discussed in § 3. But one may consider that the observed variability is caused by either perturbation of shock front due to clumpy stellar wind or wind speed variation (), or sound propagation () in the shock front (cm). A more detailed consideration will be required to identify the origin of the X-ray variability.
JT and KSC are supported by a GRF grant of HK Government under HKU7009 11P. AKHK is supported by the National Science Council of the Republic of China (Taiwan) through grants NSC100-2628-M-007-002-MY3, NSC100-2923-M-007-001-MY3, and NSC101-2119-M-008-007-MY3. PHT is supported by the National Science Council of the Republic of China (Taiwan) through grant NSC101-2112-M-007-022-MY3. CYH is supported by the National Research Foundation of Korea through grant 2011-0023383.
References
- (1)
- (2) Abdo, A.A. et al. 2009, ApJ, 706, 1331
- (3)
- (4) Abdo, A.A. et al. 2010, Science, 329, 817
- (5)
- (6) Alpar, M.A., Cheng, A.F., Ruderman, M.A., Shaham, J. 1982, Nature, 300, 728
- (7)
- (8) Archibald, Anne M.m Kaspi, V.M., Hessels, J.W. T., Stappers, B., Janssen, G., Lyne, A., 2013, ApJ, submitted (arXiv:1311.5161)
- (9)
- (10) Archibald, Anne M., Kaspi, Victoria M., Bogdanov, Slavko, Hessels, Jason W. T., Stairs, Ingrid H., Ransom, Scott M., McLaughlin, Maura A., 2010, 722, 88
- (11)
- (12) Archibald, A. M. et al., 2009, Sci, 324, 1411
- (13)
- (14) Becker, R.H., White, R.L.; Helfand, D.J., 1995, ApJ, 450, 559
- (15)
- (16) Blumenthal, G.R., Gould, R.J., 1970, RvMP, 42, 237
- (17)
- (18) Bogdanov, S. Archibald, A.M., Hessels, J.W. T., Kaspi, V.M., Lorimer, D. McLaughlin, M.A., Ransom, S.M., Stairs, I.H., 2011, ApJ, 742, 97
- (19)
- (20) Bond, H.E., White, R.L., Becker, R.H., O’Brien, M.S., 2002, PASP, 114, 1359
- (21)
- (22) Campana, S., Colpi, M., Mereghetti, S., Stella, L., Tavani, M., 1998, A&ARv, 8, 279
- (23)
- (24) Coroniti, F. V., 1990, ApJ, 349, 538
- (25)
- (26) Eichler, D., Usov, V., 1993, ApJ, 402, 271
- (27)
- (28) Frank, J., King, A., & Raine, D. 2002, Accretion Power in Astrophysics (Cambridge: Cambridge Univ. Press)
- (29)
- (30) Gaensler, B.M., Stappers, B.W., Getts, T.J., 1999, ApJL, 522, 117
- (31)
- (32) Halpern, J.P., Gaidos, E., Sheffield, A., Price-Whelan, A.M., Bogdanov, S., 2013, ATel, 5514, 1
- (33)
- (34) Homer, L., Szkody, P., Chen, B., Henden, A., Schmidt, G., Anderson, S.F., Silvestri, N.M., Brinkmann, J., 2006, AJ, 131, 562
- (35)
- (36) Jester, S., et al. 2005, 130, 873
- (37)
- (38) Kong, A.K.H., 2013, ATel, 5515, 1
- (39)
- (40) Kong, S.W., Cheng, K.S., Huang, Y.F., 2012, ApJ, 753, 127
- (41)
- (42) Kong, S.W., Yu, Y.W., Huang, Y.F., Cheng, K.S., 2011, ApJ, 416, 1067
- (43)
- (44) Liang K.R. 1999, Astrophysical Formulae (New York: Springer)
- (45)
- (46) Lyubarsky, Y., Kirk, J.G., 2001, ApJL, 547, 437
- (47)
- (48) Nolan, P.L., et al. 2012, ApJS, 199, 31
- (49)
- (50) Papitto, A. et al. 2013, Nature, 501, 517
- (51)
- (52) Patruno, A., Archibald, A. M., Hessels, J. W. T., Bogdanov, S., Stappers, B. W., Bassa, C. G., Janssen, G. H., Kaspi, V. M., Tendulkar, S., Lyne, A. G. 2014, ApJ, 781, L3
- (53)
- (54) Ruderman, M., Shaham, J., Tavani, M., 1989, ApJ, 336, 507
- (55)
- (56) Stappers, B.W. et al. 2013, ATel, 5513, 1
- (57)
- (58) Tam, P.H.T., Hui, C.Y., Huang, R.H.H., Kong, A.K.H., Takata, J., Lin, L.C.C., Yang, Y.J., Cheng, K.S., Taam, R. E., 2010, ApJ, 724, L207
- (59)
- (60) Takata, J., Cheng, K.S., Taam, R.E., 2012, ApJ, 745, 100
- (61)
- (62) Takata, J., Cheng, K.S., Taam, R.E., 2010, ApJ, 723, L68
- (63)
- (64) Thorstensen, J.R., Armstrong, E., 2005, AJ, 130, 759
- (65)
- (66) Wang, Y., Takata, J., Cheng, K.S., 2011, MNRAS, 414, 2664
- (67)
- (68) Wang, Z., Archibald, A.M., Thorstensen, J.R., Kaspi, V.M., Lorimer, D.R., Stairs, I., Ransom, S.M., 2009, ApJ, 703, 2017
- (69)
- (70) Wu, E.M.H. et al. 2012, ApJ, 761, 181
- (71)
- (72) Woudt, P.A., Warner, B., Pretorius, M.L., 2004, MNRAS, 351, 1015
- (73)