Current Address: ]Time and Frequency Division, NIST, Boulder CO, 80305
Capture and isolation of highly-charged ions in a unitary Penning trap
Abstract
We recently used a compact Penning trap to capture and isolate highly-charged ions extracted from an electron beam ion trap (EBIT) at the National Institute of Standards and Technology (NIST). Isolated charge states of highly-stripped argon and neon ions with total charge , extracted at energies of up to eV, are captured in a trap with well depths of eV. Here we discuss in detail the process to optimize velocity-tuning, capture, and storage of highly-charged ions in a unitary Penning trap designed to provide easy radial access for atomic or laser beams in charge exchange or spectroscopic experiments, such as those of interest for proposed studies of one-electron ions in Rydberg states or optical transitions of metastable states in multiply-charged ions. Under near-optimal conditions, ions captured and isolated in such rare-earth Penning traps can be characterized by an initial energy distribution that is 60 times narrower than typically found in an EBIT. This reduction in thermal energy is obtained passively, without the application of any active cooling scheme in the ion-capture trap.
I Introduction
Highly-charged ions (HCI) are of interest in the study of atomic structure, astrophysics, and plasma diagnostics for fusion science Beyer and Shevelko (2003). The high nuclear charge, , tends to amplify relativistic effects in atoms, such as fine and hyperfine structure splitting Gillaspy (2001). For example, the fine structure energy splitting is proportional to , where is the fine structure constant, and hence can be so large for some high ions that the transition frequency is scaled up from the microwave to the visible domain of the electromagnetic spectrum Jentschura et al. (2008) – a useful feature for observing astrophysical objects.
Apart from natural sources, highly-charged ions have become more widely accessible with the development of laboratory facilities like heavy-ion storage rings Habs and et. al. (1989) and more compact devices like the electron-cyclotron resonance (ECR) ion source Geller (1996) and the electron beam ion trap/source (EBIT/EBIS) Levine et al. (1988); Donets (1998); Motohashi et al. (2000); Xiao et al. (2012). These ion sources are useful in various research areas, including: spectroscopy (moments, spectral lines, etc.), ion-surface interactions Gillaspy et al. (2001), plasma diagnostics for next-generation tokamak fusion reactors such as the International Thermonuclear Experimental Reactor (ITER) Gillaspy et al. (2009), and tests of astrophysical models (see Gillaspy et al. (2011) and references therein).
The isolation of single species, highly-charged ions at low energy in traps can enable some interesting studies of atomic and nuclear phenomena Yang and Church (1993). As a recent example, high precision studies of HCIs have been proposed to realize atomic clocks based on Nd13+ and Sm15+ Dzuba et al. (2012) for laboratory investigations of the variation (temporal and spatial) of . Another possibility is to test theory in Rydberg states of one-electron ions with comb-based spectroscopy, which could led to a Rydberg constant determination that is independent of the proton radius. Jentschura et al. (2008)
A broad survey of trap types and ion sources developed to advance measurements of atomic and nuclear properties can be found in the 2003 review article by Kluge, et al. Kluge et al. (2003). A variety of useful techniques have been developed for the study of trapped positrons Surko and Greaves (2004), antiprotons Gabrielse et al. (1989) and antihydrogen (see Ref. Gabrielse et al. (2012) and references therein) as well as highly-charged ions in Penning traps Penning (1936) with meter-long electrode structures surrounded by multi-tesla solenoid magnets Andjelkovic et al. (2010); Repp et al. (2012). In some of the earliest experiments, a cryogenic Penning trap (RETRAP) with a high-field superconductive magnet Schneider et al. (1994) was employed to capture ions extracted from an EBIT at the Lawrence Livermore National Laboratory (LLNL). More recently, SMILETRAP II demonstrated capture and cooling of Ar16+ in a Penning trap utilizing a room-temperature 1.1 T solenoid magnet Hobein et al. (2011).
Solenoidal magnets can generate a strong magnetic field for ion confinement, but they also impose geometrical constraints that hinder the access of laser or atomic beams to be directed at the stored ions. In our effort to produce and study one-electron ions in Rydberg states, we have designed unitary Penning traps for isolating single-species charge states of highly-stripped ions extracted from an EBIT at NIST Tan et al. (2012). The unitary architecture is useful also for studying long-lived transitions, as will be discussed in forthcoming publications. Initial demonstrations Tan et al. (2012, 2011); Guise et al. (2013) reported the use of unitary Penning traps to isolate and store various HCIs. In this work, we discuss the dynamical considerations and experimental manipulations that are essential for optimized performance to maximize the number of stored ions as well as minimize the energy distribution for precise measurements.
A brief description of the system configuration is provided in Sec. §II. Numerical simulations were carried out to guide the design of the compact Penning trap and additional beam-conditioning components, as discussed in Sec. §III, with emphasis on the deceleration of fast ( 40 keV) ions approaching the region 3 cm in front of the trap. Section §IV.1 describes charge state selection and ion pulse optimization, emphasizing the importance of (a) minimizing the time width of the extracted ion pulse, and (b) matching the deceleration potential near the Penning trap to ion extraction energy. Results from recent ion capture experiments are presented, illustrating ion capture optimization (Sec. §IV.2) and residual energy measurement (Sec. §IV.3). Finally, a discussion of the ion capture efficiency is presented in Sec. §V.
II Experimental Setup
The experimental set-up, illustrated in Figure 1, consists of the EBIT with its ion extraction beamline, and the recently-installed ion-capture apparatus. Since some parts of the set-up have been described in detail elsewhere Tan et al. (2012); Guise et al. (2013), only a brief overview is given here.
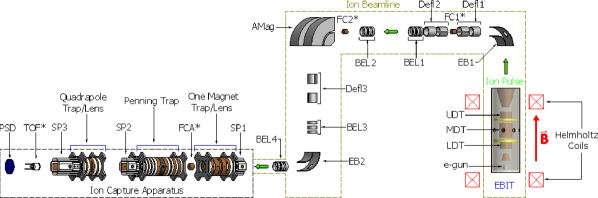
Highly-charged ions are produced in the EBIT, bound radially to the energetic electron beam along the axis. Axially the ions are trapped in an electrostatic well created by applying electric potentials to three cylindrical electrodes, called drift tubes–labelled by their location: upper (UDT), middle (MDT), and lower (LDT), with . To extract an ion bunch, the MDT can be quickly raised to a value thus ejecting HCIs into the beamline Tan et al. (2011); Pikin et al. (1996); Ratliff et al. (1998).
Electrostatic ion optics in the beamline guide (EB1, Defl 1-3, EB2) and focus (BEL 1-4) the extracted ions, transporting them over an 8-meter trajectory from the EBIT to the unitary Penning trap. At various points, retractable Faraday cups (FC1-2) can be inserted to monitor the ion beam. About half-way along the beamline, an analyzing electromagnet (AMag) selects a specific charge state to be captured in the Penning trap. The beamline vacuum space has a base pressure of Pa ( Torr).
At the entrance of the ion-capture apparatus, specialized components are used to optimize on-axis injection of HCIs into the unitary Penning trap; a set of four steering plates (SP1), a one-magnet trap/einzel lens, and a retractable Faraday cup (FCA) allow fine adjustments in alignment and ion pulse conditioning Guise et al. (2013). After confinement in the Penning trap (Fig. 2), stored ions are detected by ejection to one of the ion detectors. A retractable micro-channel plate (MCP) with fast response is used for ion counting and time-of-flight (TOF) or charge state analysis. If the fast TOF detector is retracted, as discussed in Guise et al. (2013), a position-sensitive MCP ion detector (PSD) can be used during beam alignment and conditioning. The TOF detector is a “Chevron”, or V-stack type Colson et al. (1973) with a disc head (8.0 mm active diameter), which is operated in either proportional (charge amplifying) mode, or in a fully-saturated, event counting mode. An event pulse has rise/fall time 350 ps with a gain of per incident charge.
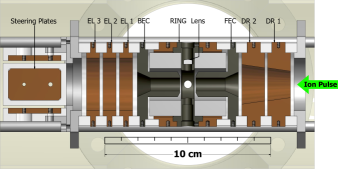
Figure 2 shows a half-cut view of the unitary Penning trap used to capture ions. The unitary architecture Tan et al. (2012) makes the ion trap extremely compact, with an electrode assembly volume of less than 150 cm3. The magnetic field for radial confinement of stored ions is generated by two rare-earth magnets that are yoked by the soft-iron electrodes (FEC, RING, and BEC). The front endcap (FEC) and the back endcap (BEC) are maintained at a higher potential than the RING electrode to form an axial trapping well. The two deceleration electrodes (DR 1 and DR 2) adjacent to the front endcap are crucial for slowing ions before they enter the unitary Penning trap; their conical inner surfaces are tailored to produce near-planar equipotential surfaces. Application of static and time-varying electrical potentials is controlled through a computer interface, the details of which are provided in Sec. IV. A separate vacuum chamber houses the room-temperature Penning trap, allowing control of the background gas composition and pressure; the base pressure of this vacuum chamber is Pa ( Torr).
III Simulations
Numerical simulations have been carried out to investigate: (a) the optimal electrode geometry of a unitary Penning trap designed to slow, capture, and store ions extracted from an EBIT; (b) the operation settings, such as voltages and switching times for controlling electrodes; and (c) the ideal conditions of an incoming ion bunch. Ion capture simulations involve computations of both the magnetic field in the trap as well as the electrostatic potential generated by the trap electrodes and focusing elements, generally under time-varying potentials. The details of the magnetic field calculations, including comparisons with measured trap fields, are presented in Tan et al. (2012). The measured magnetic field strength is 310 mT in the trapping region and is in good agreement with the calculated field. The electric field in the trap assembly is calculated using a numerical Boundary Element Method (BEM), originally developed for computing properties of electrostatic lenses Harting and Read (1976).
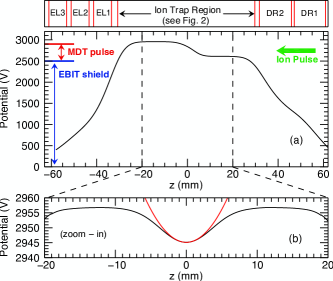
An example of the calculated electrostatic potential along the axis of the ion trap is shown in Fig. 3. The “open” condition in preparation for ion capture is shown in (a) and the “closed” condition following ion capture is shown in (b). The applied voltages for each electrode and the critical EBIT parameters are listed in Table I. The EBIT shield voltage and MDT high voltage pulse levels are included in Fig. 3a for comparison. As shown in Fig. 3b, the axial potential well near the trap center is well approximated by an analytic quadrupole potential, which in cylindrical coordinates takes the form Brown and Gabrielse (1986); Tan et al. (2012)
| (1) |
The field coordinates and are defined from the center of the trap; is the applied potential difference between the endcaps and the central ring electrode, is the common-mode or float potential, and is a geometric factor
| (2) |
The coefficient (often referred to as ) is of order unity. The characteristic dimensions and are from the center of the trap to the ring and endcap electrodes, respectively. For the Penning trap presented here, mm, mm, and .
| Penning Trap Parameters | |
| Trap Electrode | Applied Potential (V) |
| DR1 | 1300.0 |
| DR2 | 1600.0 |
| FEC | (Low) 2610.0 |
| (High) 2956.8 | |
| Ring | 2926.8 |
| BEC | (Low) 2460.0 |
| (High) 2956.8 | |
| EL1 | 500.0 |
| EL2 | 1500.0 |
| EL3 | 500.0 |
| EBIT Parameters | |
| e- beam Energy | 2.5 keV |
| e- beam Current | 14.4 mA |
| LDT | 500 V |
| MDT | Trap Dump = 400 V |
| UDT | 220 V |
| Ionization Time | 76.0 ms |
| Analyzing B-field | 66.22 mT |
Special care was taken in designing the two deceleration electrodes, DR1 and DR2, to generate nearly planar equipotential surfaces with resulting gradient that tends to remove axial kinetic energy from ions entering the trap. In order to attain the lowest possible residual energy after capture it is important to minimize momentum transfer to transverse motions as the ions are injected into the Penning trap.
With the computed electric and magnetic fields Tan et al. (2012) and a given set of initial conditions (the ion position and velocity), an ion trajectory is calculated by integrating the equations of motion using an adaptive step-size Runge-Kutta technique such as provided by a commercial code, Charged Particle Optics Harting and Read (1976); dis . A triangle mesh ratio limit (side/length) of 20 yields fractional precision of 10-4 for the electric field and ray tracing computations.
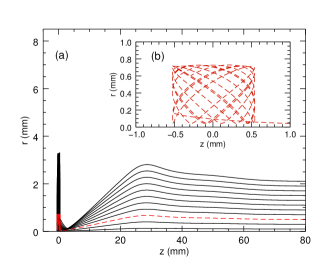
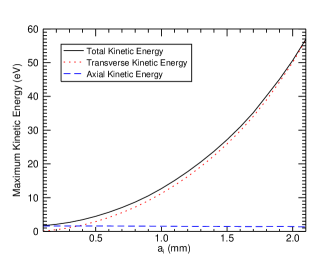
In this work, only single particle trajectories are computed to model the properties of the system. An improved model would require the inclusion of the inter-ion coulomb interaction, and is not practical for computational resources available in this work. To first approximation, single-particle trajectories have been useful in finding the optimal conditions for successful ion capture. To illustrate, trajectories calculated for a range of impact parameter values, (perpendicular distance from trap axis at mm) are presented in Fig. 4. Each trajectory starts with the same initial velocity entirely parallel to the trap axis (the direction of propagation), representing the zero-emittance Humphries (1990) beam condition. Iterating such computation for various trap parameters, the potentials on the deceleration electrodes DR1 and DR2, as well as the electrode geometry, have been optimized to capture ions in trajectories with the smallest amplitudes of resulting bound motions. Fig. 5 shows the maximum ion kinetic energy after capture, calculated as a function of impact parameter, for Ar13+ ions (; Ar XIV in spectroscopic notation). The deceleration is most effective on-axis, for which the initial ion kinetic energy is removed more completely. As the impact parameter increases, the residual energy after capture increases.
Single particle simulation has been particularly useful for finding the capture time ( at which the Penning trap must be switched from the open configuration to the closed configuration to capture and store ions. A rough estimate is the mean transit time of the ion pulse from the EBIT to the Penning trap. The front endcap (FEC), momentarily held below the ring potential to admit ions into the trap, must be switched to close the trap within a certain arrival time tolerance. If FEC is switched to close the trap too early, before the extracted ions enter the trapping region, the ions will scatter off and not be captured. On the other hand, if FEC is closed too late, ions will have entered the trap, turned around, and exited the trapping region–before they can be captured. For a given initial energy and trap well configuration, there is a range of arrival times wherein the FEC electrode can be switched to successfully confine the ions that have entered the trap; the width of this allowed range for ion capture is labeled the capture time width (CTW). The CTW can be estimated by computing ion trajectories to find bound motions for a family of times at which FEC is switched to close the trap, in 10 ns time steps, assuming the same initial kinetic energy in each calculation. For ions injected on-axis, the probability of ion capture is a flat-top function of the time when FEC is switched to close the trap. The width of this function is an estimate of the capture time width. For the case of Ar XIV, CTW 80(20) ns is calculated for the optimal trapping conditions given above in Table 1. For comparison, in a high-field Penning trap with a long electrode stack, the ions are captured in a nearly-flat bottom (square-well) potential and the CTW is well approximated by the round-trip time, which can range from 300 ns Fei et al. (1987) to about s Schneider et al. (1994). The CTW of a compact Penning trap tends to be shorter due to its size. However, as illustrated in this work, the CTW of a unitary Penning trap is sufficient to capture a broad range of ions.
IV Experiments
IV.1 Pulsed extraction of ions
The energy available for electron impact ionization in an EBIT is set by a common-mode, float voltage applied to the drift tube assembly. In this work, the float voltage is adjusted to give an electron beam energy () in the range from 2.0 keV to 4.0 keV with an electron beam current () in the range from 6 mA to 150 mA. The NIST EBIT ion-extraction beamline has been optimized for high ion flux Pikin et al. (1996) in ion-surface bombardment experiments Lake et al. (2011), wherein the EBIT is typically operated in a continuous, high-current mode with mA. For the ion capture experiments discussed here, it would be ideal for the extracted ions to be bunched tightly in both space and time. Therefore, the EBIT is operated in a low-current, pulsed extraction mode. The electron beam energy and current are chosen to optimize the production and capture of selected ions. As an example we present the case of Ar13+ extracted at an electron beam energy of E 2.50 keV and electron beam current I 14.4 mA.
To extract ions in pulses, a fast (rise time 50 ns) voltage pulse of 0 V to 400 V is applied to the MDT electrode in addition to the float voltage. As indicated in Table 1, the UDT electrode is biased at a lower potential than the LDT electrode. Consequently, the rapid rise in MDT voltage pushes all ions in the EBIT into the beamline. As illustrated in Figure 1, ions leaving the EBIT are transported via the ion optics in the horizontal beamline to an analyzing magnet that filters to select a specific charge state.
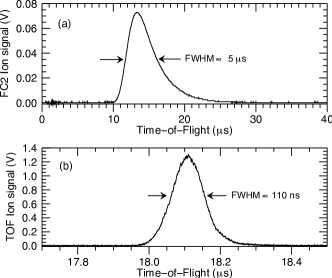
Figure 6 (a) shows a typical Faraday cup signal generated by ions of various charge states striking FC2 immediately in front of the analyzing magnet. The analyzing magnetic field is tuned to single out a specific charge state to pass through the magnet, with its trajectories bent into the vertical beamline segment while all other charge states will hit the chamber wall. Illustrative examples are provided in Guise et al. (2013). The selected charge state is guided further into the ion capture apparatus. For beam diagnostics, the extracted ion pulse passes through the grounded Penning trap and is detected using a fast TOF detector. As shown in Fig 6 (b), the charge-state-selected ion signal amplitude is 1.3 V and has a full width at half maximum (FWHM) of 110 ns, corresponding to 1435 ions per extraction pulse passing through the trap. By fine tuning the electrostatic elements in the ion beamline, the EBIT settings, and the analyzing magnet field, this TOF signal is optimized for maximum ion pulse amplitude and minimum time width.
IV.2 Slowing and capture
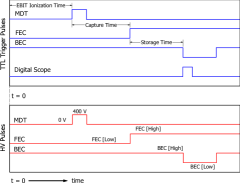
Capturing the extracted ion pulse involves two key aspects: (1) closing the trap at the right time; and (2) tuning the float potential () of the unitary Penning trap to match the EBIT extraction energy. The timing diagram for ion extraction and capture is shown in Fig. 7. Details of the ion detection scheme are discussed in Tan et al. (2012); Guise et al. (2013).
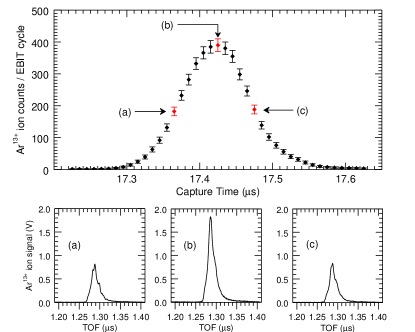
Experimentally, the “capture time,” the time at which the entrance endcap electrode is switched to close the trap, is varied to maximize the number of ions captured per pulse. A measurement of the optimal ion capture time is shown in Fig. 8. Ions are captured and stored for 1 ms before being counted by ejection to the TOF detector. In contrast to the ideal case presented in §III, the observed ion capture time profile (Fig. 8 top) is mainly shaped by the characteristics of the ion pulse extracted from the EBIT. The observed peak gives the optimal capture time. In the case of Ar13+ ions, the optimal capture time occurs at 17.43 s after pulsed extraction from the EBIT with a nominal energy of 2.50 keV.
Another important consideration that affects the residual energy of captured ions is the deceleration of the ion pulse as it approaches the Penning trap, which is controlled largely by the common-mode, float voltage applied to all electrodes in the Penning trap assembly. In the continuous extraction mode, ions escape into the beamline with an energy of , where is the electron beam energy; in contrast, for pulsed extraction mode, the fast switching of the MDT electrode gives ions an additional eV of kinetic energy. The float voltage on the unitary Penning trap is adjusted to match the incoming ion energy, thus fine-tuning the amount of energy that is to be removed from the ion bunch in the process of being slowed and captured.
The influence of energy matching is illustrated in Figures 9 and 10. The trap float voltage is adjusted to obtain the optimal ion capture signal. The number of ions following 1 ms storage is measured as a function of the trap float voltage. There is a broad maximum between 2880 V and 2940 V. However, the width of the TOF signal drops steadily over that same voltage interval. The narrowing of the TOF width as a function of the float voltage indicates that as is increased, the energy matching between the Penning trap and the extraction energy of the incoming ion pulse is improving. As is further increased, the number of captured ions begins to decrease significantly, because more of the incoming ions lack the kinetic energy to reach the trapping region.
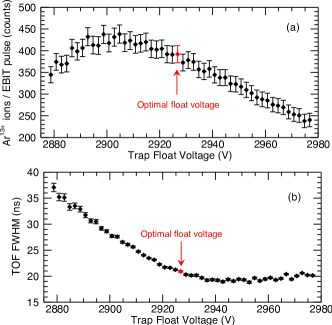
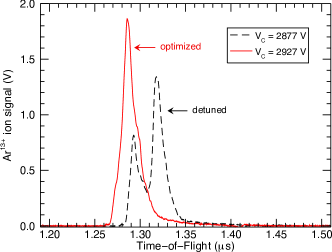
Dramatic broadening in the TOF signal for ions ejected from the Penning trap can result from mistuning of the float voltage, as illustrated in Figure 10. For a float voltage that is well below optimal value, the captured ions can have energy significantly higher than the bottom of the potential well, and a double peak structure in the TOF signal is observed. For float voltages near the optimal value, the TOF signal is single peaked and narrower, with an optimal FWHM 18.5 ns. It is important for the TOF signal to be single peaked for proper interpretation of lower charge states generated after long storage times Tan et al. (2012). Furthermore, as the float voltage approaches the optimal value from below, the TOF signal becomes narrower (see Figure 9 b) indicating that the captured ions have less residual energy.
IV.3 Energy of captured ions
Experiments and model simulations, discussed in previous sections, have been useful in developing a unitary Penning trap for capturing multi-charged ions. Trap parameters were deliberately sought to favor computed ion trajectories which lead to bound motions with small amplitudes. Furthermore, the control settings of the ion source, electrostatic ion optics, and compact Penning trap have been tuned in an attempt to maximize the number of ions captured, as well as to minimize the width of the time-of-flight signal. Consequently, Fig. 9b indicates that the residual energy in bound ion motions can be significantly reduced.
To measure the energy distribution of captured ions, we used an over-the-barrier technique that is well-established in high-magnetic-field, multi-well Penning traps Gabrielse et al. (1989). In the standard method, ions escaping from confinement are guided by strong magnetic field lines to an ion counter if they have sufficient energy to surmount a controlled potential barrier. The ion count is correlated with the instantaneous height of the potential barrier to obtain the energy distribution.
The use of this method in a unitary Penning trap, on the other hand, requires some modification because of several features: (1) the magnetic field (maximum 0.31 T at the center) drops rapidly, particularly as the ions enter the endcap; (2) the reentrant endcaps make the well minimum very sensitive to asymmetrically applied voltages; (3) the ions are guided mainly by electrostatic ion optics to the detector. Hence, in order to minimize the transport losses during the energy measurement, the ring electrode has been used to control the barrier height. The ion cloud energy, 1 ms after capture, has been measured by slowly ramping up the trap ring electrode voltage at a specified rate. As the ring voltage rises, the axial potential well depth decreases, allowing successively slower ions to escape over a known potential barrier in transit to the detector. An ion energy distribution of Ar13+ ions escaping from a unitary Penning trap is shown in Fig. 11.
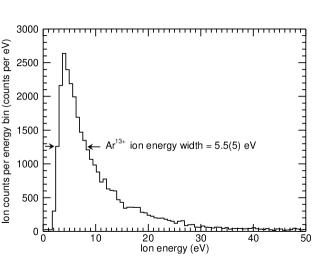
The TOF detector was operated in the ion-counting mode, with a fully-saturated bias voltage of -1730 V. A fast multichannel scaler was used to count events, triggered to begin acquisition simultaneously with the ramping of the ring electrode voltage. Since the ring electrode voltage is ramped at a controlled rate of 0.1V / s t, we can convert the arrival time of ions at the TOF detector to the corresponding ring electrode voltage, and hence to the barrier height. An ion escaping along the trap axis must have energy exceeding to surmount the barrier potential where is the depth of the electrical potential well (maximum minimum) on axis. For the case considered (Table 1), .
The energy distribution of Ar XIV ions escaping from the unitary Penning trap along its axis has a FWHM energy width of 5.5 0.5 eV. This energy distribution is a factor of 60 narrower than expected inside an EBIT Lapierre et al. (2005). The over-the-barrier method generally gives an upper limit for the ion energy since the escaping ions tend to heat up from release of the ion cloud space-charge potential energy Gabrielse et al. (1989). It is worth noting also that this is an estimate of the residual energy distribution shortly after capture, before any active cooling scheme has been implemented.
Generally, a narrower energy distribution is favorable for spectroscopy because the Doppler broadening of spectral lines tend to have a Gaussian distribution with a FWHM line-width that is related to system parameters by where is the transition frequency, is the Boltzmann constant, is the ion cloud temperature, is the mass of the radiator, and is the speed of light.Griem (1997) For example, the spectral lines emitted by an Ar13+ ion cloud with temperature eV are expected to have a fractional Doppler line-width of .
V Ion capture efficiency
The number of extracted ions captured in the Penning trap is determined in part by the fixed parameters chosen for the trap and beam-tuning structures (e.g., sizes of apertures); it is also affected by adjustments in operating conditions made during experiments to optimize energy and ion pulse width. Trade-offs are made in optimization, as illustrated in Fig.9. Assuming an incoming ion beam with no initial transverse momentum and neglecting space-charge effects, simulations show that ions arriving at a common time can be captured with 100 % efficiency provided the beam radius is less than 2 mm. In practice, the capture efficiency is observed to be roughly 60 % largely because of the velocity spread in the extracted ion bunch. Some ways of reducing the velocity spread to improve capture efficiency are described above. In this section, we present measurements for estimating the number of stored ions and capture efficiency.
We measure the following quantities to characterize ion number in the Penning trap region: (a) , the number of ions striking Faraday cup FCA after passing through the one-magnet Einzel lens with 11.11 mm inner diameter; (b) , the number of ions passing through the grounded trap and hitting the TOF detector; and (c) , the number of ions hitting the TOF detector after passing through the trap floated at high voltage but with the endcaps biased at low settings (Table 1). Column 3 of Table 2 gives these measurements for extracted bunches of Ar13+ ions. The number of ions determined from the Faraday cup signal is the largest since the ion bunch at FCA has not been partially clipped by the 8.00 mm diameter holes in the FEC and BEC electrodes. The active diameters of the FCA and TOF detectors are 9.525 mm and 8.00 mm, respectively.
| Ar13+ ion count | |||
|---|---|---|---|
| Detector (set-up) | symbol | Measured | Simulated |
| FCA (before trap) | 5275 | 5275 | |
| TOF (grounded trap) | 1435 | 1655 | |
| TOF (HV-biased trap) | 687 | 718 | |
For comparison, we computed the ion transport for a Gaussian radial distribution of trajectories entering the one-magnet Einzel lens, passing through the trap, and terminating at the TOF detector. An initial ion velocity of m/s is assigned entirely along the trap axis. Previous experimentGuise et al. (2013) has shown evidence to support a Gaussian density profile in a tightly-focussed beam. The cross-sectional density is modeled by a Gaussian function:
| (3) |
where is the total number of ions and is the one-sigma beam radius; the number of ions within radius is given by the integral . The simulation results for ions and mm are in the last column of Table 2, and agree well with measurements (column 3) for the grounded trap and for the floated trap.
For Ar13+, Figures 9 and 10 indicate that about 400 ions were detected when the ion cloud in the Penning trap was ejected to the TOF detector. To determine the capture efficiency for the Penning trap system, independent of the ion source and beamline used for production and transport of HCIs, we use the number of ions entering the Penning trap while at high voltage, , as the normalization. The resulting efficiency is 57(16)% for the Ar13+ ion capture experiment.
This result agrees with a crude estimate of 61(10)% for capture efficiency obtained from the simulations of Section III. Here the efficiency is calculated as the percentage of total ion signal that arrives at the TOF detector within CTW/2 of the TOF peak; i.e. ns in Fig. 6b. For an on-axis beam, this is the maximum fraction of incoming ions that can be located inside the trap region at one time.
VI Summary
Highly-charged ions produced by electron impact ionization within an EBIT, with electron beam energy of a few keV, have been slowed and captured in a unitary Penning trap deployed on the existing ion-extraction beamline at NIST. The Penning trap is made very compact (less than 150 cm3 in volume) by a unitary architecture that embeds two rare-earth permanent magnets within the electrode structure in order for the trapping apparatus to fit within space constraints, and to provide easy radial access to the stored ions.
The procedure for capturing energetic ions in a unitary Penning trap is presented here with experimental results for the isolation of Ar13+ ions, and is elucidated with simulations of single ion trajectories. Measurements confirm the importance of energy matching and precise timing of capture to achieve the lowest energy distribution for the isolated ions. Simulations provide some insight in designing the set of conical, electrostatic decelerators near the entrance endcap of the ion trap to aid in maximizing ion capture and minimizing residual energy. As a demonstration, Ar13+ ions extracted from the EBIT with 38 keV kinetic energy have been decelerated and captured with a residual energy spread of 5.5(5) eV, measured by ejecting the isolated ions to a TOF detector 1 ms after capture. Without applying any active cooling, this observed energy distribution is times smaller than typically expected for ions inside an EBIT. Colder ion clouds may be attainable by applying evaporative or sympathetic cooling techniques. Recent theoretical studies propose various potential applications for isolated highly-charged ions, including optical frequency standards Derevianko et al. (2012); Dzuba et al. (2012), tests of fundamental symmetries Berengut et al. (2010), and measurement of fundamental constants Jentschura et al. (2008).
VII Acknowledgments
Portions of this work were completed while Nicholas D. Guise held a National Research Council Associateship Award at NIST. We thank Yuri Ralchenko and Craig J. Sansonetti for reading this manuscript carefully and providing useful comments.
References
- Beyer and Shevelko (2003) H. Beyer and V. Shevelko, Introduction to the Physics of Highly Charged Ions (Institute of Physics, 2003).
- Gillaspy (2001) J. D. Gillaspy, J. Phys. B, 34, R93 (2001).
- Jentschura et al. (2008) U. D. Jentschura, P. J. Mohr, J. N. Tan, and B. J. Wundt, Phys. Rev. Lett., 100, 160404 (2008).
- Habs and et. al. (1989) D. Habs and et. al., Nucl. Instr. and Meth. B, 43, 390 (1989).
- Geller (1996) R. Geller, Electron Cyclotron Resonance Ion Sources and ECR Plasmas (Institute of Physics, 1996).
- Levine et al. (1988) M. A. Levine, R. E. Marrs, J. R. Henderson, D. Knapp, and M. Schneider, Physica Scripta, T22, 157 (1988).
- Donets (1998) E. D. Donets, Rev. Sci. Instrum., 29, 614 (1998).
- Motohashi et al. (2000) K. Motohashi, A. Moriya, H. Yamada, and S. Tsurubuchi, Review of Scientific Instruments, 71, 890 (2000).
- Xiao et al. (2012) J. Xiao, Z. Fei, Y. Yang, X. Jin, D. Lu, Y. Shen, L. Liljeby, R. Hutton, and Y. Zou, Review of Scientific Instruments, 83, 013303 (2012).
- Gillaspy et al. (2001) J. D. Gillaspy, L. P. Ratliff, J. R. Roberts, and E. Takács, Highly Charged Ions: Publications of the EBIT Project, 1993-2001, Special Publication 972 (NIST, 2001).
- Gillaspy et al. (2009) J. D. Gillaspy, I. N. Draganić, Y. Ralchenko, J. Reader, J. N. Tan, J. M. Pomeroy, and S. M. Brewer, Phys. Rev. A, 80, 010501(R) (2009).
- Gillaspy et al. (2011) J. D. Gillaspy, T. Lin, L. Tedesco, J. N. Tan, J. M. Pomeroy, J. M. Laming, N. Brickhouse, G.-X. Chen, and E. Silver, The Astrophysical Journal, 728, 132 (2011).
- Yang and Church (1993) L. Yang and D. A. Church, Phys. Rev. Lett., 70, 3860 (1993).
- Dzuba et al. (2012) V. A. Dzuba, A. Derevianko, and V. V. Flambaum, Phys. Rev. A, 86, 054502 (2012a).
- Kluge et al. (2003) H. J. Kluge, K. Blaum, F. Herfurth, and W. Quint, Phys. Scr., T104, 167 (2003).
- Surko and Greaves (2004) C. Surko and R. Greaves, Physics of Plasmas, 11, 2333 (2004).
- Gabrielse et al. (1989) G. Gabrielse, X. Fei, L. A. Orozco, R. L. Tjoelker, J. Haas, H. Kalinowsky, T. A. Trainor, and W. Kells, Phys. Rev. Lett., 63, 1360 (1989).
- Gabrielse et al. (2012) G. Gabrielse, R. Kalra, W. S. Kolthammer, R. McConnell, P. Richerme, D. Grzonka, W. Oelert, T. Sefzick, M. Zielinski, D. W. Fitzakerley, M. C. George, E. A. Hessels, C. H. Storry, M. Weel, A. Müllers, and J. Walz (ATRAP Collaboration), Phys. Rev. Lett., 108, 113002 (2012).
- Penning (1936) F. Penning, Physica, 3, 873 (1936).
- Andjelkovic et al. (2010) Z. Andjelkovic, S. Bharadia, B. Sommer, M. Vogel, and W. Nörtershöuser, Hyperfine Interact., 196, 81 (2010).
- Repp et al. (2012) J. Repp, C. Böhm, J. R. C. López-Urrutia, A. Dörr, S. Eliseev, S. George, M. Goncharov, Y. N. Novikov, C. Roux, S. Sturm, S. Ulmer, and K. Blaum, Applied Physics B, 107, 983 (2012).
- Schneider et al. (1994) D. Schneider, D. A. Church, G. Weinberg, J. Steiger, B. Beck, J. McDonald, E. Magee, and D. Knapp, Rev. Sci. Instrum., 65, 3472 (1994).
- Hobein et al. (2011) M. Hobein, A. Solders, M. Suhonen, Y. Liu, and R. Schuch, Phys. Rev. Lett., 106, 013002 (2011).
- Tan et al. (2012) J. N. Tan, S. M. Brewer, and N. D. Guise, Rev. Sci. Instrum., 83, 023103 (2012).
- Tan et al. (2011) J. N. Tan, S. M. Brewer, and N. D. Guise, Physica Scripta, 2011, 014009 (2011).
- Guise et al. (2013) N. D. Guise, S. M. Brewer, and J. N. Tan, in New Trends in Atomic and Molecular Physics, Springer Series on Atomic, Optical, and Plasma Physics, Vol. 76, edited by M. Mohan (Springer Berlin Heidelberg, 2013) pp. 39–56, ISBN 978-3-642-38166-9.
- Pikin et al. (1996) A. I. Pikin, C. A. Morgan, E. W. Bell, L. P. Ratliff, D. A. Church, and J. D. Gillaspy, Rev. Sci. Instrum., 67, 2528 (1996).
- Ratliff et al. (1998) L. P. Ratliff, E. W. Bell, D. C. Parks, A. I. Pikin, and J. D. Gillaspy, Rev. Sci. Instrum., 68, 1997 (1998).
- Colson et al. (1973) W. B. Colson, J. McPherson, and F. T. King, Rev. Sci. Instrum., 44, 1694 (1973).
- Harting and Read (1976) E. Harting and F. Read, Electrostatic Lenses (Elselvier Publishing Company, 1976).
- Brown and Gabrielse (1986) L. Brown and G. Gabrielse, Rev. Mod. Phys., 58, 233-311 (1986).
- (32) Identification of a product herein is for documentation purposes only, and does not imply recommendation or endorsement by NIST, nor does it imply that this product is necessarily the best available for the purpose.
- Humphries (1990) S. Humphries, Charged Particle Beams (John Wiley and Sons, 1990).
- Fei et al. (1987) X. Fei, R. Davisson, and G. Gabrielse, Rev. Sci. Instrum., 58, 2197 (1987).
- Lake et al. (2011) R. E. Lake, J. M. Pomeroy, H. Grube, and C. E. Sosolik, Phys. Rev. Lett., 107, 063202 (2011).
- Lapierre et al. (2005) A. Lapierre, U. D. Jentschura, J. R. C. López-Urrutia, J. Braun, G. Brenner, H. Bruhns, D. Fischer, A. J. G. Martínez, Z. Harman, W. R. Johnson, C. H. Keitel, V. Mironov, C. J. Osborne, G. Sikler, R. S. Orts, V. Shabaev, H. Tawara, I. I. Tupitsyn, J. Ullrich, and A. Volotka, Phys. Rev. Lett., 95, 183001 (2005).
- Griem (1997) H. R. Griem, Principles of Plasma Spectroscopy (Cambridge University Press, 1997) p. 54.
- Derevianko et al. (2012) A. Derevianko, V. A. Dzuba, and V. V. Flambaum, Phys. Rev. Lett., 109, 180801 (2012).
- Dzuba et al. (2012) V. Dzuba, A. Derevianko, and V. Flambaum, Phys. Rev. A, 86, 054501 (2012b).
- Berengut et al. (2010) J. C. Berengut, V. A. Dzuba, and V. V. Flambaum, Phys. Rev. Lett., 105, 120801 (2010).