Development of a 30 cm-cube Electron-Tracking Compton Camera for the SMILE-II Experiment
Abstract
To explore the sub-MeV/MeV gamma-ray window for astronomy, we have developed the Electron-Tracking Compton Camera (ETCC), and carried out the first performance test in laboratory conditions using several gamma-ray sources in the sub-MeV energy band. Using a simple track analysis for a quick first test of the performance, the gamma-ray imaging capability was demonstrated with clear images and 5.3 degrees of angular resolution measure (ARM) measured at 662 keV. As the greatest impact of this work, a gamma-ray detection efficiency on the order of was achieved at the sub-MeV gamma-ray band, which is one order of magnitude higher than our previous experiment. This angular resolution and detection efficiency enables us to detect the Crab Nebula at the level with several hours observation at balloon altitude in middle latitude. Furthermore, good consistency of efficiencies between this performance test and simulation including only physical processes is very important; it means we achieve nearly detection of Compton recoil electrons and means that our predictions of performance enhancement resulting from future upgrades are more realistic. We are planning to confirm the imaging capability of the ETCC by observation of celestial objects in the SMILE-II (Sub-MeV gamma ray Imaging Loaded-on-balloon Experiment II). The SMILE-II and following SMILE-III project will be an important key of sub-MeV/MeV gamma-ray astronomy.
keywords:
Gamma telescopes; Imaging spectroscopy; Gaseous imaging and tracking detectors; Balloon instrumentation1 Introduction
The Sub-MeV/MeV gamma-ray window is one of the most interesting frontiers for both of multi-wavelength and nuclear gamma-ray astrophysics. There still remain many unobserved celestial objects such as black hole candidates, gamma-ray bursts (GRBs), supernove remnants (SNRs), gamma-ray pulsars, active galactic nuclei (AGNs), and so on. However, sufficient observation has not yet been achieved due to difficulties of gamma-ray imaging and rejection of huge backgrounds. Until now, only several tens of celestial objects emitting MeV gamma rays have been reported by COMPTEL [1], whereas Fermi-LAT found 1873 sources emitting sub-GeV/GeV gamma rays during the first 24 months of the all-sky survey [2].
In order to explore sub-MeV gamma-ray astronomy, we have developed an Electron-Tracking Compton Camera (ETCC) consisting of a gaseous Time Projection Chamber (TPC) and pixel scintillator arrays (PSAs). In comparison with a COMPTEL-type legacy Compton camera, the ETCC measures three additional physical parameters by obtaining the three dimensional track of the Compton recoil electron. Knowing the direction of the recoil electron makes it possible to reconstruct the direction of the incident gamma-ray event by event, and the energy loss rate (dE/dx) of the charged particle provides efficient background rejection.
Previously, we carried out the first balloon-borne experiment (SMILE-I) in 2006 using a small size ETCC with a cm3 TPC, and we successfully observed diffuse cosmic and atmospheric gamma-ray spectra with efficient background suppression [3]. To improve gamma-ray sensitivity, we had developed and tested a prototype ETCC with a (30 cm)3 size TPC [4]. More recently, we have started construction of the next balloon flight ETCC system (SMILE-II) with a (30 cm)3 TPC and completely upgraded the data acquisition system (DAQ). The SMILE-II experiment is aimed to demonstrate the gamma-ray imaging capability of the ETCC by observing bright celestial gamma-ray point sources such as the Crab Nebula or Cygnus X-1. We are now planning one day balloon flights at middle latitude in the northern hemisphere. After the completion of the SMILE-II experiment, our system will be upgraded for balloon flights around the polar regions, SMILE-III. These experiments are milestones to a satellite-based all-sky survey for an unexplored frontier of astronomy. Here, we report results of the first performance test of the current SMILE-II ETCC with a simple analysis.
2 Detectors: Electron-Tracking Compton Camera
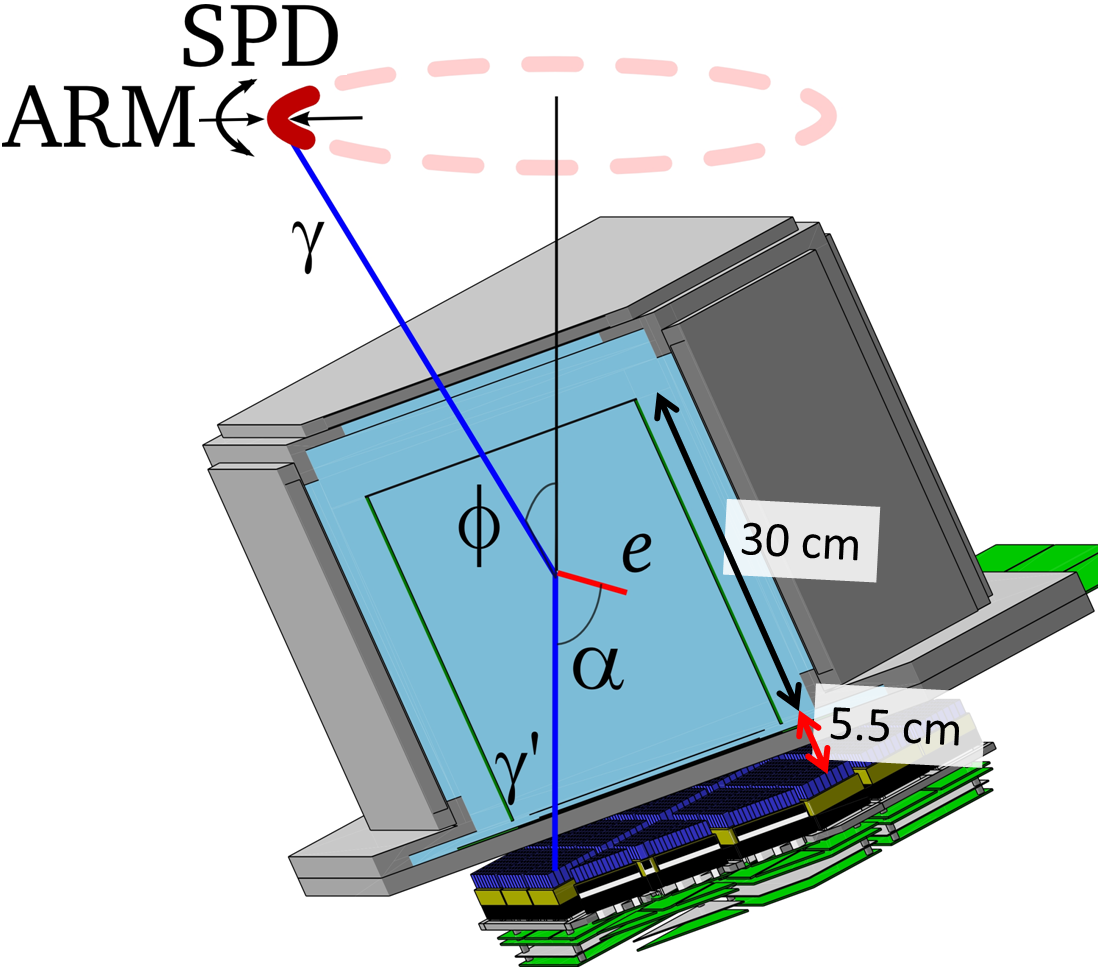
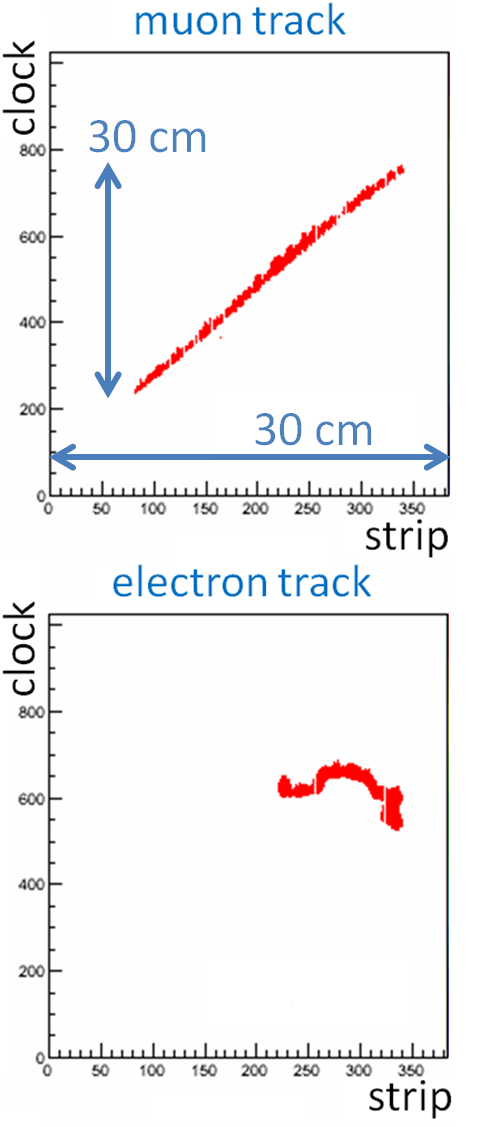
An electron-tracking Compton camera (ETCC), which is shown in the left panel of Fig. 1, consists of a gaseous Time Projection Chamber (TPC) and pixel scintillator arrays (PSAs). An incident gamma ray is Compton scattered by an orbital electron of a gas molecule in the TPC, and the TPC measures the track of the Compton recoil electron and its energy. The TPC has a two-directional strip-readout type position sensor known as the -PIC [5] which measures lateral (x and y-axis) information of particle tracks amplified by a gas electron multiplier (GEM [6]), and the remaining vertical depth (z-axis) is determined by the clock count of the signals of down-drifting ionized electron cloud. The track of a charged particle is obtained as two two-dimensional projected images which reflect hit strips and depth information. Examples of a measured muon and electron track are shown in the center panels of Fig. 1. The Compton scattering position and the initial direction of the recoil electron are obtained by analysis of the track. In addition, the Compton scattered gamma ray is absorbed by the PSAs, which measure the absorption position and the energy. The combination of TPC and PSA data enables us to measure all of the parameters of the Compton scattering kinematics, allowing both the energy and the arrival direction of an incident gamma ray to be reconstructed using the ETCC.
 |
 |
 |
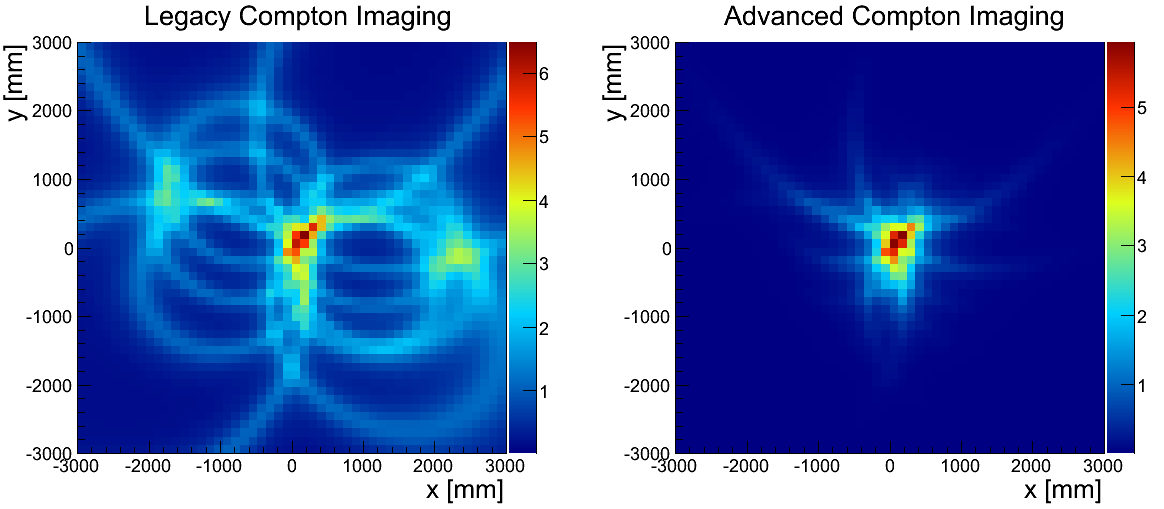
Measurement of the electron track gives unique and significant advantages to the Compton camera. At first, the reconstructed gamma-ray direction is determined as a point in the sky. The shape of directional uncertainty of an event is constrained to a crescent shape. This shape is made by a combination of the resolution of the Compton scattering angle (angular resolution measure, ARM) and directional angular resolution of the Compton scatter plane (scatter plane deviation, SPD). In the case of a COMPTEL-type legacy Compton camera which has no electron track information, the incident gamma ray is reconstructed as a ring on the sky, with a doughnut-shaped directional uncertainty. Examples of imaging with and without electron tracks are shown in Fig. 2. There are some artifact peaks in the legacy Compton image, while such artifacts disappear with our advanced Compton imaging technique.
Furthermore, the combination of the pulse height and the range of track information enables us to measure the energy loss rate (dE/dx) of charged particles in the TPC, which provides efficient background rejection. By using dE/dx, fully-contained electrons stopping in the TPC are discriminated from other charged particles such as MIP-like high energy electrons, cosmic muons, protons, and so on. There also remains one unused measured parameter which can be used for background rejection or improvement of reconstruction accuracy. For background rejection, the angle between the directions of the recoil electron and the scattered gamma ray is used to check the Compton scattering kinematics. This check rejects non-Compton scattering events such as chance coincidence hits of the TPC and PSAs, and events where Compton scattering occurred in the PSAs. Background rejection techniques using track information, dE/dx and angle selection, are a unique method for effective background suppression for observations of continuum gamma-ray sources. For the improvement of reconstruction accuracy, we can search the most likely set of measured parameters in the ranges of their uncertainty, but this topic is beyond the scope of this article.
2.1 Status of the current SMILE-II ETCC
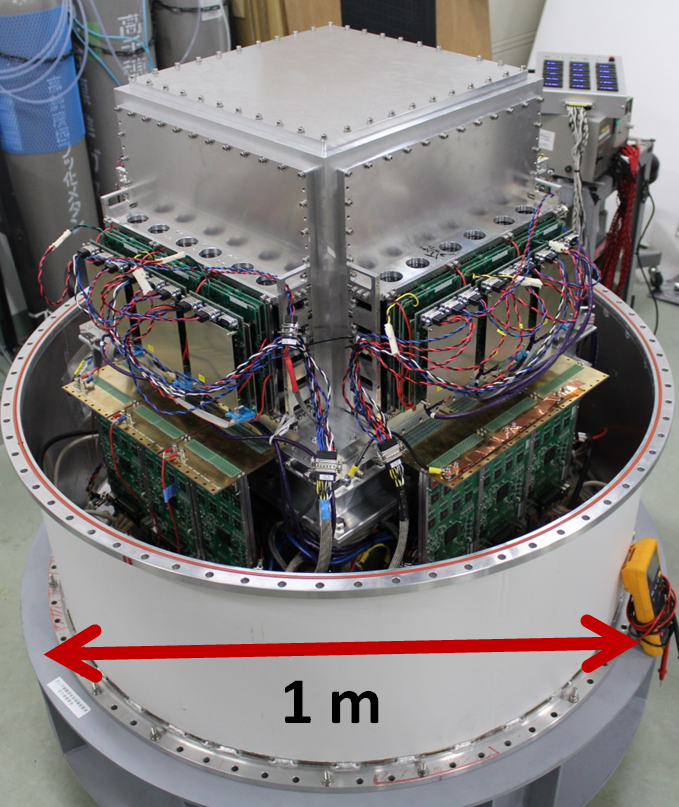
We have developed a 30 cm-cube size ETCC as the flight model detector of SMILE-II. The right panel of Fig. 1 is a photograph of the flight model ETCC in the bottom half cup of the pressure vessel. The ETCC consists of the 30 cm-cube TPC and 108 PSAs of GSO crystal. The TPC and 36 PSAs placed under the bottom of the TPC have been installed to the system. The other 72 PSAs around the four lateral sides of the TPC will be installed in the system soon. To improve the data quality of the electron track, dead time ratio, power consumption, and overall weight of the instrument, we have fully replaced the DAQ system from SMILE-I [3] and the prototype 30 cm-cube size ETCC [4]. Current detector parameters are summarized in the Table 1.
| TPC | TPC size | cm3 |
| Gas | Ar:iso-C4H10:CF4 = (95:2:3), 1 atm. | |
| Drift velocity | cm/s | |
| -PIC readout fineness | 800 m pitch, 100 MHz frequency | |
| Pulse height sampling | 50 MHz FADC (Sum of 32 strips) | |
| Energy resolution (FWHM) | 22 % (@ 22 keV) | |
| PSAs | Scintillator | GSO:Ce (6.71 g/cm3) |
| Pixel size | mm3 | |
| Dynamic range | 80 keV–1.3 MeV | |
| Energy resolution (FWHM) | 10 % (@ 662 keV) |
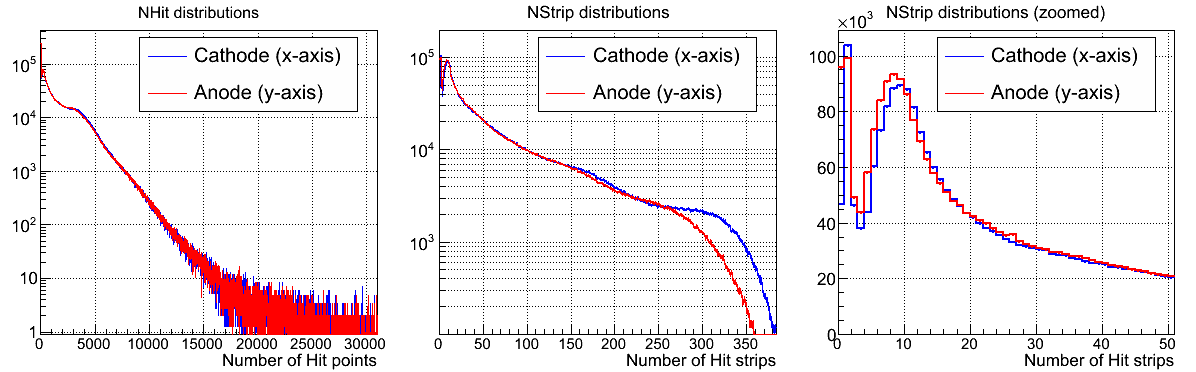
As a result of the DAQ upgrade, the quality of the tracks is dramatically improved, and the number of hit points and strips in the obtained track images are increased by more than one order of magnitude compared to the old systems. These hit number spectra are shown in Fig. 3. Details of the current DAQ concept and hardware appear in S. Komura et al. [7] and T. Mizumoto et al. [8].
 |
 |
2.2 Simple analysis of electron track
The Compton scattering position and direction of the recoil electron are determined by track analysis of the TPC data. The track data are obtained as two two-dimensional images whose dimensional spaces are TPC clock (z-axis) versus -PIC strips (x or y-axis). At first, we reconstruct the three dimensional track from these two track images by simple off-line coincidence of the images in three dimensional space. Next, we make an image by projection of the obtained three dimensional track to the x-y plane. As the most simple analysis, we consider that the Compton scattering occurred in the hit pixel of the x-y image which is closest to the photo-absorbed position [7]. We also adopt the mean of hit clocks in this closest pixel as the z-axis position of the Compton scattering. The direction of the recoil electron is determined as a composite vector of the two gradients of the obtained track images, which are the x-z or y-z gradients of each of the two dimensional tracks. It is a rough track analysis for a quick test of the first performance of the ETCC.
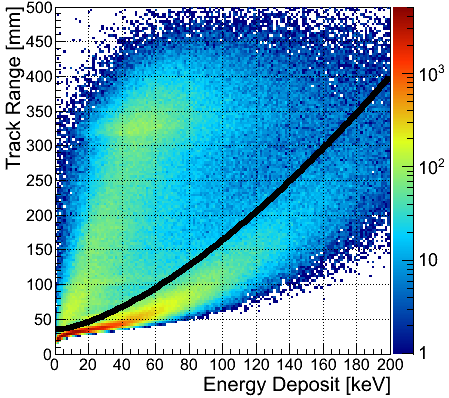
A measured dE/dx map is shown in Fig. 4. The map is beautifully divided into two components around the solid line. One is the fully-contained electrons stopping in the TPC which events are distributed in the high dE/dx area of the map. Another component is MIP-like charged particles, such as cosmic muons and high energy electrons escaping from the TPC. For the background rejection, we use the dE/dx cut criteria as following:
| (1) |
where is the energy deposit of a charged particle in the TPC, and the track range is determined by geometrical combination of the two two-dimensional tracks. This dE/dx criteria is drawn as the solid line in the left panel of Fig. 4.
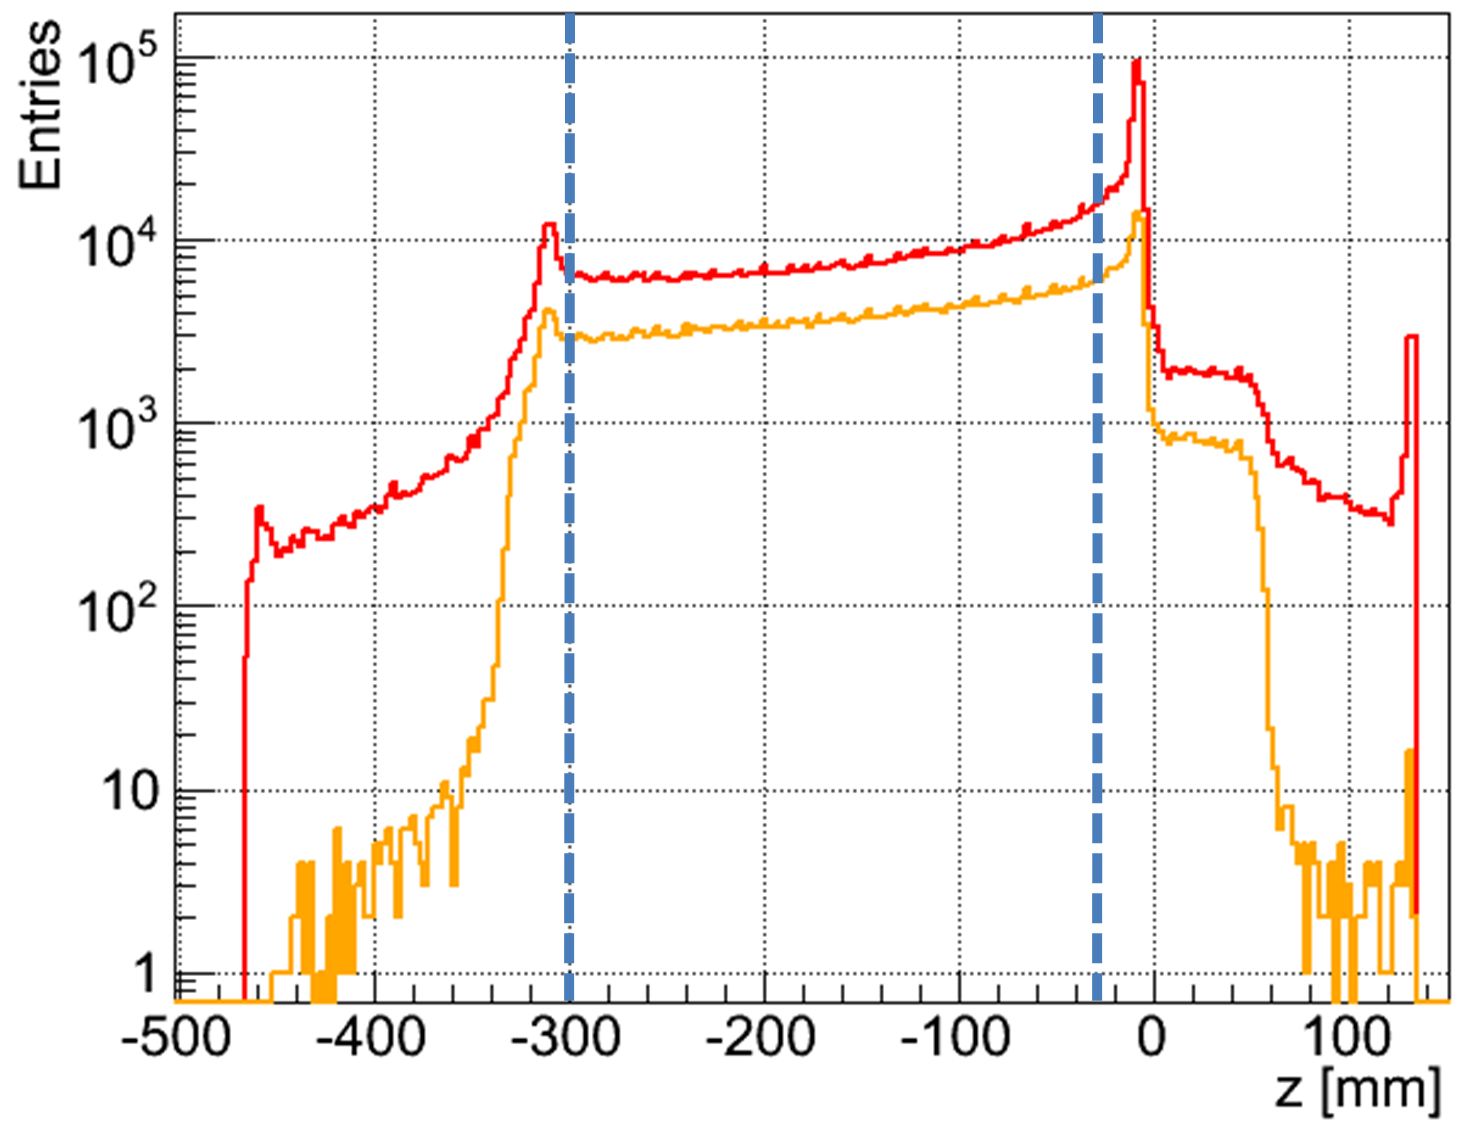
The analyzed starting positions of the measured tracks (i.e., the Compton scattering position) along the z-axis, both before and after the dE/dx selection, are drawn in the right panel of Fig. 4. The drift plane, GEM, and -PIC of the TPC are located at , , and mm, respectively. Events scattered on the inside of the TPC are reduced by about a factor three by the dE/dx cut. Otherwise, events scattered outside of the TPC are greatly reduced by about two orders of magnitude. The latter is considered as chance coincidence noise, therefore the dE/dx selection has efficient background rejection capability. In addition, we defined the fiducial volume region as for valid Compton scattering position in the following analysis. We also use x-axis and y-axis fiducial cuts to avoid distortion of electrical field in the TPC. Thus, the current aperture ratio of the x-y fiducial area to the full -PIC size is about 0.57. Although this loss has a large effect for current performance of detector, the principal cause has already been identified as being due to the positions of the support posts of the drift-cage, and will be fixed soon by changing the post positions. Moreover, we cut events with a reconstructed direction of the zenith angle larger than 90 degrees. Details of the reconstruction method of direction is written in A. Takada et al. [3].
3 Results of performance test
Here, we show results of the first performance test of the 30 cm-cube ETCC by using gamma-ray sources of 139Ce (166 keV), 133Ba (356 keV), 22Na (511 keV), and 137Cs (662 keV).
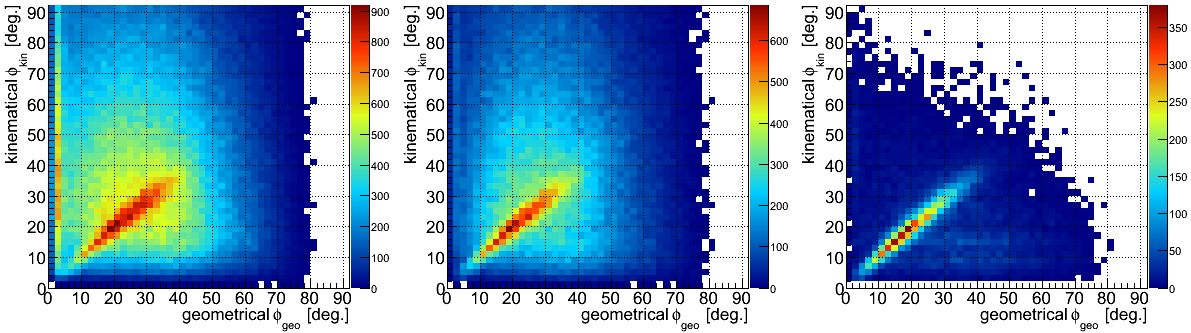
Fig. 5 shows the relation maps of the Compton scattering angle , determined both kinematically and geometrically, under 662 keV gamma-ray irradiation. The kinematical scattering angle is derived from the sum and ratio of energies of the recoil electron and the scattered gamma ray. The geometrical scattering angle is determined from the recoil electron direction and Compton scattering position with the assumption of the gamma-ray source direction. The appearance of the correlation in each of these maps is evidence of the detection of source-derived gamma rays. Moreover, the background component is clearly suppressed by the dE/dx selection. By using the energy selection window of 662 keV , environmental room gamma-ray backgrounds and the component scattering outside of the TPC are suppressed.
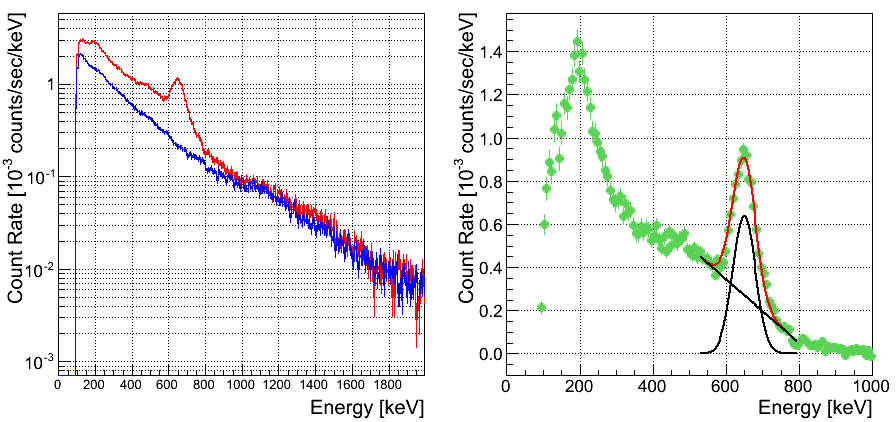
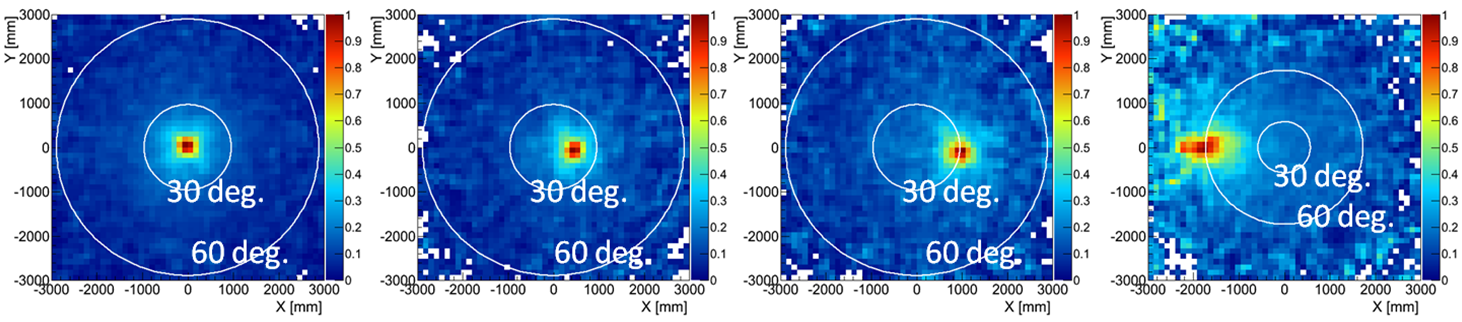
The Observed energy spectra after event selections are shown in Fig. 6. The line peak of 662 keV gamma rays from the 137Cs is found in the background-subtracted spectrum. The energy resolution is measured to about at 662 keV, which is defined as FWHM of the fitted Gaussian function. Simple backprojection images of the 137Cs gamma-ray source at zenith angles of 0, 15, 30, and 60 degrees are drawn in Fig. 7. The source is found at the expected position in the all of these images. It shows that the ETCC has a field of view wider than .
Angular resolution parameters of the Compton camera, ARM and SPD distributions, are also evaluated by using gamma-ray checking sources. The ARM distribution measured with the 662 keV gamma-ray source at the center of field of view is well explained by a Lorentzian function with FWHM of 5.3 degrees. The SPD distribution under same conditions as the above with the additional event selection of degrees is explained by a combination of a Gaussian function with FWHM of 200 degrees and a constant. The primary peak component of the point spread function (PSF) is dominated by the ARM resolution, while the SPD resolution dominates the outer tail component of the PSF. This good ARM resolution fulfills the requirement of less than 10 degrees for SMILE-II.
We also carried out a test of gamma-ray detection efficiency of the current SMILE-II ETCC, and we have achieved efficiencies on the order of for the sub-MeV energy range. This good performance is about one order higher than the previous SMILE-I type ETCC. Furthermore, our obtained efficiencies for a few hundred keV band are consistent within with the simulation which takes into account only physical processes [9]. It means almost all of the fully-contained Compton recoil electrons are detected by the TPC. Thus, our simulation of performance enhancements for upgrades of the detector, such as scintillator materials and its radiation length, layout design of PSAs, fiducial volume of the TPC, gas blending ratio and its pressure in the TPC, can be considered more reliable.
4 Summary
We have developed the SMILE-II flight model ETCC with 30 cm-cube size TPC, and we have carried out the first performance test at the room condition by using several gamma-ray sources in the sub-MeV energy range. Now, we use a simple analysis of the track for a quick test of the performance. The gamma-ray imaging capability is demonstrated by clear images of gamma-ray sources, even at the edge region of the field of view at 60 degrees from the center. Therefore, we confirmed the width of the field of view as about 3 sr. The angular resolution, FWHM of ARM distribution, is determined as 5.3 degrees for 662 keV gamma rays. Gamma-ray detection efficiencies are achieved to the order of in the sub-MeV energy range. This good performance is about one order of magnitude better than the previous SMILE-I type ETCC. Good consistency of efficiencies between this performance test and physical process simulation is very important as we obtain a dependable prediction method of performance enhancements of detector upgrades.
With the combination of efficiencies and angular resolutions obtained here, the Crab Nebula or Cygnus X-1 can be detected by our ETCC with a significance above the statistical level in several hours observation in a one day balloon flight experiment at middle latitude. We are going to confirm the sub-MeV gamma-ray imaging capability of the ETCC for celestial objects by the SMILE-II experiment. The SMILE-II experiment and following SMILE-III project will be an important key to the progress of sub-MeV/MeV gamma-ray astronomy.
Acknowledgements.
This work was supported by a Grant-in-Aid in Scientific Research from the Japan Ministry of Education, Culture, Science, Sports and Technology. This work was also supported by research fellowships for young scientists from the Japan Society for the Promotion of Science (JSPS). Some of the electronics development was supported by the Open-It consortium.References
- [1] V. Schnfelder et al., The first COMPTEL source catalogue, \hrefhttp://dx.doi.org/10.1051/aas:2000101 Astron. Astrophys. Suppl. Ser. 143 (2000) 145.
- [2] P. L. Nolan et al., Fermi Large Area Telescope Second Source Catalog, \hrefhttp://dx.doi.org/10.1088/0067-0049/199/2/31/ Astrophys. J. Suppl. Ser. 199 (2012) 31.
- [3] A. Takada et al., Observation of Diffuse Cosmic and Atmospheric Gamma Rays at Balloon Altitudes with an Electron-Tracking Compton Camera, \hrefhttp://dx.doi.org/10.1088/0004-637X/733/1/13/ The Astrophysical Journal 733 (2011) 13.
- [4] K. Ueno et al., Development of the balloon-borne sub-MeV gamma-ray Compton camera using an electron-tracking gaseous TPC and a scintillation camera, in proceedings of The 9th International Conference on Position Sensitive Detectors, Sep., 12–16, 2011, Aberystwyth, U.K., \hrefhttp://dx.doi.org/1748-0221/7/01/C01088/ \jinst72012C01088.
- [5] A. Ochi et al., A new design of the gaseous imaging detector: Micro Pixel Chamber, \hrefhttp://dx.doi.org/S0168-9002(01)00996-2 Nucl. Instr. Meth. A 471 (2001) 264.
- [6] F. Sauli, GEM: A new concept for electron amplification in gas detectors, \hrefhttp://dx.doi.org/10.1016/S0168-9002(96)01172-2 Nucl. Instr. Meth. A 386 (1997) 531.
- [7] S. Komura et al., Performance Improvement of an Electron-Tracking Compton Camera by a New Track Reconstruction Method, in proceedings of 2013 IEEE Nucl. Sci. Symposium, Oct. 27–Nov. 2, 2013, Seoul, Korea, IEEE Nucl. Sci. Symp. Conf. Rec., in press.
- [8] T. Mizumoto et al., Precise Low-Energy Electron Tracking Using a Gaseous Time Projection Chamber for the Balloon-borne Gamma Ray Compton Telescope, in proceedings of 2013 IEEE Nucl. Sci. Symposium, Oct. 27–Nov. 2, 2013, Seoul, Korea, IEEE Nucl. Sci. Symp. Conf. Rec., in press.
- [9] T. Sawano et al., SMILE-II: Balloon-borne Telescope for Background-suppressed Soft Gamma-ray Imaging, in proceedings of The 12th Asia Pacific Physics Conference, July, 14–19, 2013, Chiba, Japan, J. Phys. Soc. Japan Suppl. Ser., in press.