Version 01 as of
Primary author: Lin F. Yang, Physics
Comment to lyang@pha.jhu.edu
The Dark Matter Contribution to Galactic Diffuse Gamma Ray Emission
Abstract
Observations of diffuse Galactic gamma ray emission (DGE) by the Fermi Large Area Telescope (LAT) allow a detailed study of cosmic rays and the interstellar medium. However, diffuse emission models of the inner Galaxy underpredict the Fermi-LAT data at energies above a few GeV and hint at possible non-astrophysical sources including dark matter (DM) annihilations or decays. We present a study of the possible emission components from DM using the high-resolution Via Lactea II N-body simulation of a Milky Way-sized DM halo. We generate full-sky maps of DM annihilation and decay signals that include modeling of the adiabatic contraction of the host density profile, Sommerfeld-enhanced DM annihilations, -wave annihilations, and decaying DM. We compare our results with the DGE models produced by the Fermi-LAT team over different sky regions, including the Galactic center, high Galactic latitudes, and the Galactic anti-center. This work provides possible smooth component templates of DM to fit the observational data. The subhalo contributions can be considered to provide statistically meaningful templates, and demonstrate how spatial profiles are significantly modified according to different annihilation/decay scenarios. We argue that a subhalo-based approach can help constrain the DM physics.
pacs:
95.35.+dI Introduction
Overwhelming observational evidence (Frenk and White, 2012) implies the existence of dark matter (DM), whose nature is still unknown. Searching for DM is now a major research theme in both particle physics and astrophysics. The former mainly focusses on direct detection by experiments sensitive to the interaction of DM particles with normal matter, while the latter uses indirect methods, including measurements of the end products of DM annihilation/decay (e.g. -ray, pairs) or mapping of gravitationally lensed structures. A number of particle physics scenarios have been proposed for the nature of DM. Among these scenarios, the most compelling is that of the weakly interacting massive particle (WIMP) that acts as cold dark matter and effectively explains the origin of the large-scale structure of the universe. Theories generally hypothesize WIMPs that interact with normal matter no more strongly than the weak force and therefore direct observation is challenging.
If DM is a form of a thermal relic particle that was once in thermal equilibrium in the very early universe, then it may light up Galactic substructures by self-pair annihilations. In addition, DM decay products may also be a source that is comparable to annihilation. The absolute -ray intensity depends on the WIMP annihilation cross section or decay rate, particle type, particle mass, and astrophysical distributions, all of which are poorly known. The relative annihilation/decay luminosity is density-dependent, which may offer insight into the nature of DM, e.g. the decay signal is proportional to density while the annihilation luminosity is proportional to density squared. Additional correction factors may be applied to the standard velocity-weighted thermal cross section . One example is the Sommerfeld boost – a nonperturbative increase in the annihilation cross-section at low velocities that is the result of a generic attractive force between the incident DM particles. Baryons could also play an important role in determining the profiles of DM halos. Adiabatic contraction induced by the infall of baryonic matter could steepen the DM density profile substantially, e.g. to from a Navarro-Frenk-White (NFW) (Navarro et al., 1996) profile (Freese et al., 2009). Another possible correction to the annihilation cross-section that has not been previously discussed in the galactic context is that of -wave suppressed annihilations, as might be important for spin-dependent interactions.
Diffuse galactic -ray emission (DGE) is believed to be produced by interactions between cosmic rays and the interstellar medium (ISM). The launch of the Fermi Gamma-ray Satellite, with its Large Area Telescope (LAT), enabled a detailed study of cosmic-ray origin and propagation, and of the interstellar medium. In a recent study (Ackermann et al., 2012a), the Fermi-LAT team published an analysis of the measurements of the diffuse -ray emission from the first 21 months of the Fermi mission. They compared the data with models generated by the GALPROP111http://galprop.stanford.edu/ code, and showed that these emission templates underpredict the Fermi-LAT data at energies of a few GeV in the inner galaxy. This can possibly be explained by undetected point-source populations and variations of the cosmic ray spectra. Ackermann et al. (2012b) have performed an analysis of the DGE in the Milky Way halo region to search for a signal from dark matter annihilations or decays. They considered a large region covering the central part of the Galactic halo while masking out the Galactic plane. In such a region, the DM signal would have a large S/N ratio and would not depend on detailed assumptions about the center profile, e.g. the assumptions of a NFW profile or a cored profile would only differ by a factor of . This paper provided conservative limits on the DM cross-section assuming that all the -ray signal comes from DM in this region. They also provided more stringent limits based on modeling the foreground -ray signal with the GALPROP code. Their results impact the possible mass range over which DM is produced thermally in the early universe and challenge the DM annihilation interpretation of PAMELA/Fermi-LAT cosmic ray anomalies. However, several points could be improved: 1) although using a NFW profile for modeling pure DM and a cored profile for modeling the baryonic matter effect covers extreme cases, it is still worth trying a more realistic profile directly from simulations; 2) in addition to the mass and cross-section of the DM particle, the different annihilation/decay schemes may also play an important role, e.g. subhalo effects would become considerably strong in the region of interest where tidal disruption plays a role and especially when considering possible Sommerfeld enhancements; and 3) instead of detecting DM signal from the region that masks out the Galactic Center region, it may be of interest to search for a possible signal from the center or anticenter regions. Therefore, a good template for the Galactic Center or the full sky should provide more constraints on the DM physics; 4) the spatially dependent velocity dispersion of the DM due to substructure plays an important role both in considering Sommerfeld or wave enhanced annihilation signals, and simulations can provide this information.
The contribution of DM annihilation/decay processes to the Fermi-LAT -ray signal in the Galactic Center (or its expected signal from subhalos in the Galactic halo) is difficult to quantify without knowing the galactic distribution of dark matter and the dark matter particle properties leading to annihilations or decays. To compare the observations with predictions of DM emission, we must rely on numerical simulations that follow the formation of cosmic structure in the highly non-linear regime. A few high-resolution simulations of Milky Way-sized halos have been completed over the last few years: the Aquarius project (Springel et al., 2008a), the Via Lactea series (Diemand et al., 2008), and the GHALO run (Stadel et al., 2009). The ability of the Fermi-LAT satellite to detect DM annihilation signals from Galactic subhalos has been previously studied by Anderson et al. (2010) and Kuhlen et al. (2008) using the high-resolution Via Lactea II (VLII) N-body simulation. To date, there has been no clear signal of dark matter annihilations or decays in the outer galactic halo. There are numerous possible explanations for non-detection in the outer galactic halo combined with the observed DGE in the Galactic Center, including simulated DM-only structure being inconsistent with the actual galactic structure, the predicted DM annihilation/decay luminosity from particle physics being overly optimistic, or some misunderstanding of the observational data. Motivated by the range of possible explanations for the excess of DGE data to the model, we present a study of various possible Galactic DM contributions to the observed DGE emission. We construct several maps of gamma-ray emission from different DM annihilation/decay scenarios in order to illustrate how each scenario may offer additional templates to fit the Fermi data. We additionally compared DM annihilation signals in each scenario to the DGE model from the GALPROP code of Ackermann et al. (2012a) in different regions on the sky.
We organize the rest of this paper as follows: in II, we give a description of different DM annihilation/decay schemes. Our data processing method and -ray generating algorithm are described in III. We show how we add our correction to the normal annihilations/decays in IV. The all-sky maps results and comparisons to Fermi data for different sky regions are presented in §V. Conclusions and discussion are presented in §VI.
II DARK MATTER ANNIHILATION AND DECAY
Gamma-rays are one of the final products from DM self-annihilations or decays. In the case of annihilations, the -ray flux ( photons cm-2 sr -1s-1 ) in a solid angle d of a given line-of-sight can be written as
| (1) |
where is the velocity-weighted thermal cross section, which is usually treated as a constant, and is the density of DM at position , and is the distance from the DM particle to the observer. In the case of decay, the -ray intensity is then proportional to ,
| (2) |
where is the decay lifetime. Eqn-(1) and Eqn-(2) are usually written as a combination of a particle physics factor and an astrophysical factor , while we combined them as to indicate what has been considered in our -ray producing code. Since and are unknown, the normalization is arbitrary. For a given astrophysical DM distribution, the factors given here determine the relative intensity of the predicted flux. Calculating the absolute value of requires the absolute value of the particle physics parameters. As shown in several papers (Berlin and Hooper, 2013; Feng et al., 2010), is less than cm2s-1, and particle mass varies from 100 GeV to 10 TeV for the case of WIMPs. For our purpose, only the relative intensity is needed. The -ray maps in this work are produced from the simulation data (see §III) by using one of these formulae in addition to possible cross-section correction factors. We consider in total six different -ray map production scenarios: (a) pure annihilation without any correction factors, assuming is a constant; (b) annihilation with a Sommerfeld enhancement of included in the annihilation cross section ( is the relative velocity of the annihilating particles); (c) annihilation with a Sommerfeld enhancement of , as expected near resonance; (d) annihilation proportional to consistent with wave channel suppression ; (e) adiabatic contraction to the dark matter density profiles, and (f) pure decay, taken to be linear in dark matter density. The correction cases are described in IV.
III SIMULATION DATA AND MAP PRODUCTION ALGORITHM
The Via Lactea series includes some of the highest resolution collisionless simulations of the assembly of a Milky Way-sized halo. VLI, the first of the series, contains DM particles, covering the virial volume and surroundings of a host halo of . The host halo and subhalo properties are presented in Diemand et al. (2007a), Diemand et al. (2007b), and Kuhlen et al. (2007). For this work, we used the second generation of the simulation series, the VLII run (Diemand et al., 2008; Kuhlen et al., 2008), which has a slightly higher resolution. It employs about 1 billion particles each of mass to simulate a Milky-Way-sized host halo and its substructures. We extract the roughly particles of the snapshot within ( kpc, the radius where the density is 200 times larger than the critical density ) of the host halo. About individual subhalos have been identified in this region. The halos found within show considerable self-similarity. An NFW-like profile fitting to the density could be generalized by,
| (3) |
Diemand et al. (2008), fixes , and gives the best-fitting parameters , kpc and pc-3. The host halo is not spherically symmetric but is ellipsoidally shaped. The detailed host halo properties can be found in Diemand et al. (2008).
To produce the -ray maps, we follow Kuhlen et al. (2008) and locate a fiducial ‘observer’ 8 kpc from the host halo center along the intermediate principle axis of the ellipsoid. Given the position of an observer, the density field of each particle can be represented by a Dirac- function. Eqn-(1) and (2) can be rewritten as the summation of flux over each particle, i.e. . For annihilation, ; and decay, , where is the distance from the particle to the observer. To avoid shot noise, we smoothed the particles with a SPH kernel so that each particle is represented by a sphere of radius instead of a point. The flux , correspondingly, spreads out as a Gaussian on the sky. We computed , and (the velocity dispersion) by finding the volume encompassing the nearest 32 particles (using the code SMOOTH). The velocity dispersion is read out simultaneously from this process.
Our final result for the omnidirectional -ray signal has been calculated using HEALPIX (Górski et al., 2005). We use a NSIDE=512 to model the angular resolution of Fermi-LAT (roughly 0.2∘). This is an extremely compute-intensive task, it takes more than 8 hours on a regular CPU to produce a single map with the 400M particles. In order to be able to create the maps involving the different annihilation scenarios and different viewpoints, we have developed a novel GPU-based algorithm(Yang and Szalay, 2013).
In this method, we projected onto two separate tangential planes of the two celestial hemispheres using stereographic projection, then remapped these to the final HEALPIX projections. We have realized that the problem can be reduced to rendering a projected density profile of a particle, weighted by different factors depending on the physics of the annihilation. As these computations became quite similar to those used in visualization, we were able to implement them in the shader language of OpenGL (Open Graphics Library) on a high-end Nvidia GPU for maximum performance. As a result, we are able to render the projected profiles at a rate of more than 10M particles per second and hence build a map in 24 seconds. This thousand-fold speedup was an essential factor, that enabled us to carry out the large number of numerical experiments needed to complete this paper.
Even with the high resolution of VLII, only a portion of the hierarchal structure of DM clumps is resolvable. In principle, the WIMP DM substructure has mass power all the way down to the mass of the DM kinetic or thermal decoupling scales, of order These unresolved structures will boost the final brightness of the -ray emission according to the dependence (while decay is not affected due to the dependence). Detailed studies of the boost factor can be found in Kuhlen et al. (2008); Anderson et al. (2010). Although as pointed out by Springel et al (Springel et al., 2008b) and Fornasa et al. (Fornasa et al., 2013) the unresolved subhalo component provides a important source of emission, Springel et al also note that this unresolved smooth component is quite flat (i.e. the contrast of the brightest and faintest points is only about 1.5). In practice, this component is unlikely to be distinguishable from other emission components. To include the emission of unresolved subhalos, we suggest that use of an all-sky uniform component would be an alternative solution. On the other hand, the boost factor is also highly model-dependent (e.g. Kamionkoski et al. (Kamionkowski et al., 2010)). In terms of simplicity and clarity, we choose to not include the boost factor calculation in this work, since we only care about the possible shapes of the profiles.
IV CORRECTIONS
IV.1 Sommerfeld Enhancement
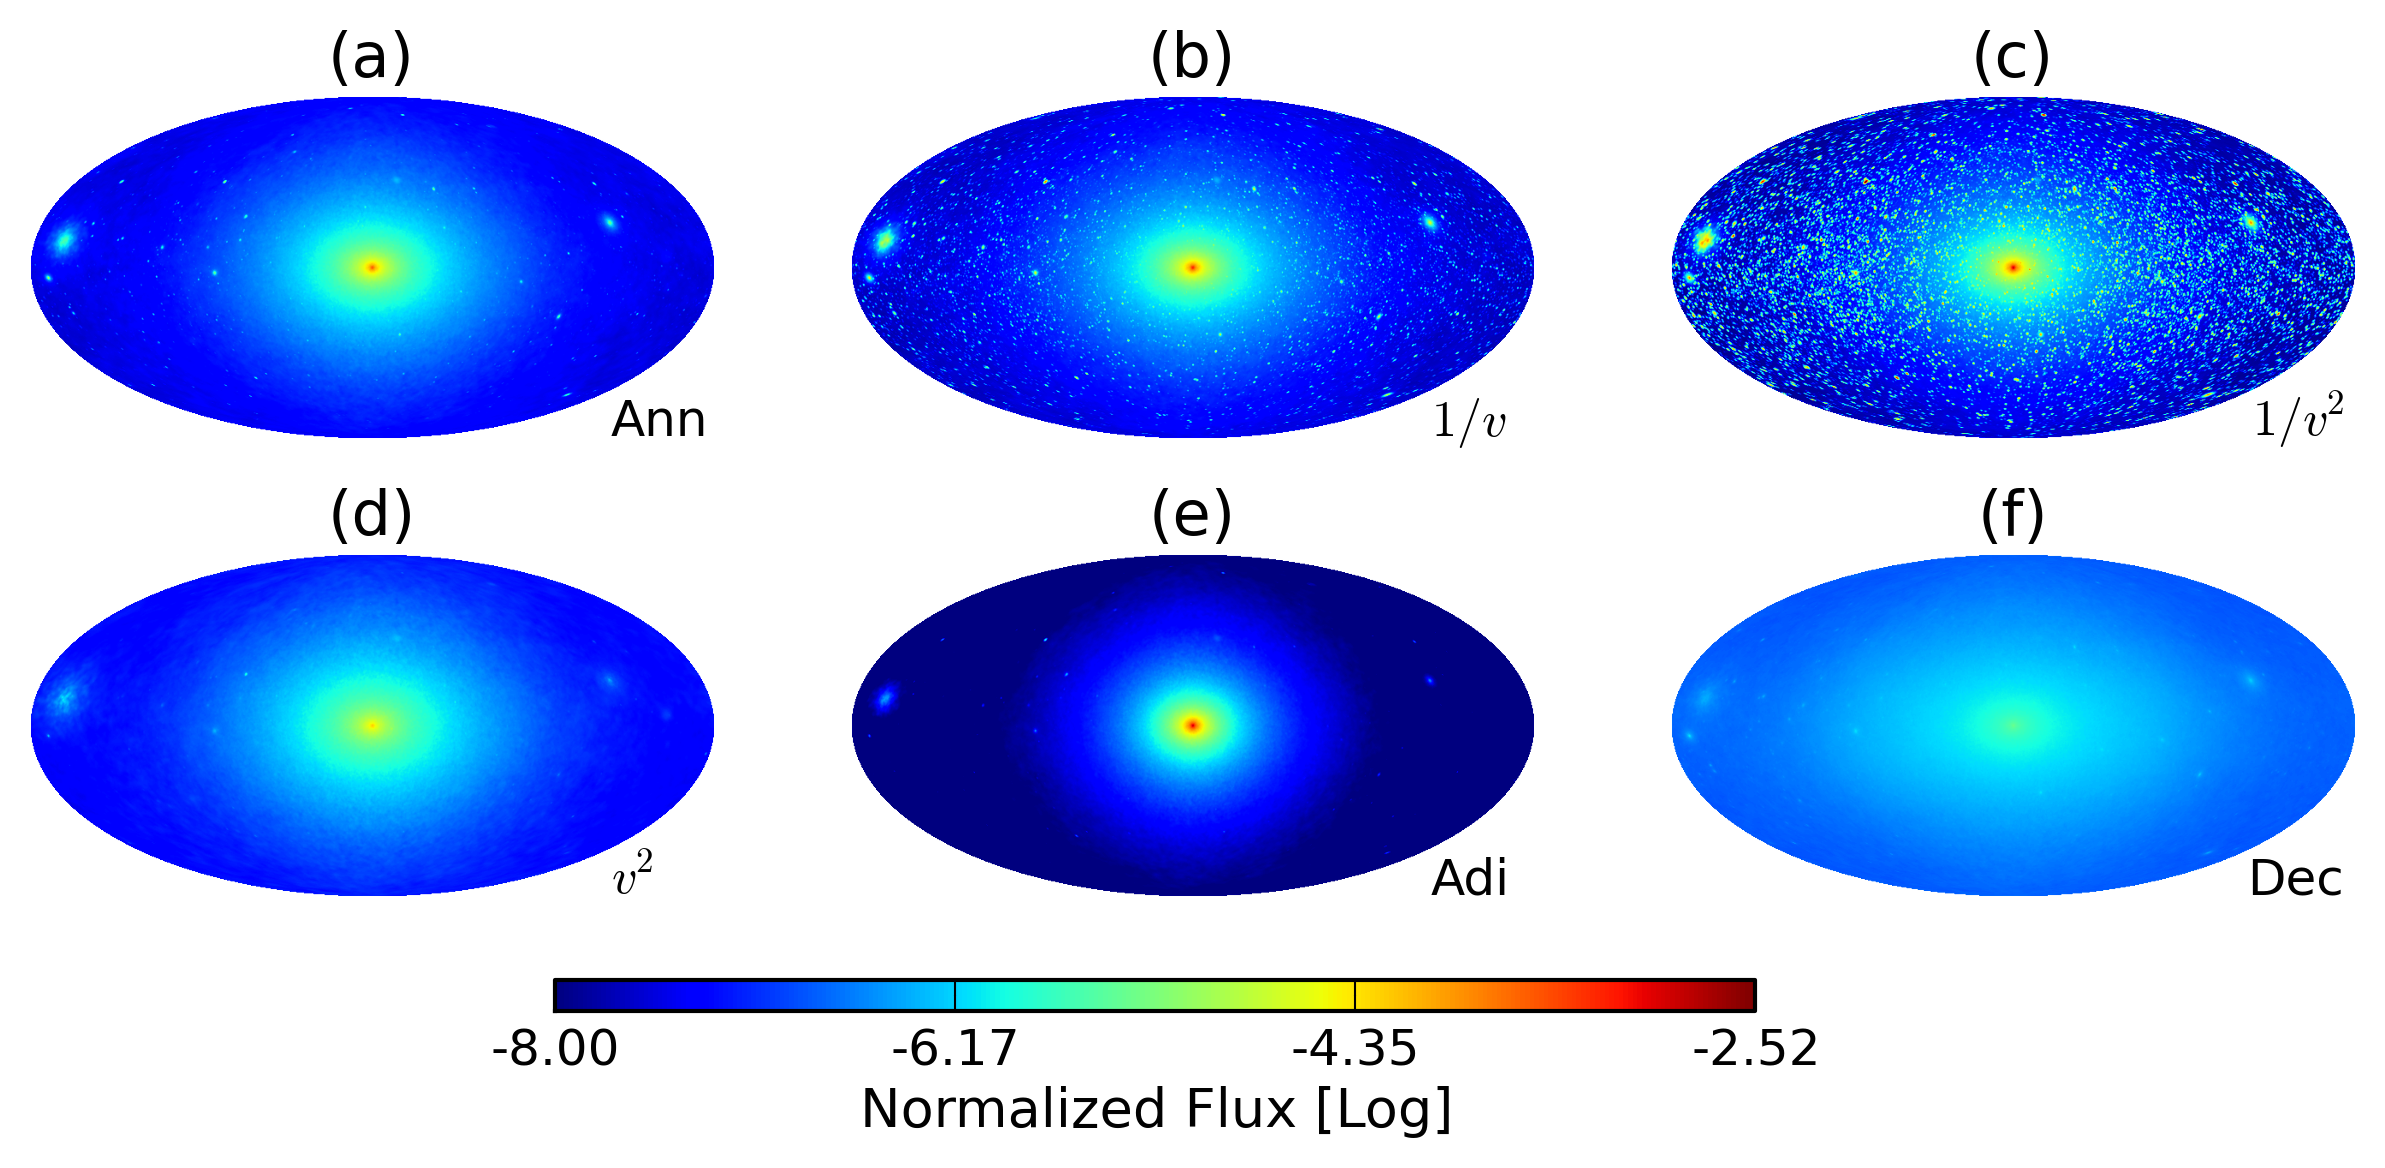
The PAMELA (Adriani et al., 2009) and AMS-02 results (Aguilar et al., 2013) show a rise in positron fraction at high energy and a hardening of the spectral index, while no antiproton excesses were found. If this signal were due to annihilation, the standard thermal cross-section would be too small to simultaneously fit and avoid antiproton excesses. To gain a larger cross-section, a force carrier (Feng et al., 2010; Lattanzi and Silk, 2009; Arkani-Hamed et al., 2009) is proposed for mediating the DM particle interaction. This mediator could be a standard model particle or an unknown boson responsible for dark sector forces. Assuming the DM particle is a Majorana or Dirac fermion, such a process is denoted as . The Sommerfeld enhancement (Sommerfeld, 1931) can be therefore calculated. For the resonance case (when , where is the coupling strength, and is an integer), this model gives an enhancement of to the cross-section. For the non-resonance case, . For , . The Sommerfeld cross-section must saturate in a viable model: we take this saturation to be km/s, above the resolution limit of our simulations. From our point of view, this amounts to a renormalisation that we ignore: it is the profile shape and clumpiness that we care about. The cross-section for DM particle pair annihilation changes significantly over the simulation range caused by velocity changes in different environments, i.e. by a factor or more (Kuhlen et al., 2009). In such a case, the subhalos, whose velocity dispersion is less than that of the central halo, light up. For the case, the substructures almost dominate, as shown in Fig-1(c).
To calculate an accurate Sommerfeld enhancement value at a given location, one needs the whole phase-space distribution of each particle. This is not possible for our case using the VLII simulation. We therefore follow Kuhlen et al. (2009) and assume a Boltzmann velocity distribution of the relative velocity :
| (4) |
The Sommerfeld enhancement is then given by . If has no saturation, then is then for the case and for the case. If one takes into consideration the saturation velocity , below which no longer increases, we find presents similar properties. We therefore approximate completely by without losing much accuracy. In our calculation, we calculated as or when , and as when . Here is the velocity dispersion mentioned in the last section. Fig-1 (b) and (c) shows the Sommerfeld enhancement case for the -ray map. To avoid the cross-section blowing up at very low velocity, we applied saturation velocities equal to 1 km/s for the case and 5 km/s for the case.
IV.2 p-wave annhiliation
As indicated in the Sommerfeld enhancement case, the relative velocity of particles varies significantly after thermal freeze out. If the cross-section is velocity-dependent, it will either suppress high velocity or low velocity annihilation. Constraints on annihilation processes from CMB and -ray observations could be considerably weakened if the wave channel were suppressed. wave annihilations are orders of magnitudes larger than wave annihilations at recombination and are an interesting case to be considered. For example, neutralino annihilation could be dominated by the wave process (Goldberg, 1983). In contrast to the Sommerfeld case, we consider an annihilation case whose wave process is suppressed. For the annihilation rate, we phenomenologically set , where for wave(wave) annihilation (Essig et al., 2013). Fig-1 (d) shows a map from the wave annihilation with the wave channel suppressed. More discussion will be given in §VI.
IV.3 Baryonic matter and adiabatic contraction
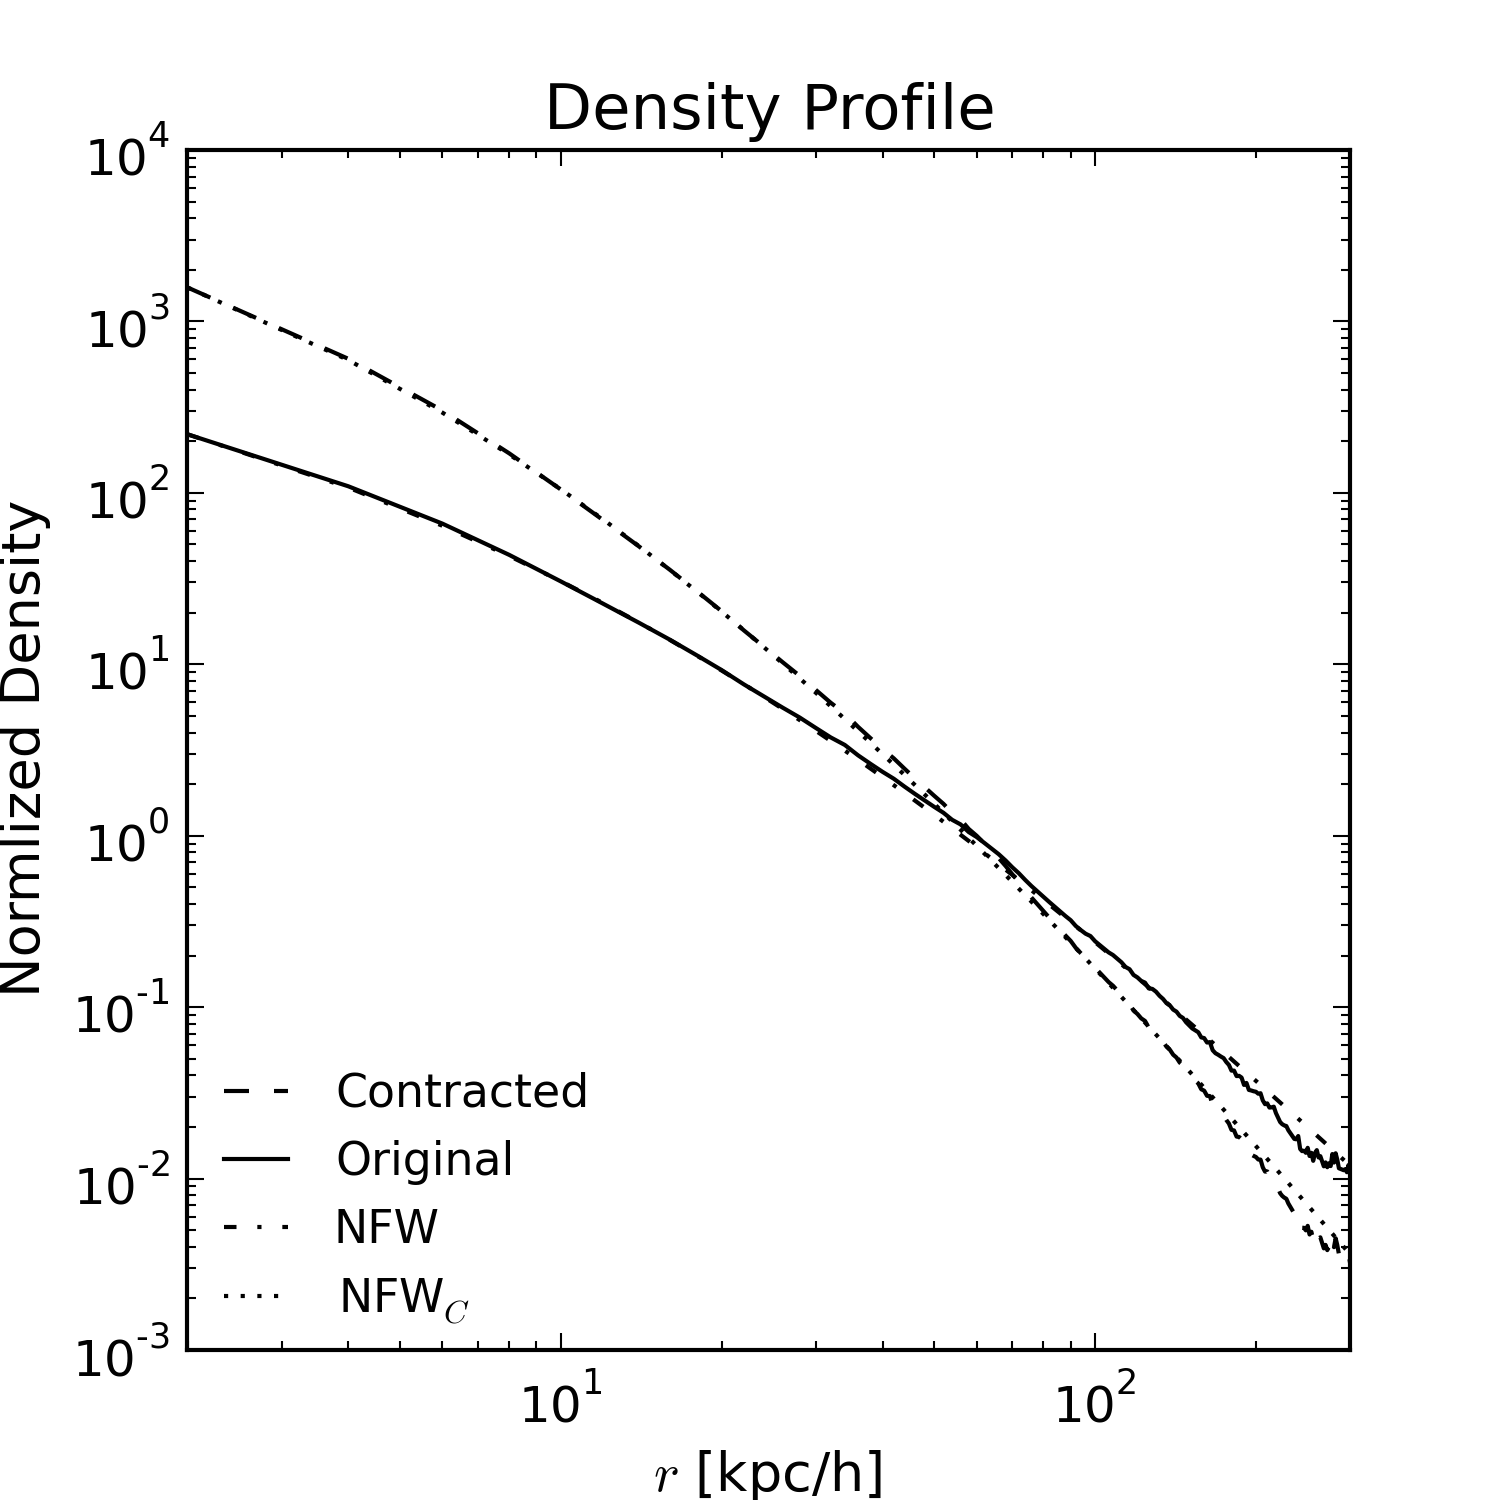
When structure is forming, baryonic matter dissipates its thermal and kinetic energy and falls to the center of the DM halo. The condensation of gas and stars in the inner regions of DM halos will adiabatically contract the DM density distribution and lead to a denser profile in the center. This effect is implied from both theoretical and observational studies (Gnedin et al., 2011). Adiabatic contraction is generally studied using the standard contraction model (SAC) as introduced by Blumenthal et al. (1986). However, hydrodynamic simulations show that the contraction is weaker and a modified adiabatic contraction model was introduced in Gnedin et al. (2004). We consider the baryonic matter contraction effect only in the host halo, where there is enough baryonic matter to cause the contraction. To simplify the calculation, we follow Gomez-Vargas et al. (2013a) and modify the host halo density profile to be a NFWc profile with , , and kpc. To conserve the the total mass of the host halo within , we use . We convolve a contraction factor with the density of each particle in the simulation. The mass of each particle is changed accordingly. The contracted density profile and the original profile are shown in Fig-2. We normalized the profile such that the intersection point of the original and the contracted profile is at a density of . We include the NFW and NFWc profile in Fig-2 as points of comparison. Fig-1 (e) shows an annihilation map of the contracted host halo plus uncontracted subhalos.
V ALL-SKY MAPS AND GAMMA-RAY SIGNALS FROM DIFFERENT SKY REGIONS
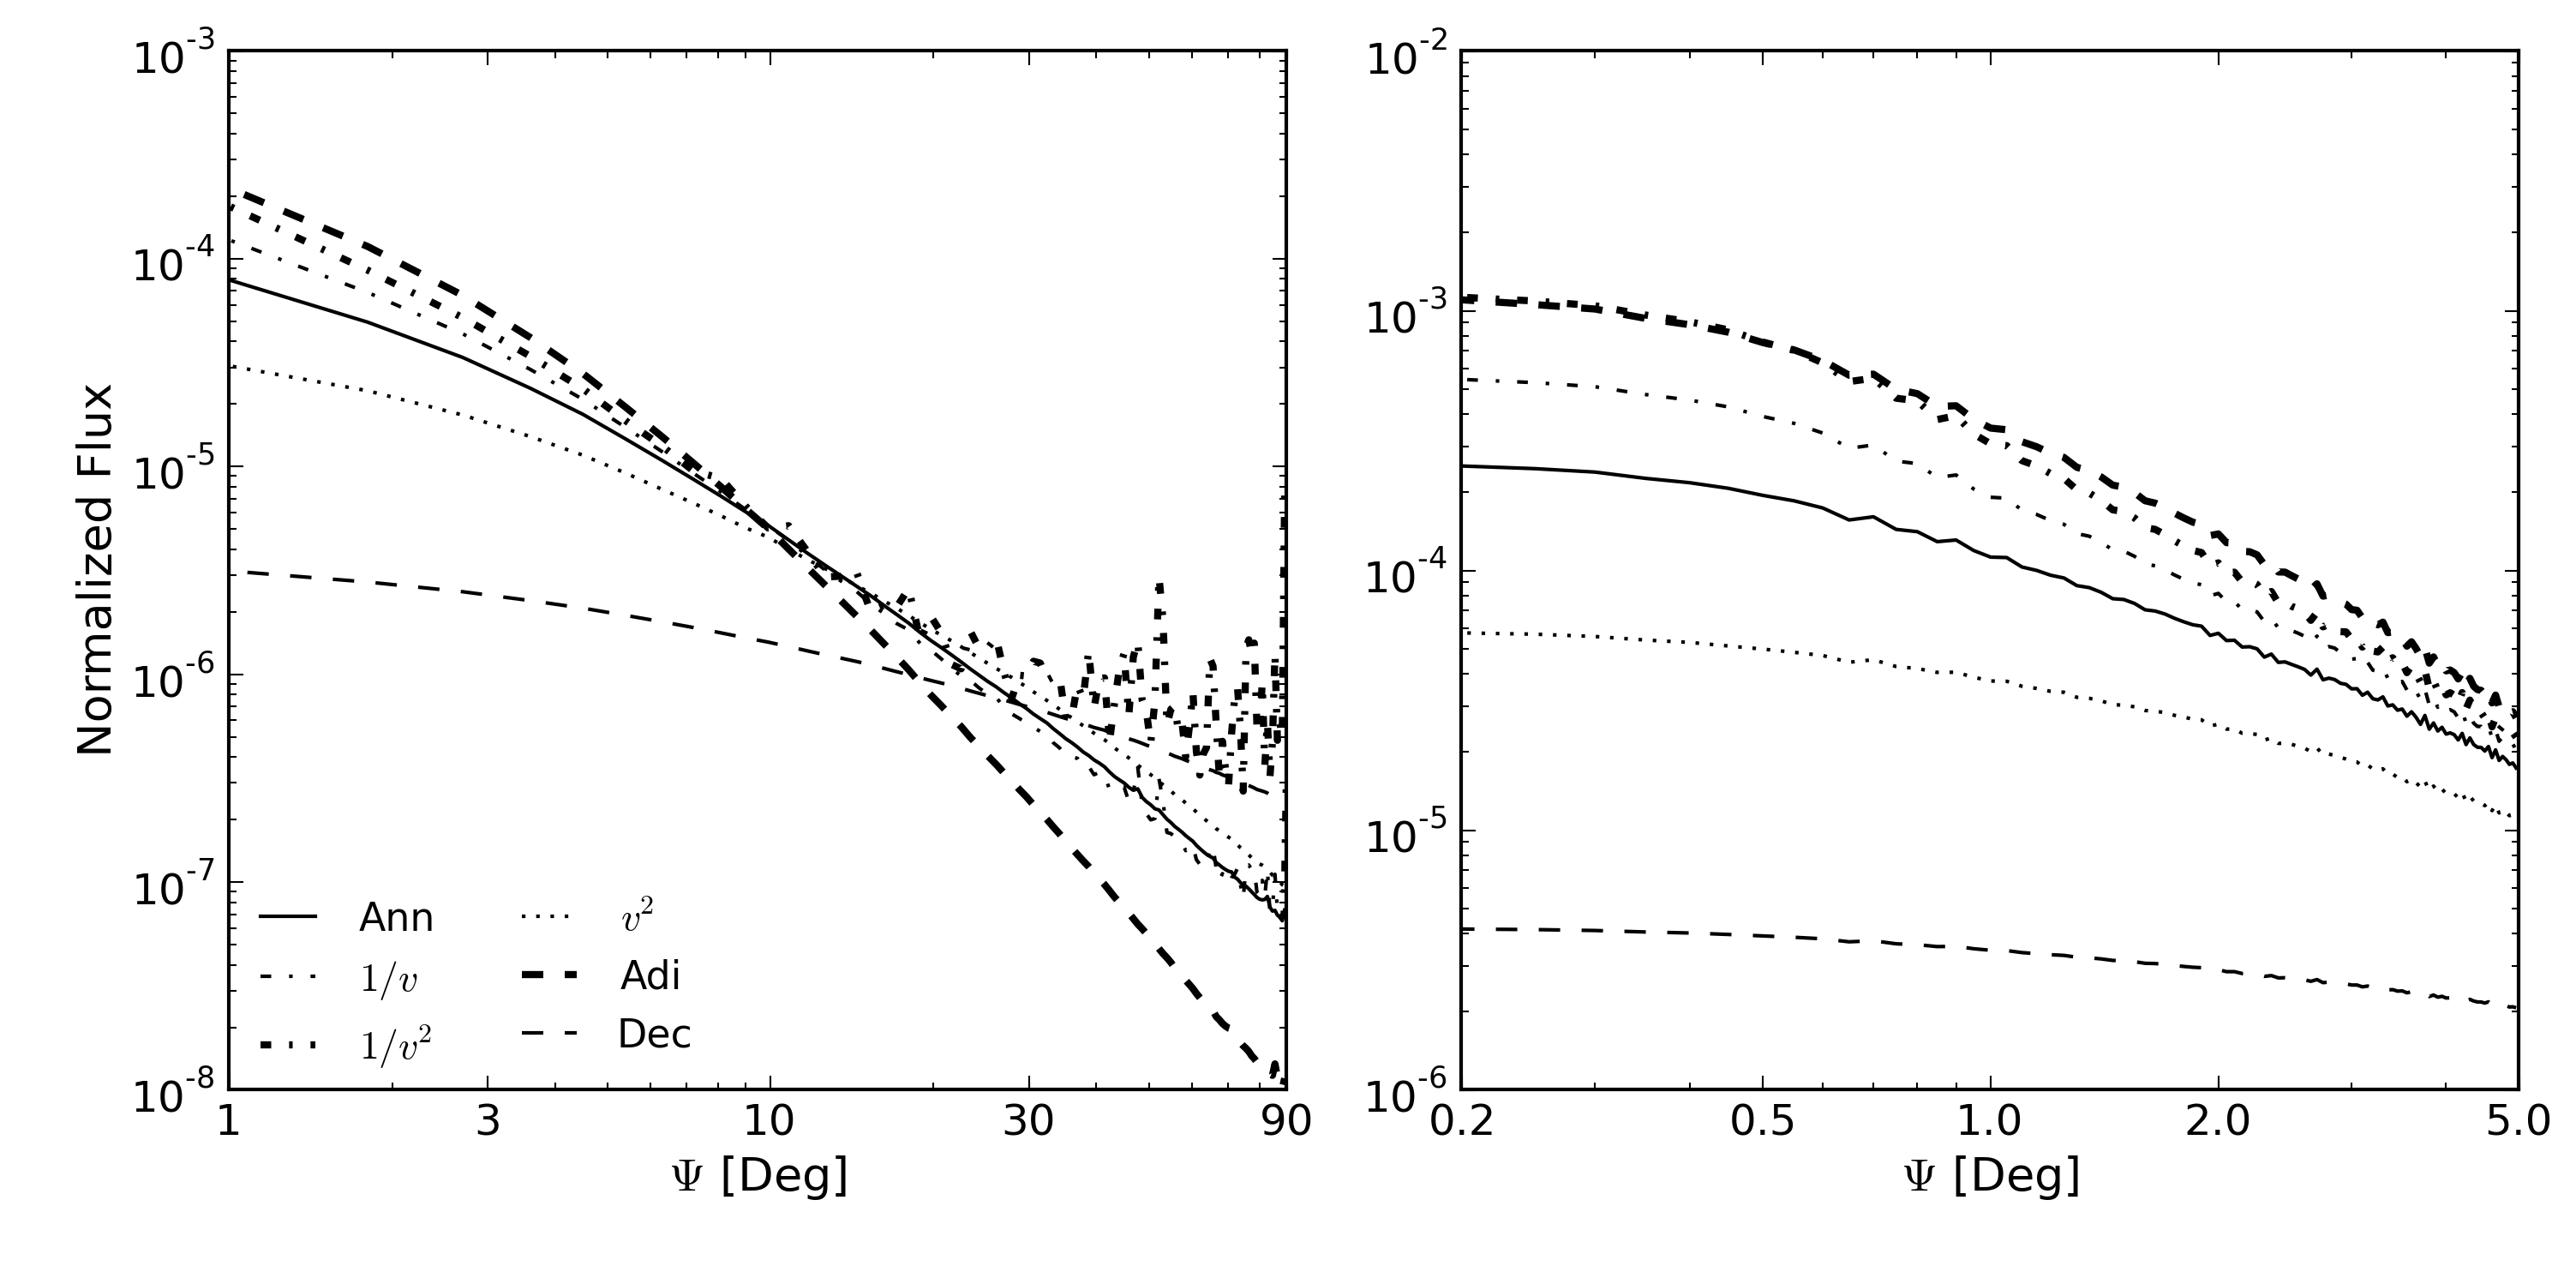
The all-sky maps of the six different annihilation/decay scenarios are shown in Fig-1. The normalization is chosen such that the host halo has flux unity. All the maps are smoothed by a Gaussian kernel with FWHM 0.5∘. They show significant differences in both the center halo profile and the relative subhalo flux. Compared to the pure annihilation case of Fig-1a, the and Sommerfeld enhancement cases (Fig-1b) have considerably more substructures visible. The resonant Sommerfeld enhancement case has the largest contribution from substructures to the annihilation flux of the six scenarios. For the wave annihilation case ( Fig-1d), the adiabatic contraction case (Fig-1e) and pure decay case ( Fig-1f), substructures are less visible than in the pure annihilation scenario. The smooth component also differs for the six scenarios in terms of both the central maximum and the profile slope, as shown in Fig-3. The adiabatic contraction case has a steep central profile such that the normalization of the total flux overwhelms the relatively small contribution from substructure. It looks more spherical in the all-sky map because of the assumption of spherical NFWc contraction (Fig-1e). Both Sommefeld enhancement cases have a larger central flux than the pure annihilation case due to the distribution of the velocity dispersion. With a dependence, the wave annihilation case therefore has a flatter central flux profile. The pure decay case has the shallowest all-sky map and radial profile because of the linear dependence.
We compare our results to the Fermi-LAT DGE model. Ackermann et al. (2012a) presented a measurement of the first 21 months of the Fermi-LAT mission and compared a grid of models of DGE emission produced by the GALPROP code. These models incorporate the observed astrophysical distribution of cosmic-ray sources, interstellar gas and radiation fields. They compare the predicted model intensities and spectra with the observations in various sky regions. The models are consistent with the Fermi data in the anti-center regions but underpredict the data in the inner regions of the Galaxy at energies around a few GeV. Their conclusions concerning the discrepancy mainly focused on undetected point sources and cosmic ray spectral index variations throughout the galaxy. Although it is generally accepted that there is an “excess” -ray signal most probably from the Galactic Center, it is still worth considering signals from off-center regions.
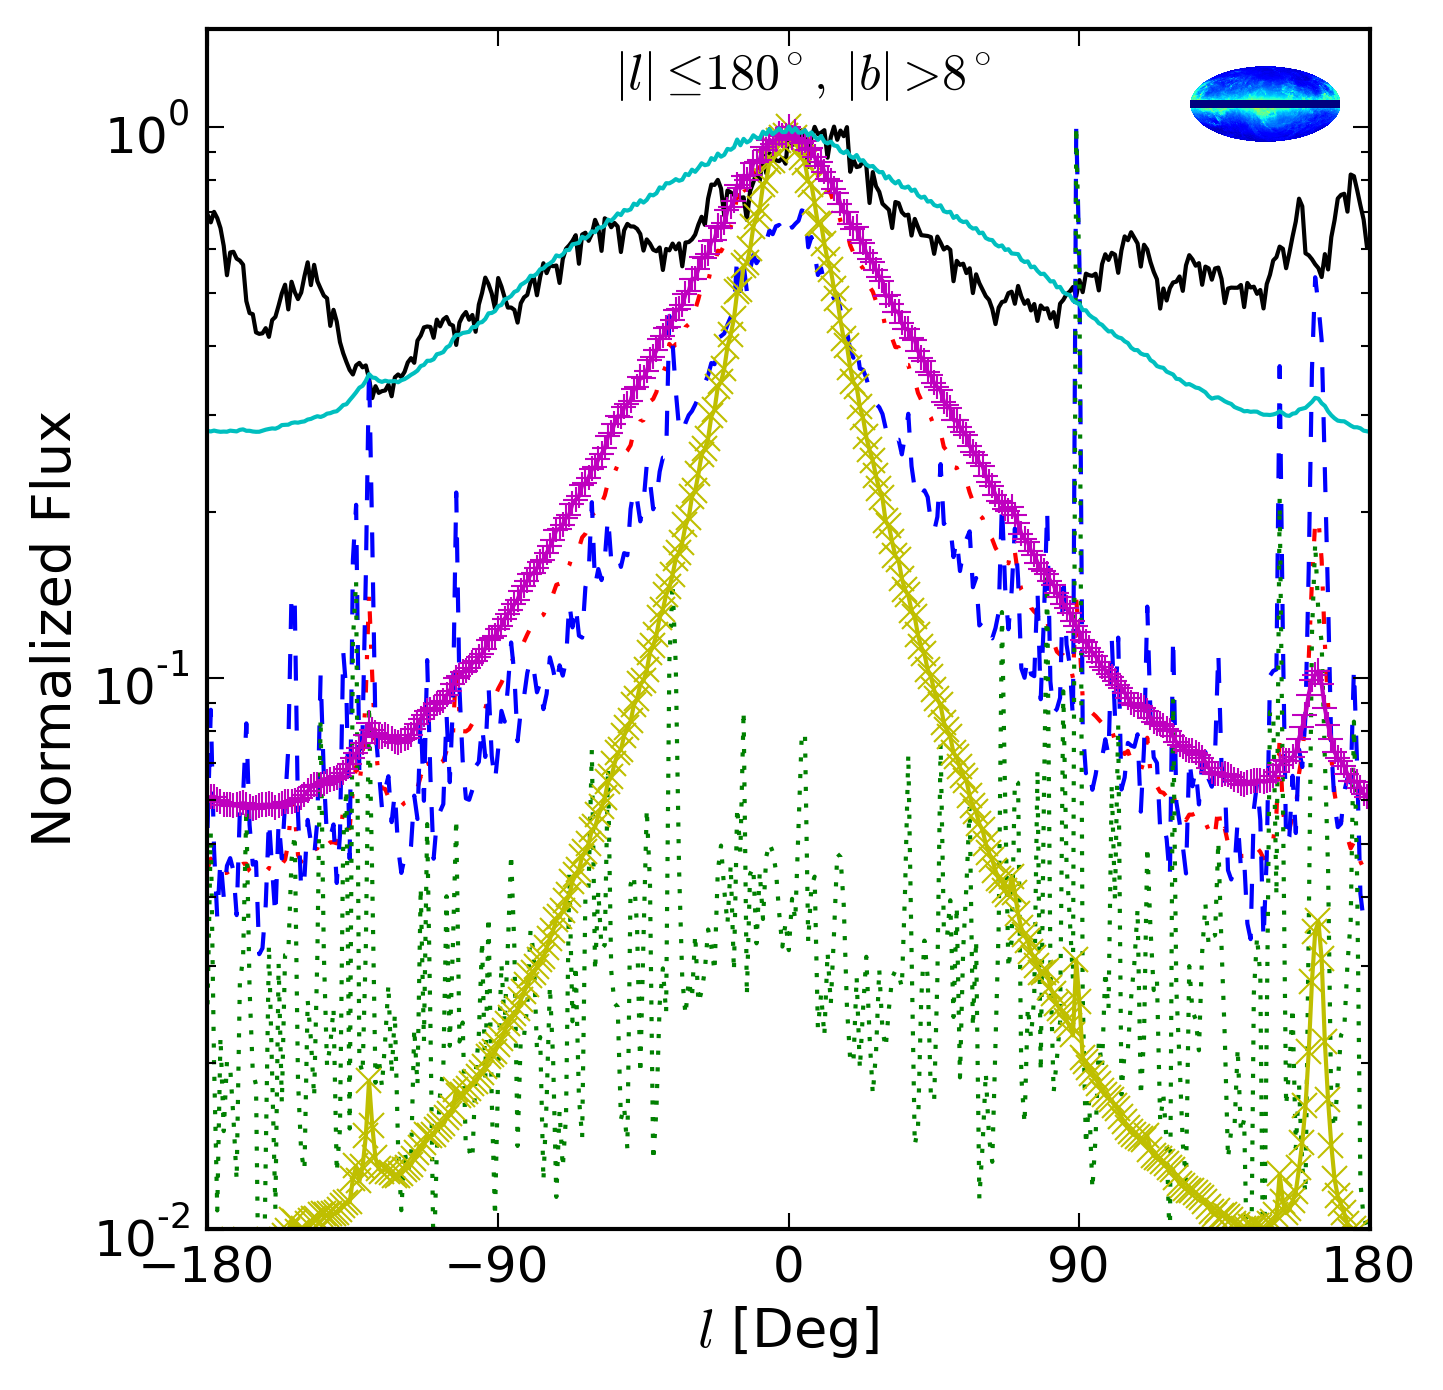
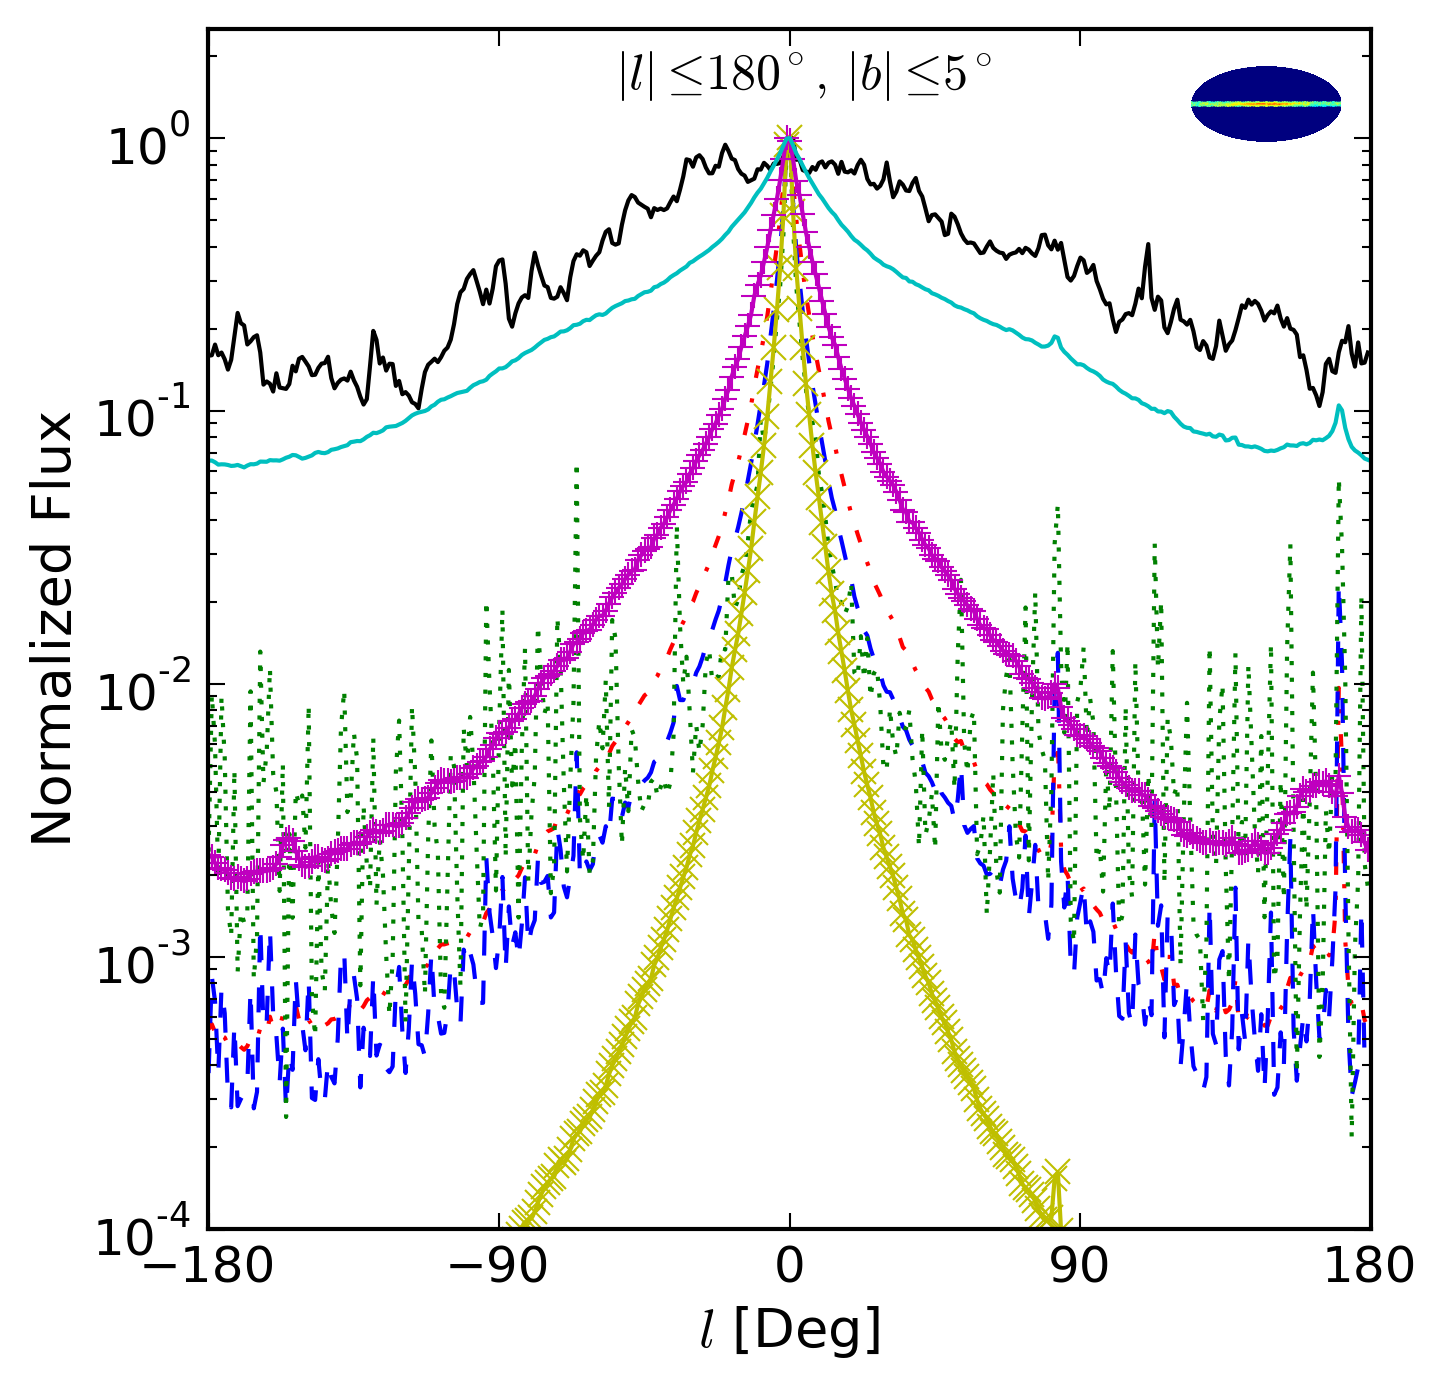
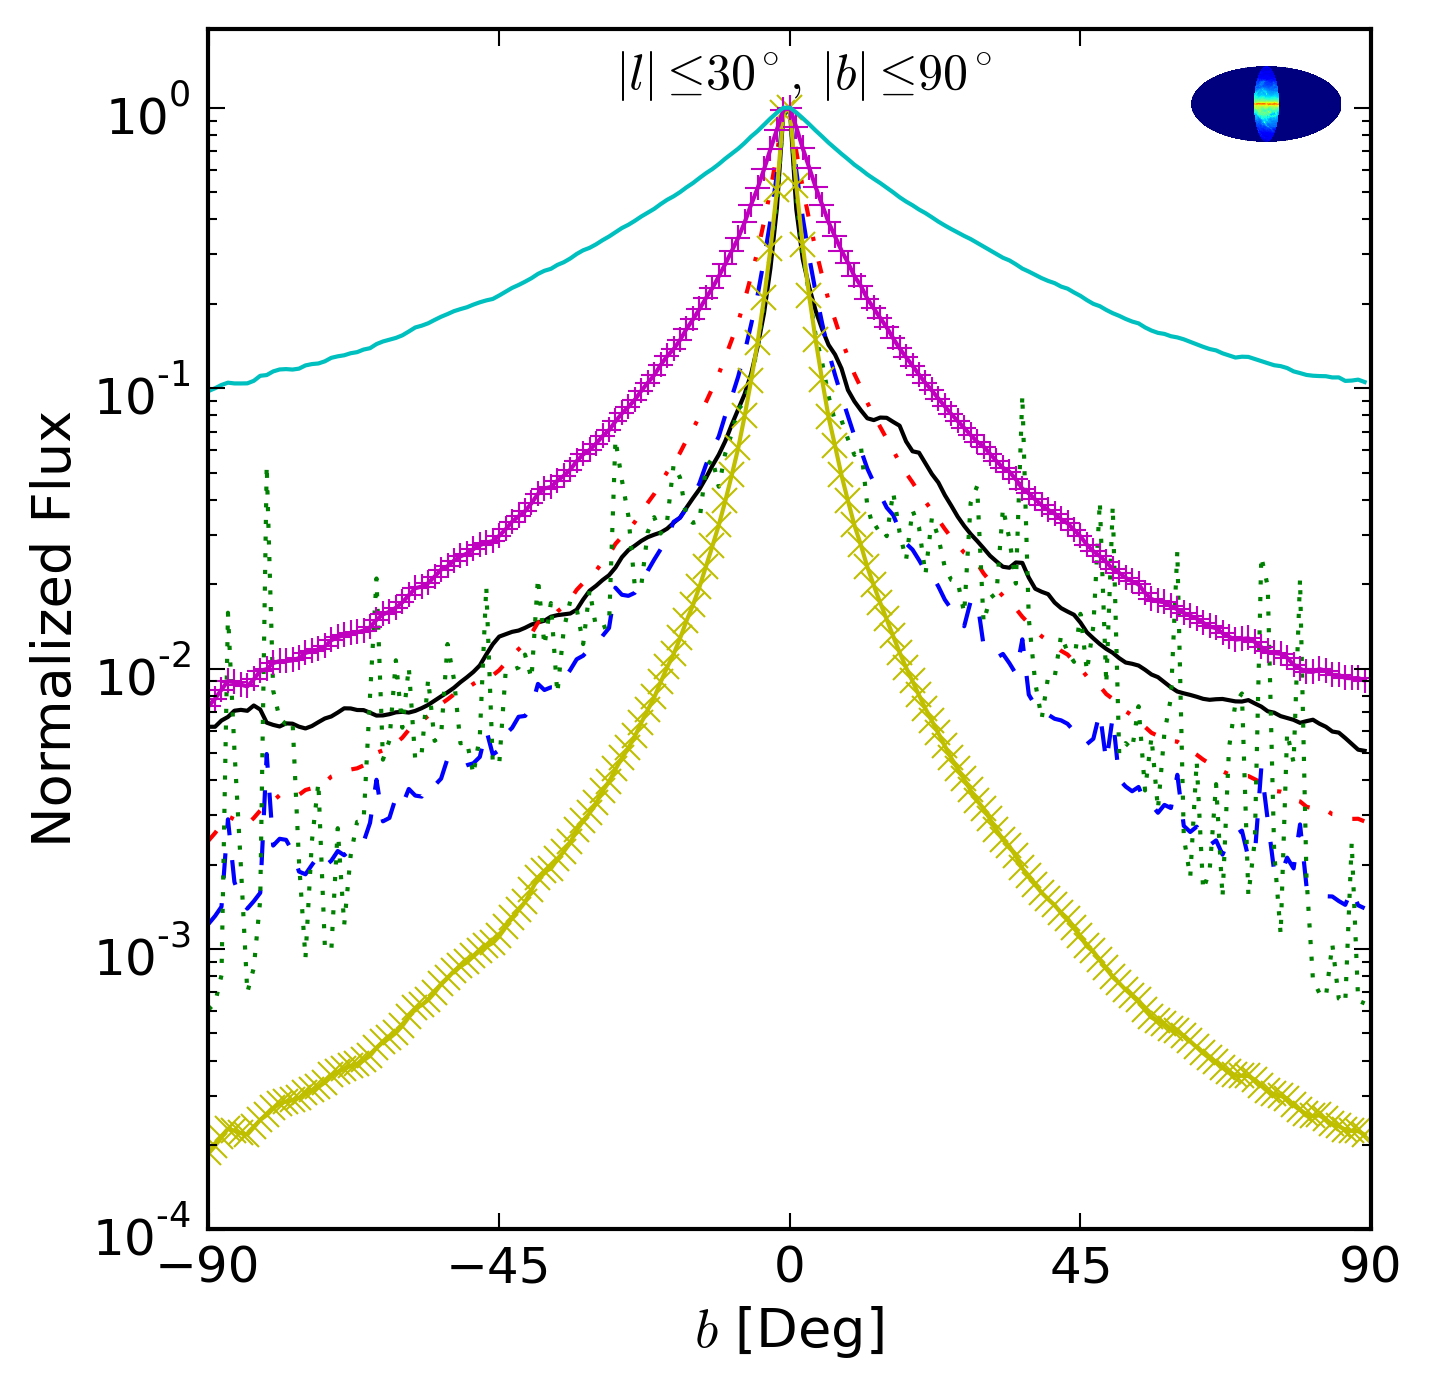
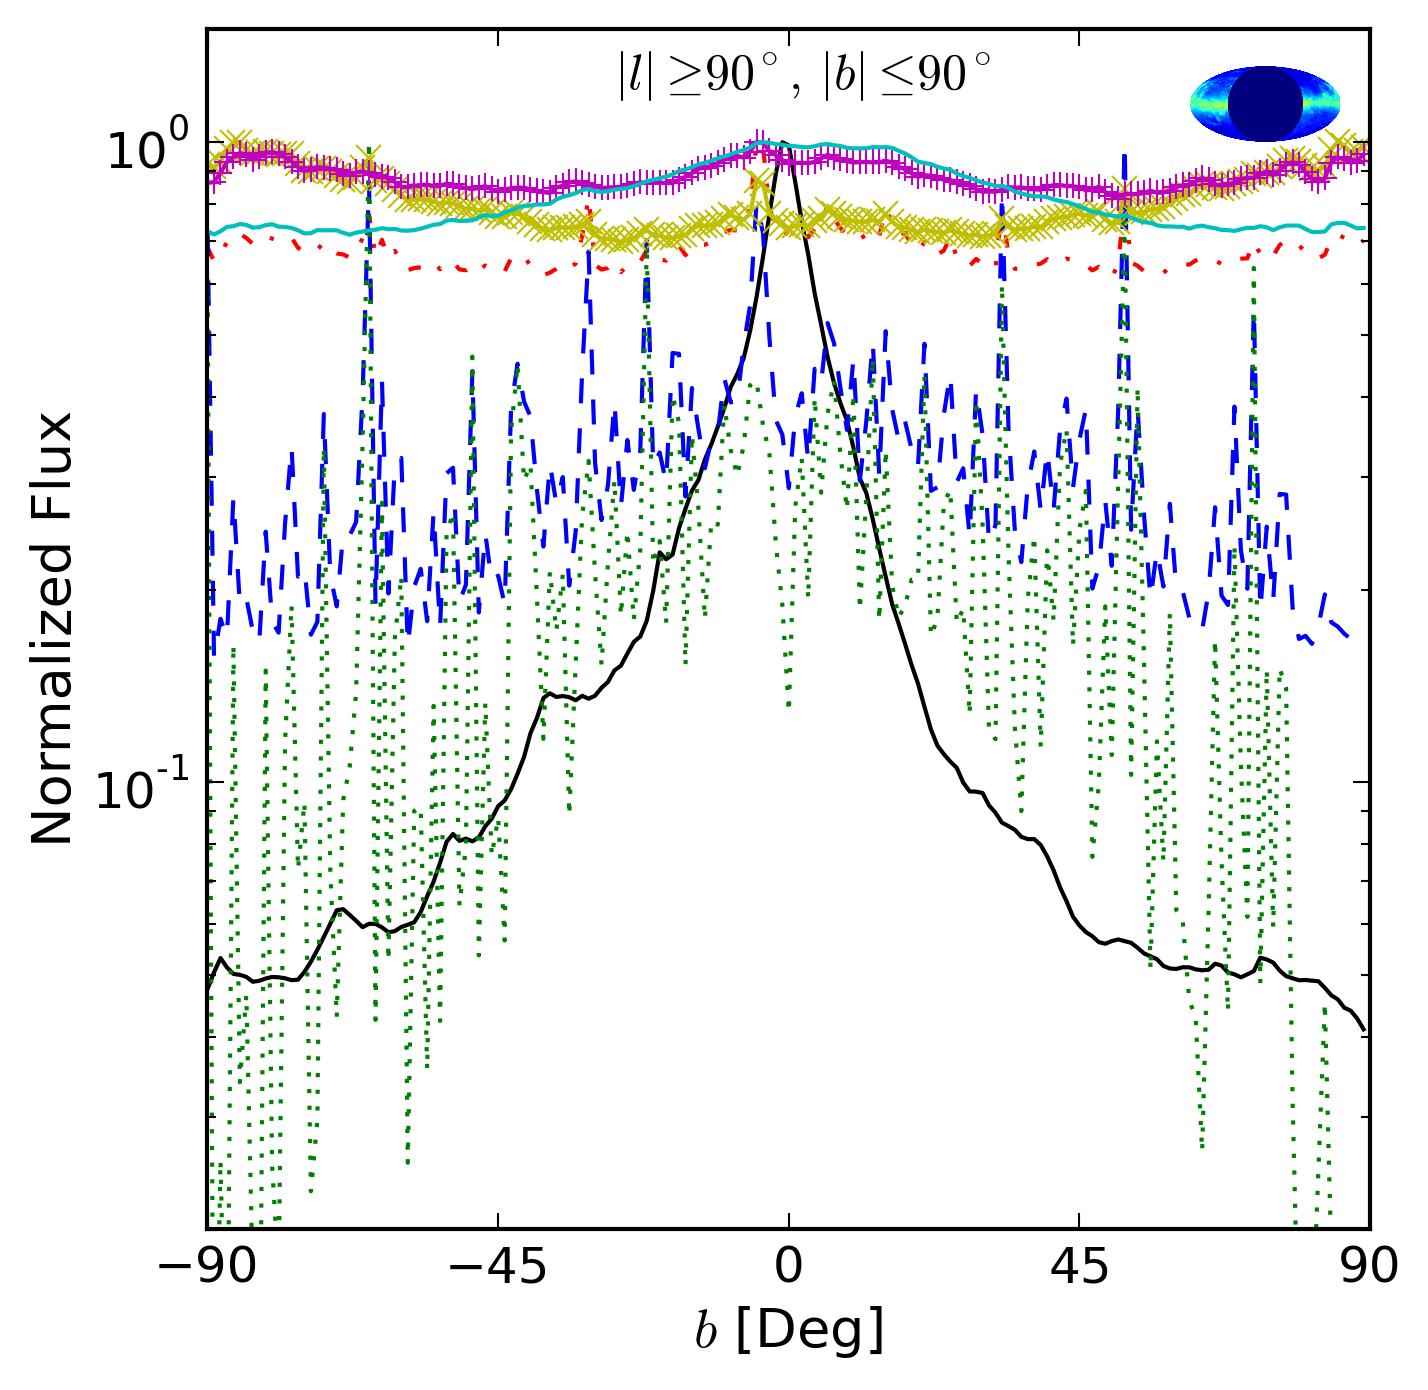
In Ackermann et al. (2012a), various sky regions are taken into consideration for the comparison of models and observations. We take the same sky regions to plot the angular profiles, namely, , , and . We also show the DGE model in each subplot. This DGE model is based on the GALPROP model . Here we do not make comparisons to models with other choices of parameters. However, since all the models are required to fit the observational data, they show very similar features. In order to get the total gamma ray flux we integrated over energy, from 50MeV to 800GeV, in the GALPROP model. The results are shown in Fig-4. The upper left panel shows the longitudinal profile of the region of the sky with the central removed, while the upper right panel shows the longitudinal profile of the central of the Galaxy. The lower left panel shows the latitude profiles of the region with . The lower right panel shows the latitude profiles of the region with removed. Two apparent large subhalos that are visible in the all-sky maps (Fig-1) would make the latitude profiles off-central in this panel. To better illustrate the comparison between the Fermi-LAT model and the profile from our model, we remove the influence from the 2 sub halos by separating the smooth main halo component and the subhalo component. We select a random position sitting 8kpc away from the GC to get an all-sky map of the subhalo component such that there is no subhalo too bright or too close to the observer. After that, we combine the subhalo component and main halo component to get a properly centered profile. The variations in the longitudinal and latitude profiles of the annihilation cases are the result of the contribution from the subhalos to the annihilation signal. The contribution from the subhalos is most important for the two Sommerfeld-corrected annihilation cases. The longitudinal profile of Sommerfeld-corrected case in the upper left panel is completely dominated by emission from subhalos.
Note that these profiles, if used to interpret the Fermi data, must be combined with the main DGE model, since they are in any case a small contribution to the full -ray emission. These comparisons provide us with intuition on how these different profiles would work if used to fit the real data. For example, in the upper panels, the DGE signal shows a relatively flat profile compared to the longitudinal profiles of the five annihilation cases. The decay profile is the most degenerate with the DGE signal and would provide a relatively larger weight when fit to data. On the contrary, in the lower two panels, due to the disk component of the Milky Way, the DGE signal has a steep central profile that most closely resembles the latitude profile of the pure annihilation case. It may lead to a larger weight to the pure annihilation contribution. The subhalos’ contribution cannot be directly used as a part of the profile model since their positions are arbitrary compared to the real case. As shown in the figures, this contribution is dominated by fluctuations and has a flat envelope. They provide an additional flat smooth component if unresolved; and a measure of the statistical uncertainties, if resolved.
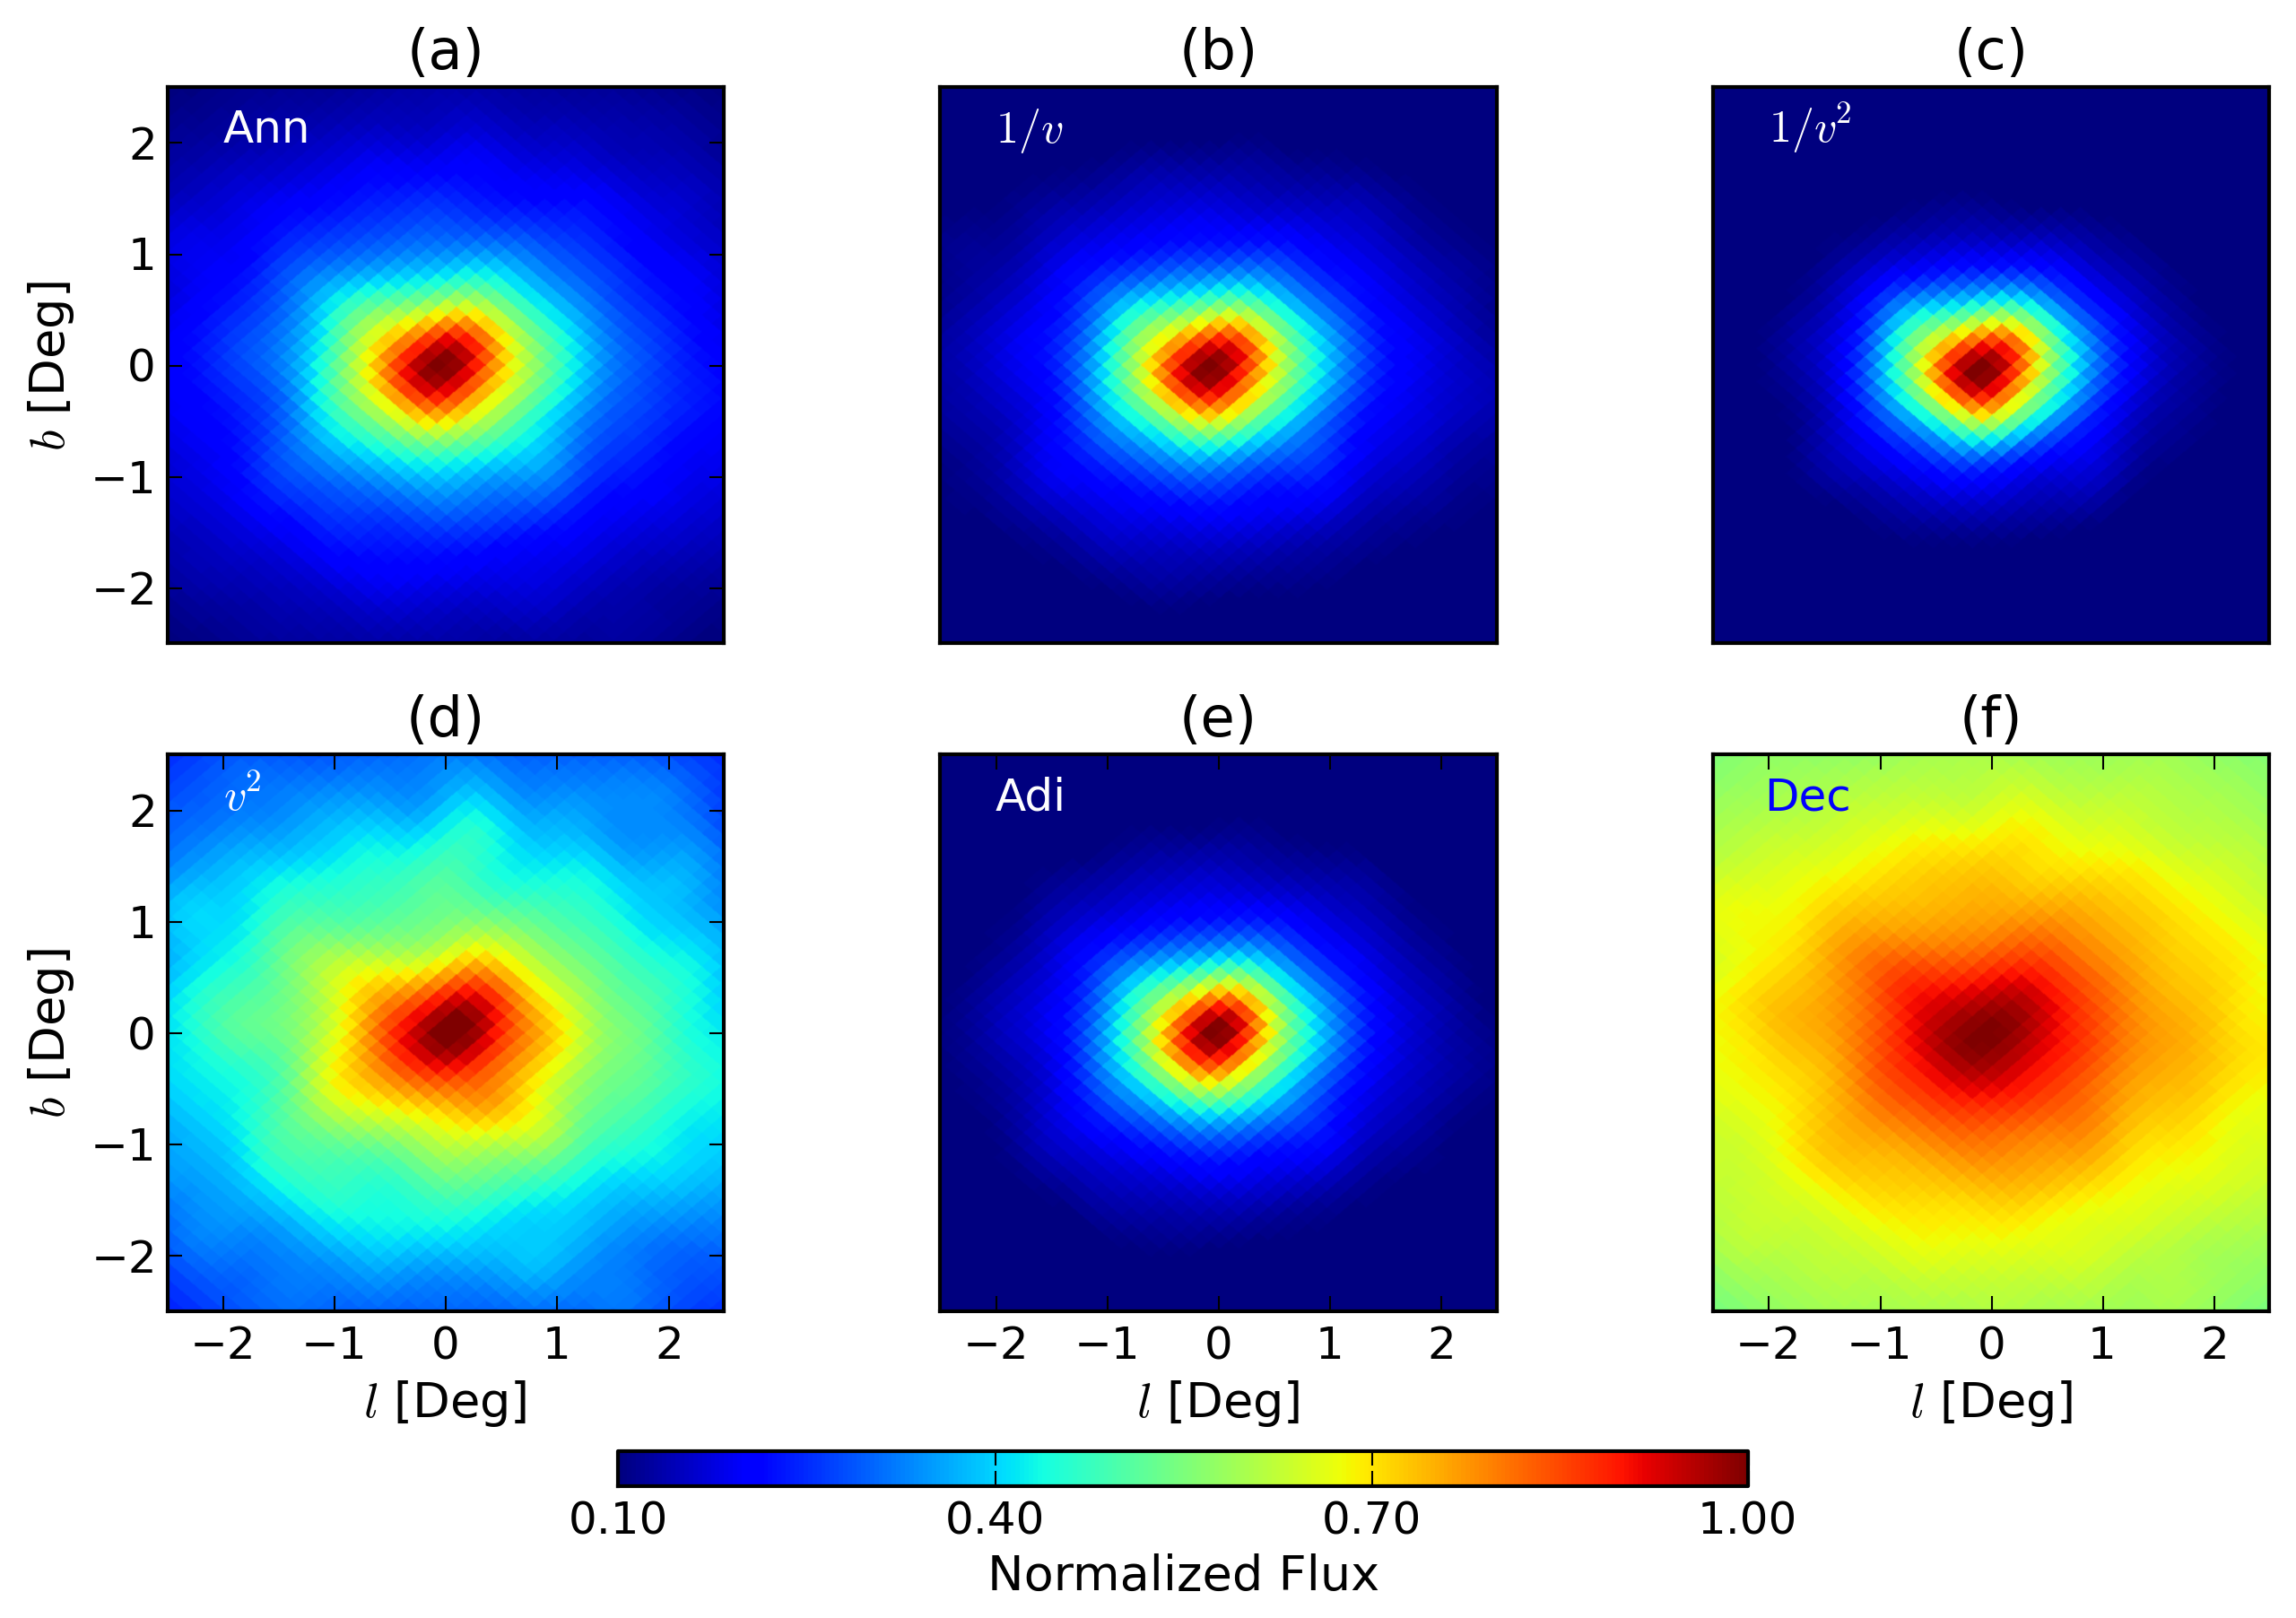
We take the inner Galactic region into special consideration since it might be a promising region for detecting DM signals. Other works propose alternative astrophysical models for the -ray excess at the Galactic Center, such as unresolved millisecond pulsars (Abazajian, 2011). Hooper et al. (2013) strongly disfavor this explanation for both the spatial distribution and spectrum of observed millisecond pulsars. Assuming that the -ray excess mainly comes from DM decays/annihilations, we show here the predicted flux map (Fig-5) and angular profile (Fig-3 right panel) of the inner region of the simulated maps for the different -ray generating cases. The angular profiles in Fig-3 right panel are normalized to the total flux of the host halo, as used in the all-sky maps. The flux maps in Fig-5 are normalized such that the center pixel has flux unity and the color scale is linear. The Sommerfeld-enhanced (Fig-5b and Fig-5c) cases and adiabatic contraction case (Fig-5e) have a more contracted profile than the pure annihilation case (Fig-5a). In contrast, the wave annihilation (Fig-5d) and pure decay case (Fig-5c) have flatter profiles illustrated by the greater spread in -ray flux over the region. The six cases of the -ray flux maps of Fig-5 show considerable variations and complex asymmetrical contours in the central region. This asymmetry would be absent from simple parameterized model of the the DM annihilation signal from a NFW/cored profile considered previously (Ackermann et al., 2012b). Note that the simulation used in this paper has a convergence radius pc which corresponds to approximately in the center region. Therefore, our method would underestimate the real flux at the innermost region. To estimate this underestimation, we simply assume the real converged density profile is Equation-3 and the simulation profile is a cored profile with kpc, pc-3Diemand et al. (2008). It turns out for annihilation, the NFW flux is 2 times larger of the cored profile occured at ; for decay, it occurred at . When using the templates to fit the real data, one should pay special attention the central few pixels.
VI DISCUSSION
The morphologies and positions of each subhalo differ completely in different realizations of simulations, and may not directly apply to fitting templates to the observational data, whereas their statistical properties can be well studied using the maps produced by our tools. One useful statistical property is the angular power spectrum (APS) of anisotropies. As pointed out by Hensley et al. (2013), APS could be used along with the energy spectrum to decompose the emission components. Gomez-Vargas et al. (2013b) did actual comparisons using simulation-generated APS Fornasa et al. (2013) with Fermi-LAT measurements Ackermann et al. (2012c), yielding reasonable preliminary results that constrain the DM annihilation cross section. Our results which consider six different physical scenarios present an extension of these results. We leave a more detailed study of anisotropies (which must have the boost factor carefully calculated) to a future project.
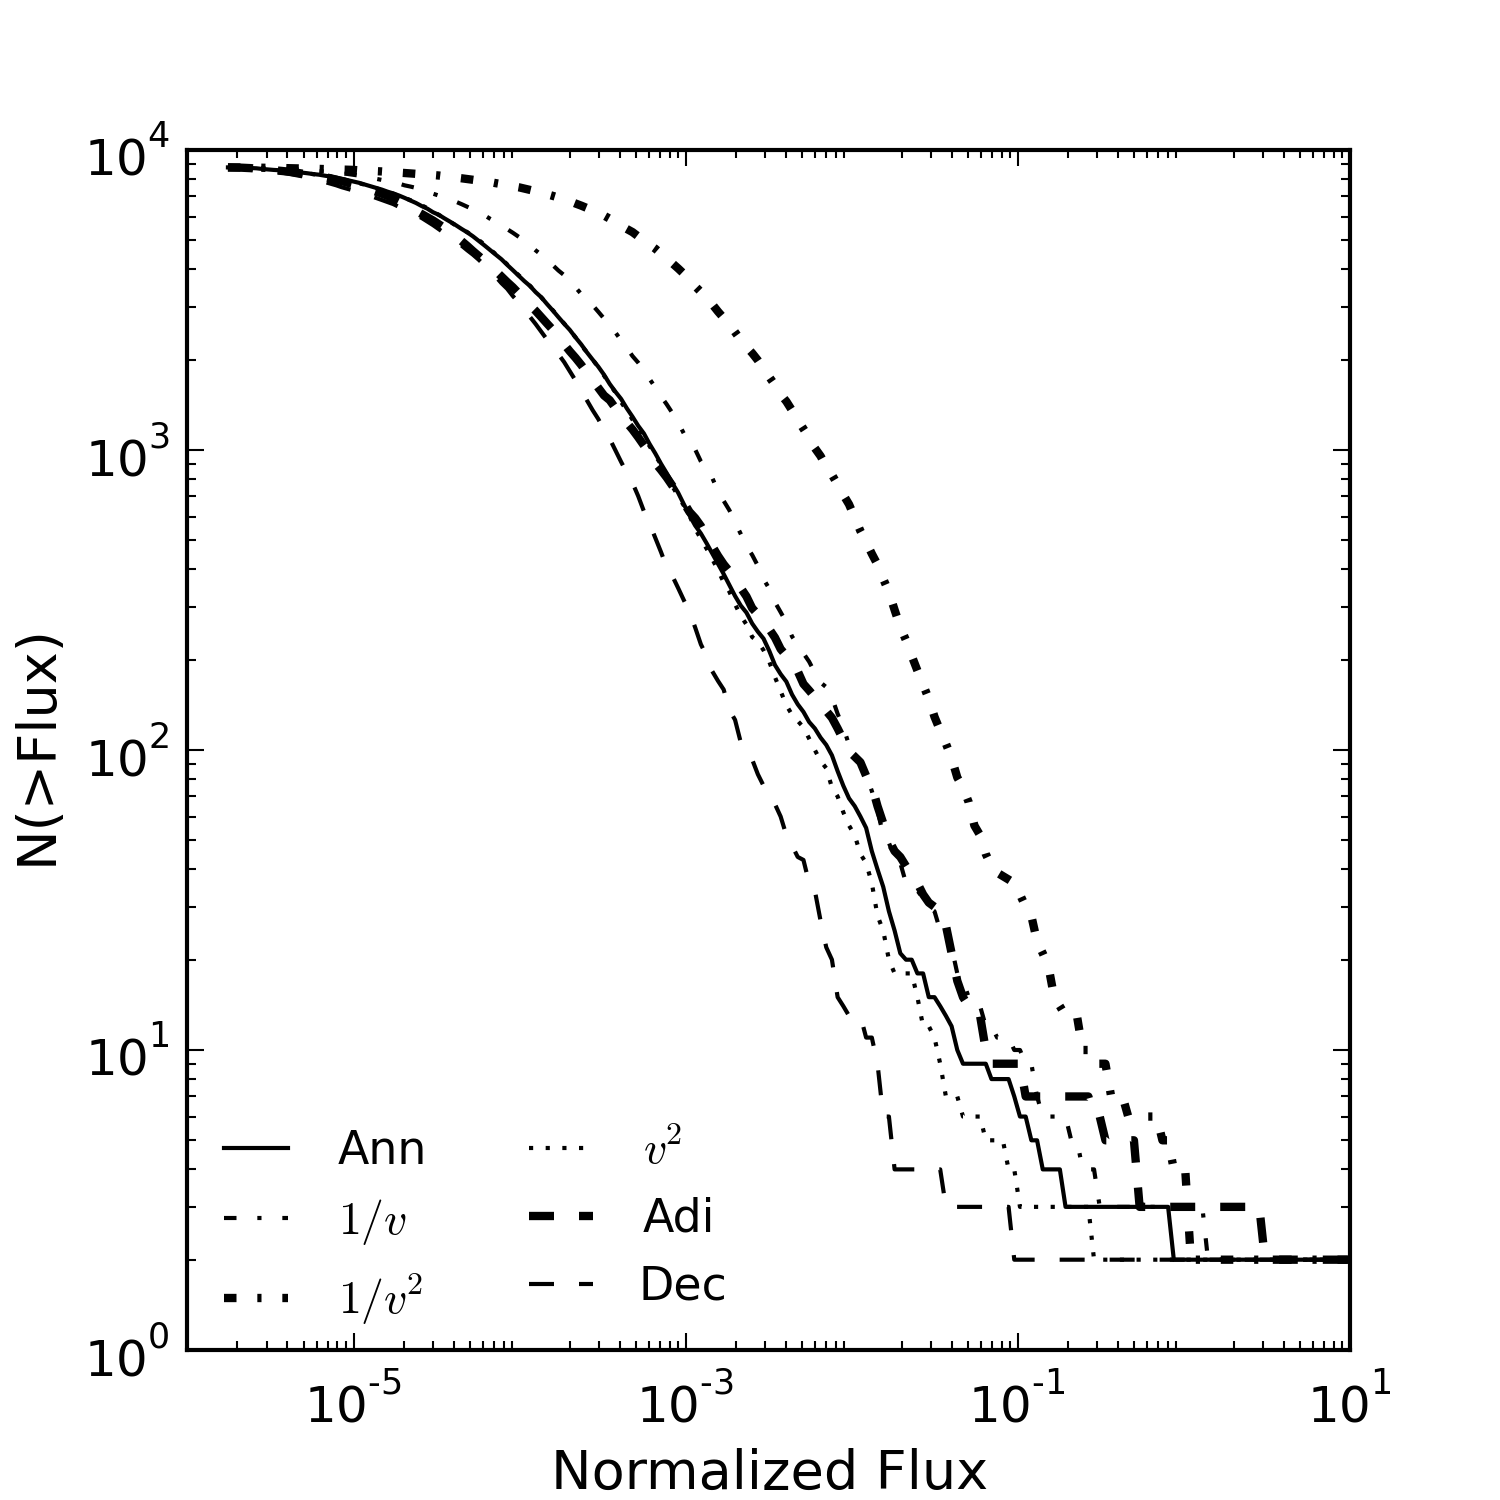
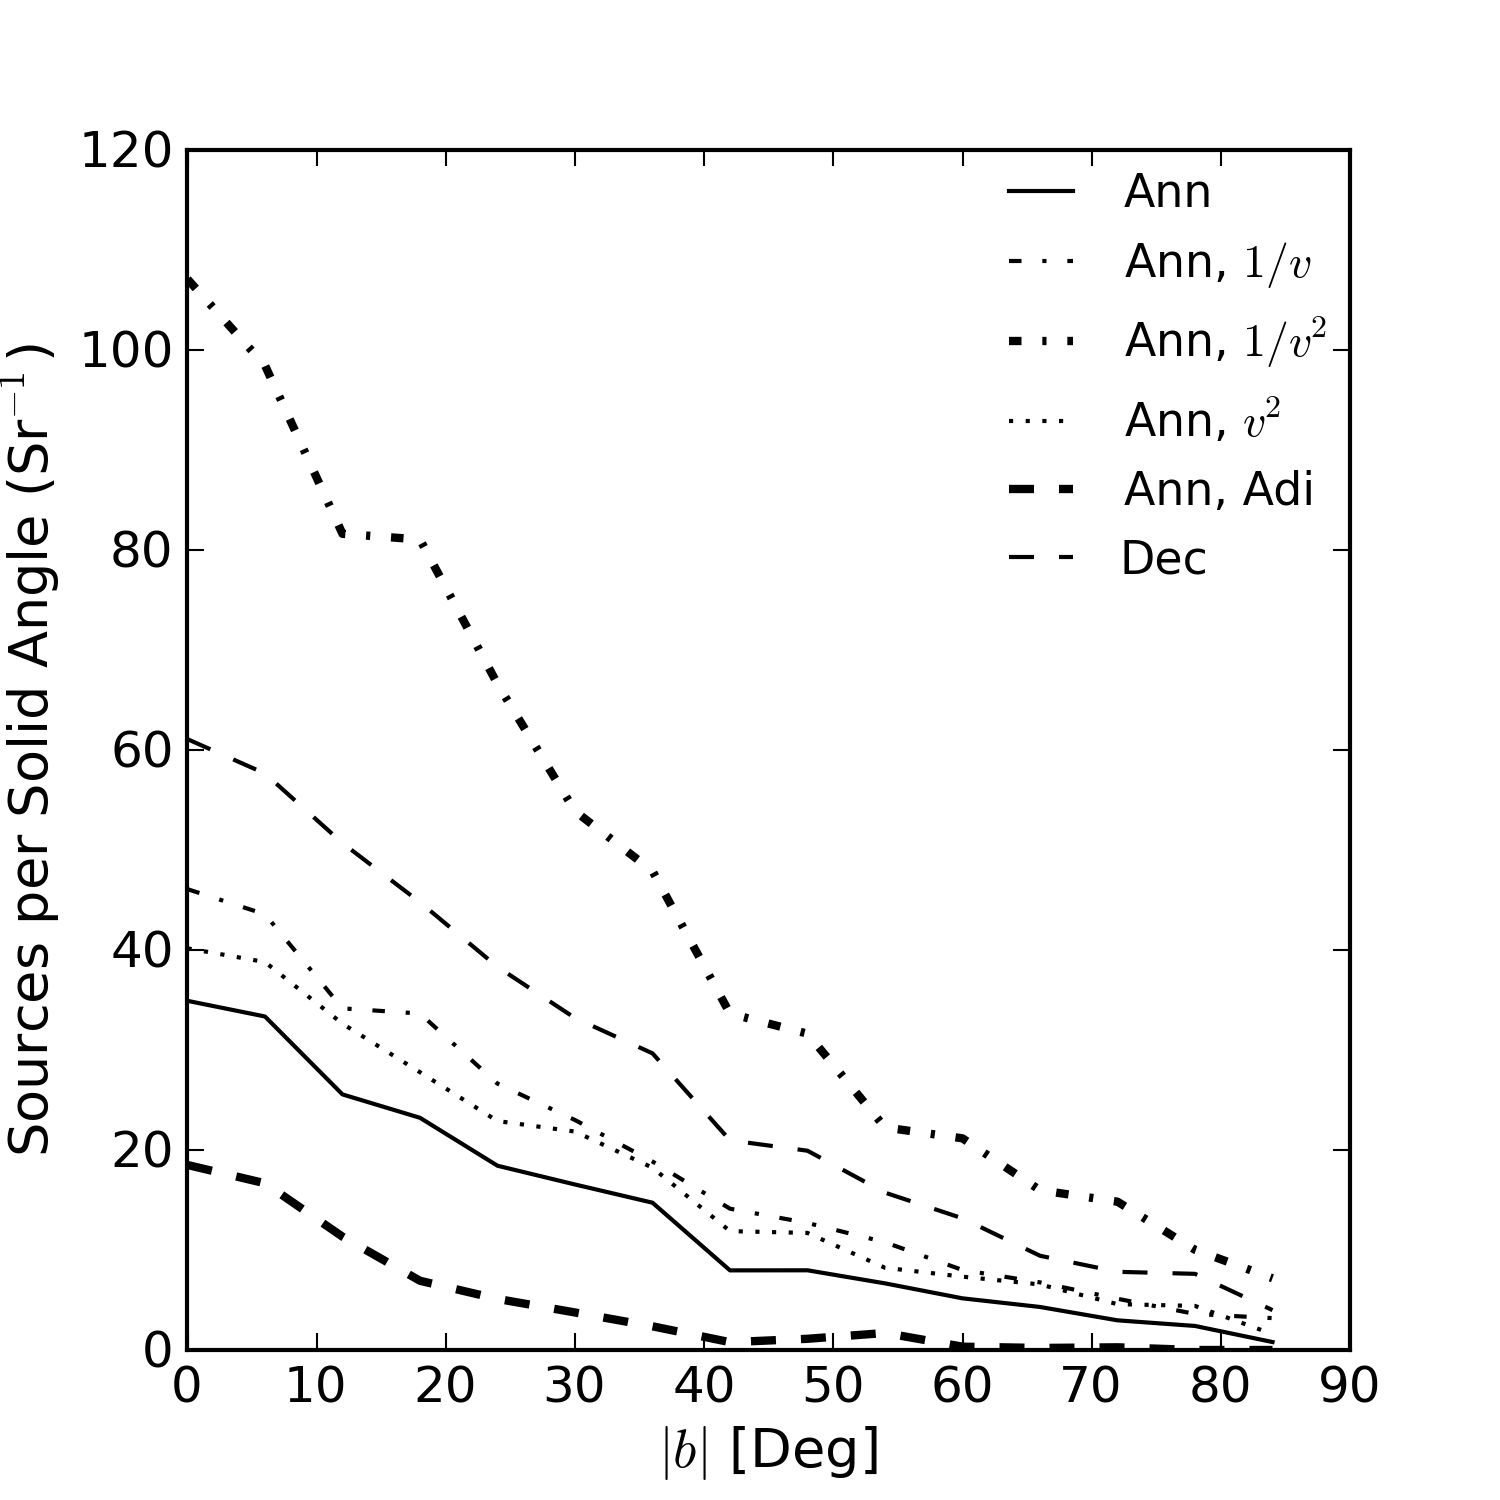
In addition to the diffuse emission, we are able to use our maps to study the point sources from Fermi-LAT. For annihilations, when we add in the Sommerfeld enhancement, the number density of detected small halos increases. For the case, the substructure almost dominates the radiation field other than in the galactic center. Fig-6 shows the flux functions of sub-halos for different cases. The flux of the subhalos are calculated by summing over the flux of all pixels inside the halo’s angular radius. All the curves converge at since the total number of sub-halos in the simulation is fixed at . The curve for the Sommerfeld enhancement is much steeper than the other curves, which indicates that the subhalos are brighter than in other models. We further plot the detectable point sources (with angle extending less than (Belikov et al., 2012)) in Fig-7. Compared to Belikov et al. (2012), these curves are shallower than the identified and unidentified sources in the second Fermi-LAT source catalog for the inner region, but are relatively flat at larger latitudes. All of these features imply that observable DM signals could come from off-center subhalos.
In summary, we are not aiming to set new constraints on DM annihilations or decays, but rather to provide possible new templates (the smooth components) to fit the DGE data with dark matter models and illustrate the possible range of profiles for plausible models. Compared to a simple assumption that the DM halo has a NFW or an isothermal profile, our results based on the simulation data are more realistic (e.g. Fig-2). The effects of subhalos could be also be statistically included in the templates, e.g. APS or used to provide as estimates of the uncertainties. The Galactic central region might be a promising region for detecting a DM signal as recently pointed out by Gordon and Macias (2013). The various DM maps we present here show significant observational differences when the DM annihilation/decay physics are changed. The morphology of the center region is also asymmetric and complex, and simple analytical templates may fail to match the real signal. There are three key points that we wish to emphasize here.
Firstly, compared to the Fermi DGE result, the annihilation signal, with or without Sommerfeld enhancement, has distinctly different central profiles. The shape of the Fermi excess profile in the Fermi bubble region has recently been used as a means of discriminating dark matter from millisecond pulsar models of the central excess (Hooper and Slatyer, 2013). Our philosophy here is similar but we extend this approach to probing the nature of DM annihilations. We predict different profiles for the alternative dark matter annihilation models. The differences are especially notable for decaying dark matter, for which the flux profile is very flat.
Secondly, it is clear that some of our models, especially the Sommerfeld cases, provide more bright substructures than are allowed by the observations in terms of unresolved and unidentified point sources. We leave it to others to make detailed comparisons with the data, but our predicted cumulative counts of subhalos should provide a basic comparison . The wave annihilation case is a promising model since it removes many of these bright substructures. The model including adiabatic contraction has a similar effect of de-emphasizing the substructure by increasing the contrast between host halo core and the (unadiabatically contracted) subhalos, although the quantitative role of adiabatic contraction of the DM in halos remains controversial.
Finally we note that we have not included any spectral signatures, which differ among the various adopted annihilation channels and particle masses: for example the Sommerfeld models require high values for the particle mass ( TeV) and hence would be best constrained through observational data at relatively high photon energies.
Acknowledgements.
We thank Michael Kuhlen for his help on developing our algorithm. We acknowledge support from National Science Foundation grant OIA-1124403, and OCI-1040114. The research of JS has also been supported at IAP by ERC project 267117 (DARK) hosted by Université Pierre et Marie Curie - Paris 6. Support for P.M. was provided by the NSF through grants OIA-1124453, and by NASA through grant NNX12AF87G. The research of A.S. and of RFGW was also supported by grant 109285 from the Gordon and Betty Moore Foundation.References
- Frenk and White (2012) C. S. Frenk and S. D. M. White, Annalen der Physik 524, 507 (2012).
- Navarro et al. (1996) J. F. Navarro, C. S. Frenk, and S. D. M. White, The Astrophysical Journal 462, 563 (1996).
- Freese et al. (2009) K. Freese, P. Gondolo, J. A. Sellwood, and D. Spolyar, The Astrophysical Journal 693, 1563 (2009).
- Ackermann et al. (2012a) M. Ackermann, M. Ajello, W. B. Atwood, L. Baldini, J. Ballet, G. Barbiellini, D. Bastieri, K. Bechtol, R. Bellazzini, B. Berenji, et al., The Astrophysical Journal 750, 3 (2012a).
- Ackermann et al. (2012b) M. Ackermann, M. Ajello, W. B. Atwood, L. Baldini, G. Barbiellini, D. Bastieri, K. Bechtol, R. Bellazzini, R. D. Blandford, E. D. Bloom, et al., The Astrophysical Journal 761, 91 (2012b).
- Springel et al. (2008a) V. Springel, J. Wang, M. Vogelsberger, A. Ludlow, A. Jenkins, A. Helmi, J. F. Navarro, C. S. Frenk, and S. D. M. White, arXiv.org pp. 1685–1711 (2008a), eprint 0809.0898v1.
- Diemand et al. (2008) J. Diemand, M. Kuhlen, P. Madau, M. Zemp, B. Moore, D. Potter, and J. Stadel, Nature 454, 735 (2008).
- Stadel et al. (2009) J. Stadel, D. Potter, B. Moore, J. Diemand, P. Madau, M. Zemp, M. Kuhlen, and V. Quilis, Monthly Notices of the Royal Astronomical Society 398, L21 (2009).
- Anderson et al. (2010) B. Anderson, M. Kuhlen, J. Diemand, R. P. Johnson, and P. Madau, The Astrophysical Journal 718, 899 (2010).
- Kuhlen et al. (2008) M. Kuhlen, J. Diemand, and P. Madau, The Astrophysical Journal 686, 262 (2008).
- Berlin and Hooper (2013) A. Berlin and D. Hooper (2013), eprint 1309.0525.
- Feng et al. (2010) J. L. Feng, M. Kaplinghat, and H.-B. Yu, Physical Review D 82, 083525 (2010).
- Diemand et al. (2007a) J. Diemand, M. Kuhlen, and P. Madau, The Astrophysical Journal 657, 262 (2007a).
- Diemand et al. (2007b) J. Diemand, M. Kuhlen, and P. Madau, The Astrophysical Journal 667, 859 (2007b).
- Kuhlen et al. (2007) M. Kuhlen, J. Diemand, and P. Madau, The Astrophysical Journal 671, 1135 (2007).
- Górski et al. (2005) K. M. Górski, E. Hivon, A. J. Banday, B. D. Wandelt, F. K. Hansen, M. Reinecke, and M. Bartelmann, The Astrophysical Journal 622, 759 (2005).
- Yang and Szalay (2013) L. Yang and A. Szalay, Astronomical Data Analysis Software and Systems XXII 475, 73 (2013).
- Springel et al. (2008b) V. Springel, S. D. M. White, C. S. Frenk, J. F. Navarro, A. Jenkins, M. Vogelsberger, J. Wang, A. Ludlow, and A. Helmi, Nature 456, 73 (2008b).
- Fornasa et al. (2013) M. Fornasa, J. Zavala, M. A. Sanchez-Conde, J. M. Siegal-Gaskins, T. Delahaye, F. Prada, M. Vogelsberger, F. Zandanel, and C. S. Frenk, Monthly Notices of the Royal Astronomical Society 429, 1529 (2013).
- Kamionkowski et al. (2010) M. Kamionkowski, S. M. Koushiappas, and M. Kuhlen, Physical Review D 81 (2010).
- Adriani et al. (2009) O. Adriani, G. Barbarino, G. A. Bazilevskaya, R. Bellotti, M. Boezio, E. A. Bogomolov, L. Bonechi, M. Bongi, V. Bonvicini, S. V. Borisov, et al., Journal of Geophysical Research 114, 12218 (2009).
- Aguilar et al. (2013) M. Aguilar, G. Alberti, B. Alpat, A. Alvino, G. Ambrosi, K. Andeen, H. Anderhub, L. Arruda, P. Azzarello, A. Bachlechner, et al., Physical Review Letters 110, 141102 (2013).
- Lattanzi and Silk (2009) M. Lattanzi and J. Silk, Physical Review D 79, 083523 (2009).
- Arkani-Hamed et al. (2009) N. Arkani-Hamed, D. P. Finkbeiner, T. R. Slatyer, and N. Weiner, Phys. Rev. D 79, 015014 (2009), URL http://link.aps.org/doi/10.1103/PhysRevD.79.015014.
- Sommerfeld (1931) A. Sommerfeld, Annalen der Physik 403, 257 (1931).
- Kuhlen et al. (2009) M. Kuhlen, P. Madau, and J. Silk, Science 325, 970 (2009).
- Goldberg (1983) H. Goldberg, Physical Review Letters 50, 1419 (1983).
- Essig et al. (2013) R. Essig, E. Kuflik, S. D. McDermott, T. Volansky, and K. M. Zurek, arXiv.org hep-ph (2013).
- Gnedin et al. (2011) O. Y. Gnedin, D. Ceverino, N. Y. Gnedin, A. A. Klypin, A. V. Kravtsov, R. Levine, D. Nagai, and G. Yepes, eprint arXiv:1108.5736 (2011).
- Blumenthal et al. (1986) G. R. Blumenthal, S. M. Faber, R. Flores, and J. R. Primack, The Astrophysical Journal 301, 27 (1986).
- Gnedin et al. (2004) O. Y. Gnedin, A. V. Kravtsov, A. A. Klypin, and D. Nagai, The Astrophysical Journal 616, 16 (2004).
- Gomez-Vargas et al. (2013a) G. A. Gomez-Vargas, M. A. Sanchez-Conde, J.-H. Huh, M. Peiro, F. Prada, A. Morselli, A. Klypin, D. G. Cerdeno, Y. Mambrini, and C. Munoz, Journal of Cosmology and Astroparticle Physics 2013, 029 (2013a).
- Abazajian (2011) K. N. Abazajian, Journal of Cosmology and Astroparticle Physics 3, 010 (2011).
- Hooper et al. (2013) D. Hooper, I. Cholis, T. Linden, J. M. Siegal-Gaskins, and T. R. Slatyer, Physical Review D 88, 083009 (2013).
- Hensley et al. (2013) B. S. Hensley, V. Pavlidou, and J. M. Siegal-Gaskins, Monthly Notices of the Royal Astronomical Society 433, 591 (2013).
- Gomez-Vargas et al. (2013b) G. A. Gomez-Vargas, A. Cuoco, T. Linden, M. A. Sanchez-Conde, J. M. Siegal-Gaskins, f. t. F.-L. Collaboration, T. Delahaye, M. Fornasa, E. Komatsu, F. Prada, et al. (2013b).
- Ackermann et al. (2012c) M. Ackermann, M. Ajello, A. Albert, L. Baldini, J. Ballet, G. Barbiellini, D. Bastieri, K. Bechtol, R. Bellazzini, E. D. Bloom, et al., Physical Review D 85 (2012c).
- Belikov et al. (2012) A. V. Belikov, M. R. Buckley, and D. Hooper, Phys. Rev. D 86, 043504 (2012), URL http://link.aps.org/doi/10.1103/PhysRevD.86.043504.
- Gordon and Macias (2013) C. Gordon and O. Macias, Physical Review D 88, 083521 (2013).
- Hooper and Slatyer (2013) D. Hooper and T. R. Slatyer (2013), eprint 1302.6589.