Search for time modulations in the decay rate of 40K and 232Th
Abstract
Time modulations at per mil level have been reported to take place in the decay constant of about 15 nuclei with period of one year (most cases) but also of about one month or one day. In this paper we give the results of the activity measurement of a 40K source and a 232Th one. The two experiments have been done at the Gran Sasso Laboratory during a period of about 500 days, above ground (40K) and underground (232Th) with a target sensitivity of a few parts over 105. We also give the results of the activity measurement at the time of the X-class solar flares which took place in May 2013. Briefly, our measurements do not show any evidence of unexpected time dependence in the decay rate of 40K and 232Th.
keywords:
Radioactivity , Scalar Field , Solar Flare , Gran Sasso1 Introduction
A possible time dependence of the radioactive nuclei decay constant has been searched for since the beginning of the science of radioactivity. For instance, in the Ph.D. of M. Curie [1] one can already find the negative results of the search for a difference in the radioactivity of uranium between midday and midnight. Recently, the interest in the subject has been renewed [2] since various experiments have reported evidence of such an effect with period of one year (most cases) but also of about one month or one day. In particular, in [3] the constancy of the activity of a 226Ra source has been measured with an ionization chamber. An annual modulation of amplitude 0.15, having the maximum in February and the minimum in August, has been observed. The activity of a 152Eu source has also been measured by means of a Ge(Li) detector and an even larger annual modulation (0.5) has been detected. Alburger and Collaborators [4] measured the half-life of 32Si, which is interesting for many applications in Earth Science. Data, collected in four years, show an evident annual modulation, with an amplitude of about 0.1 . In [2, 5] the existence of new and unknown particle interaction has been advocated to explain the yearly variation in the activity of radioactive sources [3, 4]. The Authors correlate these variations to the Sun-Earth distance. On the other hand, the possibility for anti-neutrinos affecting the decay has been excluded in a recent reactor experiment [6].
The paper by Jenkins and Collaborators [2] triggered a renewed interest in the subject. Old and recent data have been analyzed, or reanalyzed, to search for periodic and sporadic variations with time. Some of the measurements and analyses confirm the existence of oscillations [7, 8, 9] whereas others contradict this hypothesis [10, 11, 12, 13, 14]. For instance, [7] presents the time dependence of the counting rate for 60Co, 90Sr and 90Y sources, measured with Geiger Müller detectors and for a 239Pu source, measured with silicon detectors. While beta sources show an annual (and monthly) variation with amplitude of about 0.3, the count rate from the Pu source is fairly constant. The most updated list of experimental results on different nuclei showing time-dependent decay rate is given in [15].
Since we believed that more dedicated experiments were needed to carefully investigate the time dependence of the decay constant, two years ago we performed an experiment underground at the Gran Sasso Laboratory (LNGS) with a 137Cs source and a heavily shielded Germanium detector [16]. Time dependence in the order of 0.2 were previously reported for 137Cs [17]. Results of our experiment have already been published. Very briefly, any oscillation with period between 6 hours and 1 year and with amplitude larger than 9.610-5 has been excluded at 95 confidence level (C.L.). In particular, for an oscillation period of 1 year a limit of 8.510-5 at 95 C.L. on the maximum allowed amplitude has been set independently of the phase.
In the next section we describe our methodological approach, before giving in section 3 and 4 the results of the two new experiments we performed to study the electron-capture partial decay constant of 40K and the decay chain of 232Th (alpha and beta decay), the former above ground and the latter underground at LNGS. Before giving conclusions, we describe in section 5 the decay rate of the two radioactive sources in correspondence with the strong X-class solar flares which took place in May 2013. Finally, we show in the Appendix that the size of a possible modulation induced by the coupling with a scalar field sourced by the Sun (one of the few mechanisms introduced to explain the effect) could be only at the level of 10-12, at most.
2 The methodological approach
The general aim of our dedicated experiments is to reach a sensitivity better than 1 part over 10000 (1 level) on a possible annual modulation. For this a rate of the order of events/day is needed. Note that this is true as far as the statistical uncertainty only is concerned, without including possible systematical effects that can only worsen the sensitivity.
Gamma spectroscopy offers a powerful and simple method to investigate the stability of nuclear decay rates. As a matter of fact, there is a wide choice of radioactive isotopes, half lives, gamma ray energies, source dimensions and physical forms (point-like or extended). Moreover, with a gamma ray detector of good energy resolution, like germanium or sodium iodide crystals, it is possible to identify the emitters and in most cases also the origin of the background.
The typical experimental configuration that we adopted is the following: a radioactive source that illuminates a detector, an electronic chain that processes the signal, a multichannel analyzer that produces an energy spectrum, saved by an acquisition system at fixed intervals of time. The source/detector assembly is surrounded by a heavy lead shielding in order to suppress the external gamma background. Cosmic rays are an unavoidable background source that cannot be suppressed with any realistic amount of lead or other shielding material. In addition, their flux is not constant in time, giving a serious limit to the investigation of subtle variations in nuclear decay rates as the ones we are interested in. The solution we choose to avoid such a background in the 232Th experiment is to install the experiment deep underground in the Gran Sasso Laboratory. The mountain shield suppresses the muon and neutron flux by six and three orders of magnitude, respectively, as compared to the above ground.
In the measurements described in the following sections we consider the entire energy spectrum and not only the full energy peaks. This because we want to avoid any inaccuracy coming from the fitting procedure and we also want to increase the total rate in order to improve the statistics. This procedure requires the definition of lower and upper boundaries. Since the content of the energy spectrum above 3 MeV is negligible, the only delicate point is the stability of the lower threshold that should be low enough to collect the entire spectrum and high enough to be well above the electronic noise. Note that if the low energy threshold is sufficiently low and placed inside a flat region of the spectrum then it is also less sensitive to the variation of the global gain of the electronic chain. Spectra are collected at fixed intervals (1 hour or 1 solar day), with the timing for data acquisition provided by the internal quartz oscillator of the acquisition card. Its precision and stability (better than 10 ppm/year) are enough for our purposes.
Sources can have different configurations, point-like or extended. In the case of point-like sources it is essential to keep its position fixed as well as the distance between the source itself and the detector. As a matter of fact, a variation of only 1 micron in the distance gives rise in one of our typical set-ups to a change in the detection efficiency of about 510-5 . In addition to the mechanical stability of the source support, it is also necessary to avoid large temperature and atmospheric pressure fluctuations, that can modify the source-detector distance. The typical length variation with temperature in metals is of the order of 20 ppm per degree. As a consequence, a moderate thermal stabilization is needed to avoid spurious effects on the rate. The location of our experimental setups in underground laboratory or in the basement of above ground buildings represents a well acceptable solution. In any case, temperature and pressure are monitored. On the other hand, the selection of an extended source, if possible, makes all the above discussed requests much less severe.
Once collected, spectrum data are averaged over a period of 1 day (or larger if necessary) and then fitted with the expected curve, normally an exponential, unless the source has not yet reached the secular equilibrium. The presence of effects due to unknown systematics and/or non standard behaviors can be indicated by bad chi squared values of the fit. Finally, time modulations of the rate are searched for with the Fourier transform method applied to the residuals or with the minimization of the chi squared fit of the residuals with a cosine function of time. As a matter of fact, Fourier transform can be rigorously applied only when searching for periods significantly smaller than the counting time. In particular, we have chosen a limit equal to one third of the run time.
3 The 40K experiment
The detector, a 3”x3” NaI crystal, is installed above ground, in the basement of one of the LNGS buildings. The source is made by about 16 kg of potassium bicarbonate powder (KHCO3, corresponding to 6.24 kg of natural potassium) contained inside a stainless steel box placed around the detector. The whole set-up is shielded by at least 10 cm of lead and the electronic signals are processed by an Ortec Digibase (shaping time: 0.75 s).

The intrinsic background, measured in similar conditions, but without the powder inside the box, gives a rate of 2.4 s-1 in the energy window 15-3500 keV. The contribution to the background due to cosmic rays has been measured by comparing the spectra obtained with a lead shielded 3”x3” NaI crystal placed first close to the 40K set-up and then underground in the Gran Sasso laboratory (Figure 1). It amounts to 0.997(5) s-1, to be compared with 788 s-1 due to the potassium source.The underground spectrum is below the above ground one at any energy, in particular the line at 511 keV due to positron annihilation is absent underground. We observe that electrons from beta decay give rise to bremsstrahlung photons which can be detected by the sodium iodide crystal in addition to the ones from electron capture decay. We have evaluated by Monte Carlo simulation that the bremsstrahlung photons, because of the absorption in the 1.5 mm thick stainless steel box containing the salt and in the 0.5 mm thick aluminum body around the crystal, give a contribution of, at most, 5 to the rate. This contribution is confined to the gamma energy region below 300 keV.
Spectra are stored once per hour with a relative dead time of 3.5410 -3, which has a fluctuation of 1.510 -5, at most. During the 700 days of data taking we measured a peak position shift (proportional to the channel number) of at most 14 channels for the 40K peak at 1461 keV energy. This shift is due both to the high voltage drift and to the temperature variation (at most 6 degrees, slowly changing with time).

The rate is shown in Figure 2. We see that there is an increase up to 0.3 s-1, corresponding to less than 4 10-4, during the first 4 months of the experiment, followed by a decrease of 0.2 s-1 in the next 2 months. Afterwards the rate stays constant in time for more than 500 days. The behavior in the first 200 days of data taking is due, in our opinion, to two processes in competition: the settlement of the powder inside the steel box, that increase the detection efficiency, and the capture of water by the potassium salt, slightly hygroscopic, that decreases the efficiency due to the increase of the average density of the extended source and of its self absorption (the box containing the powder is closed but not hermetically sealed). As a matter of fact, when we opened the box containing the salt at the end of the experiment we saw that the salt, originally a crystalline powder, had become a unique solid body with a volume reduction of about 1.5. This volume reduction, together with the water absorption, gave rise to the detection efficiency change responsible for the non constant rate during the first 200 days of the experiment. In the following analysis we refer only to the data taken starting from day 200. We do not consider to do any dead time correction to the data but we do apply a correction to the content of the first bin due to the peak position shift (0.005 at most). The rate as function of time, when fitted with a constant and using as uncertainty the linear sum of the Poisson fluctuation (1.210-4 relative uncertainty) plus the fluctuation of the live time (710-6 relative uncertainty) gives a chi squared per degree of freedom, , of 1.08.
Figure 3 shows the results of the Fourier transform of the residuals, for periods from 3 to 150 days, and of the chi-squared analysis for longer periods: there is a clear modulation for a period of 1 year with an amplitude of 4.50.810-5 and maximum at August 11th ( 13 days). It corresponds to a 3.5 modulation of the cosmic ray background we measured and it is well compatible both in size and in phase with the known annual modulation of the cosmic ray flux at the Earth surface, which we must see because of the sensitivity of our experiment. The inclusion of this oscillating component into the fit lowers the to 1.03. On the other hand, any oscillation with period different from 1 year and with amplitude larger than 2.610-5 is excluded at 99.7 C.L. independently of the phase.

If, for sake of completeness, we consider the entire data taking period, including also the first 200 days, we can in any case exclude a maximum variation of the rate larger than 3 10-4 without any evident periodicity, as shown in Figure 2.
4 The 232Th experiment
The activity of a Thorium source (alpha and beta decay) is measured with a 3”x3” NaI crystal installed deep underground in the STELLA facility (SubTerranean Low Level Assay) of LNGS. As a consequence, the background due to cosmic rays and neutrons is strongly suppressed. The source is obtained from an optical lens, made by special glass heavily doped with Thorium Oxide. Note that this technique, used for improving the optical properties of glass, was quite common until the seventies. The lens is placed close to the crystal housing. Both the lens and the NaI detector are shielded with at least 15 cm of lead. The electronic chain consists of a PMT base with a preamplifier, a SILENA amplifier (shaping time: 0.5 s) and a MCA Canberra Multiport II.

The intrinsic background rate above the 10 keV threshold is of 2.3 s-1 (due to 40K, thorium and uranium chains and lead X-rays) to be compared to 3171 s-1 from the source. Spectra (Figure 4) are stored once per day with a dead time of about 1.3 . During the 480 days of data taking we measured a peak position shift (proportional to the channel number) which is at most of 15 channels for the 208Tl peak at 2615 keV energy. The rate is shown in Figure 5. We see that the chain is not in equilibrium since there is a rate increase of over a time period of 1 year. The time dependence of the rate is well described by the equations ruling the recovery of secular equilibrium [18], as shown by the continuous line in Figure 5. This is consistent with the glass of the lens being produced 38 years ago, when the removal of 228Ra (isotope of the thorium chain with half-life of 5.75 years) took place.

We searched for time modulations without applying any dead time correction to the data. As a matter of fact, the expected rise of dead time in 1 year (about 2.410-5) due to the non-equilibrium of the chain is not affecting our time modulation search. Figure 6 shows the results of the Fourier transform of the residuals, up to a period of 150 days, and of the chi-squared analysis for longer periods. There is a significant period, 300 days, with amplitude of 410-5. However, the same period is present, with an amplitude of 210-2, in the daily averaged dead time per event, obtained from the multichannel analyzer, which, on the contrary, should stay constant. The modulation of the rate and of the daily averaged dead time per event have the same period and opposite phase. We attribute this effect, which is the intrinsic limit of the measurement, to the instabilities of the RC circuit providing the shaping time of the amplifier. As a matter of fact, a not well fixed shaping time gives rise to a variable duration of the veto signal and, as a consequence, to a variable number of rejected pile-up events. For comparison, the fluctuations of the dead time per event measured in the potassium experiment, where a different electronic chain is used, are smaller by a factor 10 and do not show any periodicity.

Therefore, we consider the 300 day modulation to be a systematic effect and, in spite of the excellent statistical uncertainty of 510-6, we can only exclude any oscillation with period smaller than 1 year and amplitude larger than 410-5, being this the size of our largest systematic uncertainty.
5 Source activity during the X-class solar flares of May 2013
Solar flares are explosions on the Sun that happen when energy stored in twisted magnetic fields (usually above sunspots) is suddenly released. This energy, up to one hundredth of the solar luminosity, is released within a few minutes to tens of minutes. In this interval the plasma is heated to tens of millions of degrees with a strong X-ray emission together with electron and proton acceleration (up to several tens and hundreds of MeV, respectively). Solar flares are classified according to the power of the X-ray flux peak near the Earth as measured by the GOES-15 geostationary satellite: X identifies the class of the most powerful ones, with a power at the peak larger than 10-4 W/m2 (within the X-class there is then a linear scale).
In [19] a significant dip (up to 410-3, 7 effect) in the count rate, averaged on a time interval of 4 hours, has been observed in the activity of a 1 Ci source of 54Mn (electron-capture) in coincidence with the X-class solar flares from December 2nd 2006 to January 1st 2007. On the other hand, a different experiment with a 10-3 sensitivity, carried out by Parkhomov [7], did not observe any deviation in the activity of 60Co, 90Sr-Y and 239Pu sources in coincidence with the same flares.
We have already published results [20] from the data we took with the 40K, 137Cs and 232Th sources during the two strongest solar flares of the years 2011 and 2012 (X5.4 and X6.9). Very briefly, no significant deviations from standard expectation have been observed, with a sensitivity of 10-4 per day. Here we give the results obtained by studying the activity of the 40K and 232Th sources in correspondence with the 4 X-class solar flares solar which took place between the 13th and the 15th of May 2013 (X1.7, X2.8, X3.2 and X1.2).
Figure 7 shows the data collected in a 20 day window centered on the 14th of May 2013 (the day is given in terms of the Modified Julian Date). The X-ray peak flux is plotted in linear scale and given in W/m2, in the 0.1-0.8 nm band measured by the GOES-15 satellite [21]. Inside the two bands are plotted the residuals of the normalized count rate of the 40K and 232Th sources (i.e. the difference between the measured and expected count rate divided by the measured one), averaged over a period of 1 day. The error bars are purely statistical. Systematic uncertainties are negligible as compared to the statistical ones during a data taking period of a few days only. For the 232Th data a linear trend (5.7 ppm/day), due to the recovering of the secular equilibrium, is subtracted.
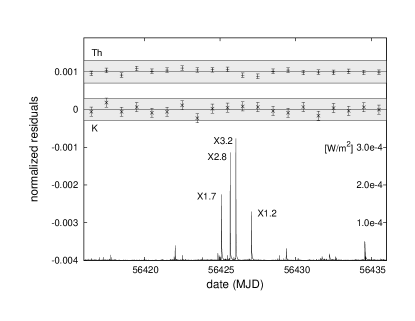
Our data clearly exclude an effect as large as the one reported in [19], of the order of a few per mil per day and lasting several days, and confirm the same results as in [20]. In particular, the maximum effect compatible with our data is smaller than per day at C.L. for the 4 X-class flares of May 2013. Such a limit is obtained by taking twice the statistical uncertainty.
6 Conclusions
Recently, various experiments have reported evidence of a time dependence of the radioactive nuclei decay constant with period, in most cases, of one year and amplitude at the per mil level. In particular, the annual modulation has been correlated to the change of the Sun-Earth distance between aphelion and perihelion. In the Gran Sasso Laboratory we performed two experiments to search for modulations in the electron-capture decay of 40K and in the decay chain of 232Th (alpha and beta decay).
In the decay rate of 40K we measured a relative annual modulation of 4.50.810-5. However, the 40K experiment was located above ground and the measured effect is well compatible with the annual modulation of the cosmic ray flux (3.5 amplitude of the cosmic ray background and maximum in July-August). Any oscillation with period lower than 1 year and with amplitude larger than 2.610-5 is excluded at 99.7 C.L. independently of the phase.
On the contrary, the 232Th experiment was located underground. The analysis of the thorium data excludes with a 410-5 sensitivity any oscillation with period shorter than 1 year independently of the phase.
Finally, the gamma activity of 40K and 232Th have been measured during the occurrence of the 4 strong X-class solar flares of May 2013. No significant deviations from expectations have been observed.
Acknowledgments
We thank the Director and the staff of LNGS together with Prof. R.Battiston, Dr. C.Cattadori and Dr. L.Pandola for their continuous support.
Appendix A Constraints from variations of fundamental constants
An annual time modulation of nuclear decay constants could be explained by the presence of a new interaction mediated by a scalar field sourced by the Sun [2, 5]. In this appendix we discuss this scenario, showing that existing bounds on the Weak Equivalence Principle (WEP) and on the stability of atomic clocks (for a review, see [22] ) already exclude this explanation.
The orbital motion of the Earth around the Sun would induce an annual modulation of the fundamental parameters entering the nuclear rate , which would in turn exhibit a variation given by
| (1) |
where the are the fundamental parameters entering the rate. In the following, we will consider the dependence on , and on the Fermi constant, , i.e. .
A.1 Dependence on
Consider the decay
| (2) |
The decay rate is governed of the penetration of the Coulomb barrier described by Gamow theory, and well approximated by
| (3) |
where is the escape velocity of the particle and is a function that depends mildly on and . It follows that the variation of the decay rate with respect to the fine structure constant is well approximated by [22]
where
and is the decay energy. As an example, for the U decay () the sensitivity is .
In a decay the sensitivity to can be written as [22]
| (4) |
where and
| (5) |
For the decay of Rb, , one gets . The strongest constraints on the stability of from laboratory experiments comes from the comparison of Rubidium and Cesium atomic clocks. Since they are working on different transitions, the parametric dependences on of the frequency of the clocks are different, and the absence of drift poses upper bounds on the variation of . The clocks were observed over a period of 20 months, leading to the bound [23]
| (6) |
Using eq. 1 and the sensitivities of the previous subsection, we get an extremely suppressed value
| (7) |
A.2 Dependence on
The rate for decay is proportional to , therefore the sensitivity in this case is simply given by
| (8) |
A variation of can be induced by varying the Higgs expectation value (VEV), . A variation of the Higgs VEV, would manifest itself in an annual variation of the electron to proton mass ratio , and consequently of spectral lines, of the same amount. Variations of this kind are bounded by atomic clocks, as discussed in the previous subsection. The best bound comes from comparing cesium atomic clocks with superconducting microwave cavities oscillator. The frequency of the cavity-controlled oscillators was compared during 10 days to that of cesium. The relative drift rate was [22], which, extrapolated to an annual timescale, gives and then, using 8,
| (9) |
Our analysis clearly excludes a scalar field from the Sun as a possible origin of a modulation of the nuclear decay rate with a per mil amplitude and, as a consequence, a different mechanism would have to be found to explain the reported evidence, if it were confirmed.
References
- [1] M. Curie, Doctoral Dissertation, Sorbonne University, Paris (1903).
- [2] J. H. Jenkins, E. Fischbach, J. B. Buncher, J. T. Gruenwald, D. E. Krause and J. J. Mattes, Astropart. Phys. 32, 42 (2009). [arXiv:0808.3283 [astro-ph]].
- [3] H.Siegert et al., Appl. Radiat. Isot. 49 1397 (1998).
- [4] D.E. Alburger et al., Earth an Planetary Science Lett. 78 168 (1986).
- [5] E. Fischbach, J. H. Jenkins and P. A. Sturrock, arXiv:1106.1470 [nucl-ex].
- [6] R.J. de Meijer, M. Blaauw and F.D. Smit, Appl. Rad. and Isotopes 69, 320 (2011).
- [7] A. G. Parkhomov, arXiv:1004.1761 [physics.gen-ph].
- [8] D. Javorsek II, P. A. Sturrock, R. N. Lasenby, A. N. Lasenby, J. B. Buncher, E. Fischbach, J. T. Gruenwald and A. W. Hoft et al., Astropart. Phys. 34, 173 (2010) [arXiv:1007.0924 [nucl-ex]].
- [9] D.P. Veprev and V. I. Muromtsev, Astropart. Phys. 36, 26 (2012).
- [10] J. C. Hardy, J. R. Goodwin and V. E. Iacob, Appl. Radiat. Isot. 70, 1931 (2012) [arXiv:1108.5326 [nucl-ex]].
- [11] P. S. Cooper, Astropart. Phys. 31, 267 (2009) [arXiv:0809.4248 [astro-ph]].
- [12] E. B. Norman, E. Browne, H. A. Shugart, T. H. Joshi and R. B. Firestone, Astropart. Phys. 31, 135 (2009) [arXiv:0810.3265 [astro-ph]].
- [13] H. Schrader, Appl. Rad. and Isotopes 68, 1583 (2010).
- [14] K. Bikit, J. Nikolov, I. Bikit, D. Mrda, N. Todorovic, S. Forkapic, J. Slivka and M. Veskovic, Astropart. Phys. 47, 38 (2013).
- [15] J. H. Jenkins, E. Fischbach, D. Javorsek, II, R. H. Lee and P. A. Sturrock, Appl. Radiat. Isot. 74, 50 (2013) arXiv:1211.2138 [nucl-ex].
- [16] E. Bellotti, C. Broggini, G. Di Carlo, M. Laubenstein and R. Menegazzo, Phys. Lett. B 710, 114 (2012) [arXiv:1202.3662 [nucl-ex]].
- [17] Y. .A. Baurov, A. A. Konradov, V. F. Kushniruk, E. A. Kuznetsov, Y. .V. Ryabov, A. P. Senkevich, Y. .G. Sobolev and S. V. Zadorozsny, Mod. Phys. Lett. A 16, 2089 (2001) [hep-ex/0105009].
- [18] C. Arpesella, E. Bellotti, L. Miramonti and P. P. Sverzellati, Nucl. Instrum. Meth. A 372, 415 (1996).
- [19] J. H. Jenkins and E. Fischbach, Astropart. Phys. 31, 407 (2009) [arXiv:0808.3156 [astro-ph]].
- [20] E. Bellotti, C. Broggini, G. Di Carlo, M. Laubenstein and R. Menegazzo, Phys. Lett. B 720, 116 (2013) [arXiv:1302.0970 [nucl-ex]].
-
[21]
Space Weather Prediction Center
http://www.swpc.noaa.gov/index.html. - [22] J. -P. Uzan, Rev. Mod. Phys. 75, 403 (2003) [hep-ph/0205340].
- [23] J. D. Prestage, R. L. Tjoelker and L. Maleki, Phys. Rev. Lett. 74, 3511 (1995).