Currently with ]The National Research Institute of Electronics and Cryptology, The Scientific and Technological Research Council of Turkey, Gebze 41400, Turkey Currently with the ]Department of Mechanical Engineering, Worcester Polytechnic Institute, 100 Institute Road, Worcester, MA 01609-2280
optomechanical crystals in the resolved-sideband regime
Abstract
We demonstrate sideband-resolved optomechanical crystals supporting quality factor optical modes at 980 nm, coupled to GHz frequency mechanical modes with quality factors of . Optomechanical electromagnetically induced transparency and absorption are observed at room temperature and in atmosphere with intracavity photon numbers of the order of .
pacs:
78.55.-m, 78.67.Hc, 42.70.Qs, 42.60.DaSilicon optomechanical crystals (OMCs) have been used to demonstrate important steps on the road to performing chip-scale quantum mechanical operations with individual phonons of a mesoscopic object. In Safavi-Naeini et al. (2011), coherent interaction between cavity photons and phonons was used to demonstrate electromagnetically induced transparency (EIT) mediated by a mechanical resonance; radiation-pressure cooling of one OMC mechanical resonance to its ground state was shown in Chan et al. (2011). Silicon OMCs are characterized by several properties that have enabled these demonstrations. They support co-localized GHz mechanical and near-infrared optical resonances that interact via radiation pressure, with large zero-point optomechanical coupling rates () between cavity photons and phonons. High quality factor () optical resonances can be achieved, with linewidth smaller than the few-GHz mechanical resonance frequency . This places the system in the resolved-sideband regime (, ), in which efficient radiation-pressure dynamical back-action effects can be observed Kippenberg and Vahala (2008). Lastly, mechanical resonances with high quality factors () are achievable, necessary for pronounced optomechanical interactions, as quantified by the cooperativity parameter ( is the intracavity photon number and is the mechanical linewidth). Large is necessary for effective laser cooling Kippenberg and Vahala (2008); Chan et al. (2011) and coherent photon-phonon exchange Safavi-Naeini and Painter (2011); Verhagen et al. (2012), and is achieved in Si OMCs due to their aforementioned small , small , and large . also scales linearly with the intracavity photon population, and thus large provides another route to appreciable , as observed in systems such as silica microtoroids Verhagen et al. (2012) and superconducting cavity electromechanical circuits Teufel et al. (2011). This strategy has found limited use in Si OMCs because of silicon’s large two-photon absorption coefficient, which leads to reduced for large .
As an alternative to Si, is a potentially advantageous material for OMCs: it does not exhibit two-photon absorption at relevant wavelengths; like Si, it lends itself to chip-scale nanofabrication with mature techniques; stoichiometric films under tensile stress have been shown to support high optical and mechanical s ( Verbridge et al. (2008); Bauters et al. (2011)); and is transparent over the visible and near-infrared bands, contrasting with Si, which is opaque below 1 m. The latter is crucial for interaction with a variety of quantum optical systems that operate at shorter wavelengths, such as semiconductor quantum dots, single molecules in organic crystals, nitrogen-vacancy defects in diamond, and trapped atoms and ions.
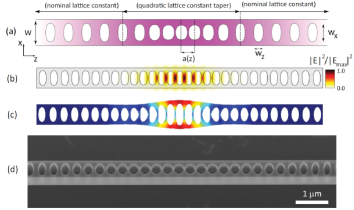
Here, we design and experimentally investigate -based OMCs in the resolved-sideband limit for light in the 980 nm wavelength range. The sideband resolution achieved was sufficient for observing, at room temperature and atmospheric pressure, EIT mediated by a GHz mechanical mode. Our OMC consists of a suspended nanobeam of thickness nm and width nm, with an etched array of elliptical holes as shown in Fig. 1(a). In the outer mirror sections, the spacing between the holes is constant, while within the cavity section, it varies quadratically from the center outwards. The cavity section forms a defect in an otherwise perfect 1D photonic bandgap structure. The lattice modulation is designed to support localized, high () transverse-electric (TE, with on the plane) optical modes in the 980 nm band, co-located with breathing-type mechanical resonances at GHz (respectively shown in Figs. 1(b) and (c)). Figure 1(d) shows a scanning electron microscope (SEM) image of a nanofabricated device, where it is clear that, in addition to the lattice spacing modulation, the aspect ratio of the holes is adjusted from the cavity region outwards. As detailed below, the design procedure leading to this final geometry involved finite-element method determination of optical and mechanical resonances and the optomechanical coupling rate due to radiation-pressure. The latter was calculated from modal electromagnetic field and mechanical displacement profiles via a first-order perturbative expression described in the supplement ref , which only takes into account the moving-boundary contribution to the optomechanical coupling. Contributions from stress-induced changes of the refractive index (photoelastic effect) were not considered although they may be as significant as those in crystalline silicon nanostructures Chan et al. (2012); Rakich et al. (2012).
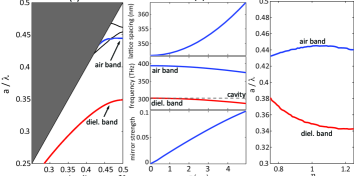
We next detail our design procedure. TE Photonic bands for a 1D nanobeam photonic crystal are shown in Fig. 2(a). Modes on the dielectric and air bands are of fist order in the transverse () direction (black lines correspond to higher transversal order modes). Parameters for the cavity section of the OMC (see Fig. 1(a)) were obtained iteratively as follows. For fixed thickness nm and aspect ratio , and an initial guess for the width , a lattice constant was selected such that the edge of the dielectric band at the point () fell close to the desired resonance wavelength. The width was varied, the -point dielectric band edge was recalculated, the lattice constant was adjusted, and the procedure was repeated until convergence of the dielectric band edge to the desired wavelength was reached. Once the lattice constant for the cavity section was determined, the effect of varying this parameter along the OMC (in the direction) was evaluated. As shown in Fig. 2(b), increasing the lattice constant along while keeping all other dimensions fixed causes the dielectric band edge to red-shift, creating the condition for optical confinement by the photonic bandgap: the lattice constant is increased quadratically from the cavity center () towards the edges, so that the allowed frequency at (dashed line) falls within the bandgap of the outer regions (e.g., ). The cavity can also be regarded as a distributed reflector with a locally varying, distributed reflectivity as in the bottom panel in Fig. 2(b), which is close to linear near . Linear mirror strength profiles ref tend to produce optical modes with reduced spatial harmonics above the light line. This leads to reduced power leakage into the air, and thus higher optical quality factors Quan and Loncar (2011); Srinivasan and Painter (2002). Confined modes with optical quality factors in excess of were obtained simply with the lattice profile of Fig. 2(c) and . We note that, because has a considerably smaller refractive index than Si (2.0 in contrast with 3.5), the achievable local reflectivities are correspondingly smaller, and thus in general the number of unit cells necessary for a high cavity is larger, and so are the obtained mode volumes.
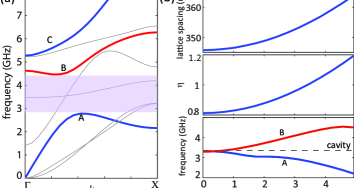
The resulting 1D photonic crystal geometries support a phononic bandgap that is used to generate a localized mechanical mode. The band structure for the crystal shown in Fig. 2(a) is plotted in Fig. 3(a), for a lattice constant nm. Thick lines indicate spatially symmetric displacement across the - and - -planes, gray lines to other symmetries. A phononic bandgap exists between the A and B bands (shaded region). Near the -point, modes on the band B (red line) have a displacement pattern that gives rise to breathing resonances where the outer nanobeam walls expand or contract symmetrically. We found that the quadratic lattice constant modulation was insufficient to produce a well-confined mechanical mode, yielding only a relatively small shift of the mechanical bands. To overcome this, we allowed the minor and major radii of the elliptical holes to vary along the cavity as , with quadratic (Fig. 3(b) (middle)). This causes the strong modulation of the edges of bands A and B, see in Fig. 3(b) (bottom), so allowed frequencies at (cavity center) fall within the phononic bandgap of the outer regions (). The breathing mode frequency is indicated with a dashed line in Fig. 1(c). The profile of Fig. 3(b) was obtained with a nonlinear optimization routine that sought to maximize the optomechanical coupling rate , while keeping the optical quality factor above . The hole aspect ratio modulation does cause the photonic band edges to shift as shown in Fig. 2(c). High optical modes can still be found, albeit at frequencies shifted from the original. The optimized OMC design yielded kHz () for an optical mode at nm.
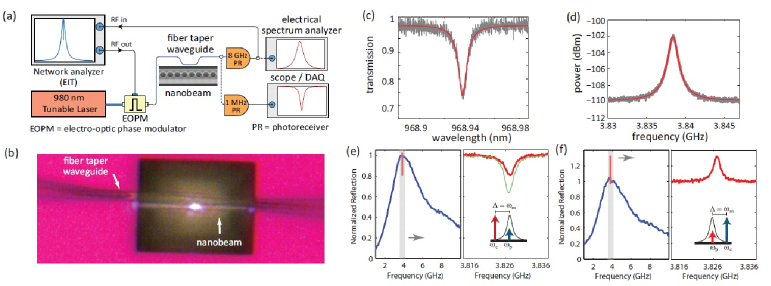
Devices were fabricated on stoichiometric (tensile stress of MPa) with electron-beam lithography and reactive ion etching with a CHF3:O2:Ar mixture. Suspended nanobeams were obtained by etching the underlying Si substrate with KOH. Fabricated devices were initially characterized with optical transmission spectroscopy (Fig. 4(a)). Light from a tunable external cavity diode laser was coupled to the devices using an optical fiber taper waveguide (FTW), as in Fig. 4(a). A polarization controller before the FTW allowed coupling to TE cavity modes to be maximized. The laser wavelength was swept and the signal transmitted through the FTW was detected and recorded, revealing optical resonances in the 980 nm band with (Fig. 4(c)). Mechanical modes coupled to a particular optical resonance were measured at low optical power by tuning the laser wavelength to the shoulder of the optical mode. Resonance fluctuations induced by thermal-noise-driven mechanical motion were converted to an intensity modulation of the transmitted optical signal. The transmitted optical signal was detected with an avalanche photodiode (APD) and the electrical signal was resolved in a spectrum analyzer. A typical spectrum showing a peak due to the fundamental breathing mechanical mode at GHz is shown in Fig. 4(d). With a quality factor at atmosphere, the frequency- product is , twice that observed in vacuum and at 8K in ref.Liu et al. (2013). The high mechanical frequency ensures that the system is in the resolved-sideband regime ().
The typical sideband resolution achieved was sufficient for the observation of optomechanical EIT at room temperature and atmospheric pressure. This effect corresponds to the creation of a narrow transparency window in the optical transmission spectrum (and, correspondingly, a dip in reflection) by pumping the optical cavity at a red-detuned frequency from the cavity center. It is a macroscopic manifestation of the coherent interaction between cavity photons and phonons, as it stems from the destructive interference between an incident probe signal and anti-Stokes pump photons scattered by the mechanical resonance. Optomechanical EIT has been observed in many systems, including silica microtoroids Weis et al. (2010) and microspheres Dong et al. (2012), Si OMCs Safavi-Naeini et al. (2011), and microdisks Liu et al. (2013), though these previous demonstrations were typically done in vacuum (and in many cases, at cryogenic temperatures).
To measure this effect, an electro-optic phase modulator was used to produce sidebands on a continuous wave (CW) control beam. With the control field fixed at a frequency , away from the optical resonance at , the modulation frequency was varied over the range 100 MHz to 20 GHz, which allowed the sidebands to scan over the entire optical resonance. As detailed in ref , detection of the modulated signal with the 8 GHz photoreceiver and demodulation in a vector network analyzer produced the cavity reflectivity spectra in Fig. 4(e). The left panel of Fig. 4(e) shows the reflection spectrum over a broad frequency range, indicating an optical cavity FWHM of GHz. The red portion of the curve is the superimposed spectrum shown on the right panel, where the reflectivity dip due to EIT is clearly evident. Figure 4(f) shows the same for a blue-detuned pump. Here, optomechanical electromagnetically induced absorption (EIA) manifests itself as a peak in reflection, corresponding to constructive interference between the probe and Stokes-scattered pump photons. Assuming ( is the mechanical frequency), a cooperativity was estimated via a fit to the EIT and EIA spectra ref . From the transmission spectrum and control laser detuning , we estimate an intracavity photon population of , and thence, an optomechanical coupling rate kHz kHz ref , higher than the theoretical kHz (uncertainties are of one standard deviation). The discrepancy is possibly due to geometrical variations between the fabricated device and the simulated model. Another possibility is the existence of a constructive elasto-optic contribution Chan et al. (2012), which is not included in our model.
Linear absorption in the leads to a red-shift of the optical resonance frequency (thermo-optic effect) which increases with cavity photon number and results in a bistable dynamic behavior Barclay et al. (2005). At sufficiently high powers, the shift reaches an unstable maximum, and the cavity snaps back to its original frequency. In recent work with microdisks Liu et al. (2013), these issues were mitigated by cryogenic cooling and actively locking the pump laser to the cavity. The achieved was nevertheless limited to 0.5 in spite of the larger intracavity photon number () and higher optical and mechanical quality factors (, ) than here. This was due to the optomechanical coupling rate, kHz, lower than in the OMC. This comparison indicates that high is of practical importance, offsetting the effects of limited sideband resolution, mechanical quality factor, and thermo-optic dispersion. Here, achieving significantly higher and under CW pumping was limited by thermo-optic cavity dispersion and instability. To mitigate this, we performed EIT measurements with a pulsed pump ref , and were able to reach a maximum population of ( that for CW). A maximum was observed (green curve in Fig. 4(e)). Evidence of nonlinear absorption was also observed. ref
In summary, we have designed a -based nanobeam optomechanical crystal supporting optical resonances in the nm wavelength band and breathing mechanical modes in the 4 GHz range, with relatively high optomechanical coupling rates ( kHz). With high mechanical frequencies, nanobeam cavities with optical quality factors of were operated in the sideband resolved regime, and were used to demonstrate electromagnetically induced transparency and absorption at room temperature and atmospheric pressure, with intracavity photon numbers on the order of . The observed mechanical frequency- product was . Moving towards - as necessary for e.g., quantum level photon-phonon translation Safavi-Naeini and Painter (2011) - our results suggest that strategies for producing enhanced zero-point optomechanical coupling rates, such as slot-mode type OMCs Davanço et al. (2012) can be advantageous for devices, which, unlike silicon devices, are able to support large intracavity photon numbers () before starting to show signs of nonlinear absorption. Other wide bandgap materials, including AlN Fan et al. (2013) and GaP Mitchell et al. (2013) (which has refractive index 3) are promising candidates as well.
We thank Vladimir Aksyuk and Oskar Painter for helpful discussions. This work was partially supported by the DARPA MESO program. S.A. acknowledges support under the Cooperative Research Agreement between the University of Maryland and NIST-CNS,T Award 70NANB10H193. Y. L. acknowledges support under the NIST-ARRA Measurement Science and Engineering Fellowship Program Grant No. 70NANB10H026 through the University of Maryland.
References
- Safavi-Naeini et al. (2011) A. H. Safavi-Naeini, T. P. M. Alegre, J. Chan, M. Eichenfield, M. Winger, Q. Lin, J. T. Hill, D. E. Chang, and O. Painter, Nature (London) 472, 69 (2011).
- Chan et al. (2011) J. Chan, T. P. M. Alegre, A. H. Safavi-Naeini, J. T. Hill, A. Krause, S. Gröblacher, M. Aspelmeyer, and O. Painter, Nature (London) 478, 89 (2011).
- Kippenberg and Vahala (2008) T. J. Kippenberg and K. J. Vahala, Science 321, 1172 (2008).
- Safavi-Naeini and Painter (2011) A. H. Safavi-Naeini and O. Painter, New Journal of Physics 13, 013017 (2011).
- Verhagen et al. (2012) E. Verhagen, S. Deléglise, S. Weis, A. Schliesser, and T. J. Kippenberg, Nature 482, 63 (2012).
- Teufel et al. (2011) J. D. Teufel, D. Li, M. S. Allman, K. Cicak, A. J. Sirois, J. D. Whittaker, and R. W. Simmonds, Nature 471, 204 (2011).
- Verbridge et al. (2008) S. S. Verbridge, H. G. Craighead, and J. M. Parpia, Applied Physics Letters 92, 013112 (2008).
- Bauters et al. (2011) J. F. Bauters, M. J. R. Heck, D. John, D. Dai, M.-C. Tien, J. S. Barton, A. Leinse, R. G. Heideman, D. J. Blumenthal, and J. E. Bowers, Opt. Express 19, 3163 (2011).
- (9) See Supplementary Material for details on simulations, fabrication, experimental setups and data analysis.
- Chan et al. (2012) J. Chan, A. H. Safavi-Naeini, J. T. Hill, S. Meenehan, and O. Painter, Applied Physics Letters 101, 081115 (2012).
- Rakich et al. (2012) P. T. Rakich, C. Reinke, R. Camacho, P. Davids, and Z. Wang, Phys. Rev. X 2, 011008 (2012).
- Quan and Loncar (2011) Q. Quan and M. Loncar, Opt. Express 19, 18529 (2011).
- Srinivasan and Painter (2002) K. Srinivasan and O. Painter, Opt. Express 10, 670 (2002).
- Liu et al. (2013) Y. Liu, M. Davanço, V. Aksyuk, and K. Srinivasan, Phys. Rev. Lett. 110, 223603 (2013).
- Weis et al. (2010) S. Weis, R. Rivière, S. Deléglise, E. Gavartin, O. Arcizet, A. Schliesser, and T. J. Kippenberg, Science 330, 1520 (2010).
- Dong et al. (2012) C. Dong, V. Fiore, M. Kuzyk, and H. Wang, Science 338, 1609 (2012).
- Barclay et al. (2005) P. Barclay, K. Srinivasan, and O. Painter, Opt. Express 13, 801 (2005).
- Davanço et al. (2012) M. Davanço, J. Chan, A. H. Safavi-Naeini, O. Painter, and K. Srinivasan, Opt. Express 20, 24394 (2012).
- Fan et al. (2013) L. Fan, X. Sun, C. Xiong, C. Schuck, and H. X. Tang, Applied Physics Letters 102, 153507 (2013).
- Mitchell et al. (2013) M. Mitchell, A. C. Hryciw, and P. E. Barclay, arXiv:1309.6300 (2013).
SUPPORTING INFORMATION
Computational Models
Photonic crystal band structures were obtained with the plane-wave expansion method, using supercells in the (lateral) and (vertical) directions. Optical resonant modes were calculated by solving the vector eigenvalue wave equation for the electric field with the finite element method. Vector edge elements were used, and a radiation boundary condition at the outer edges to simulate open space. Due to the radiative boundary conditions, the frequency was complex, which allowed the calculation of the optical quality factor as .
Mechanical resonances were obtained by solving the elastic wave equation for mechanical displacement, assuming to be an isotropic material Eichenfield et al. (2009a) and the two ends of the nanobeam to be perfectly clamped.
1D photonic crystal mirror strength
The effective mirror strength for the 1D photonic crystal lattice, mentioned in the main text, corresponds to the imaginary part of the Bloch wavenumber for bandgap frequencies at the Brillouin zone edge, . From 1D first order perturbation theory,
| (S1) |
where are the dielectric and air band edges at the Brillouin zone boundary, and is the midgap frequency. Linear mirror strength profiles tend to produce optical modes with reduced spatial harmonics above the light line. This leads to reduced power leakage into the air, and thus higher quality factors Quan and Loncar (2011); Srinivasan and Painter (2002).
Optomechanical coupling
The shift in the frequency of a particular optical resonance due to displacement of the nanostructure boundaries produced by a mechanical resonance at frequency is quantified by the optomechanical coupling ; here, is the cavity boundary displacement and is an effective optomechanical interaction length Eichenfield et al. (2009b). The effective length can be estimated via the perturbative expression
| (S2) |
Here, and are the modal electric and electric displacement fields, respectively, , , and and are the permittivities of the nanobeam material and air, respectively. The mass displacement due to the mechanical resonance is given by , and the normal surface displacement at the structure boundaries is , where is the surface normal. The integral in the denominator is performed over the entire surface of the nanostructure.
The optomechanical coupling was converted into the coupling rate between photons and phonons by , where is the zero point fluctuation amplitude for mechanical displacement and is the motional mass of the mechanical resonance at frequency . The motional mass was obtained from the displacement and the nanobeam material density by Safavi-Naeini and Painter (2011).
Device fabrication
On a silicon substrate, a 350 nm thick stoichiometric layer of Si3N4 was grown by low pressure chemical vapor deposition (LPCVD). The film had a process-induced internal tensile stress of MPa, measured by the wafer bowing method. A 500 nm thick positive-tone electron beam (E-beam) resist was spin-coated on the Si3N4 film, followed by E-beam lithography and development in hexyl acetate at 8 ∘C. The patterns were transferred into the Si3N4 layer by an O2/CHF3/Ar reactive ion etch (RIE). After resist removal using a stabilized H2SO4/H2O2 solution, the sample was immersed in a C, 45 KOH bath for approximately 15 min, to etch away the Si substrate, thereby releasing the nanobeam. The sample was then placed in a 1:4 H2O:HCl solution for 5 min. to remove precipitates from the KOH etching, then rinsed and N2 blow-dried.
Experimental setup
Optical and mechanical mode spectra
The experimental setup for device characterization and EIT measurements is shown in Fig.4(a) in the main text. Light from a 980 nm band tunable diode laser is evanescently coupled into and out of the devices using an optical fiber taper waveguide (FTW), as shown in Fig.4(b). Optical modes are measured by sweeping the laser wavelength, detecting the transmitted light with a 1 MHz bandwidth photoreceiver and recording the detected signal. A fiber polarization controller (FPC - not shown in Fig.4(a)) is used just before the FTW to ensure that only the TE polarization cavity mode is accessed. This is done by minimizing the transmission at the resonance center with the FPC. Mechanical modes are measured with the laser wavelength tuned to the shoulder of an optical mode, by detecting the transmitted light with a 8 GHz bandwidth photoreceiver. Fluctuations in the transmitted power due to thermal nanobeam mechanical motion are spectrally resolved on a real-time electronic spectrum analyzer (RSA).
Electromagnetically Induced Transparency (EIT)
In the EIT measurement setup, shown in Fig.4(a) of the main text, light from the 980 nm tunable laser corresponds to the control field, and a probe signal is derived from it by modulation with an electro-optic phase modulator (EOPM). This produces out-of-phase blue and red sidebands at frequencies away from the control beam frequency . As shown in Fig.4(a) of the main text, the EOPM is driven by port 1 of a vector network analyzer (VNA), so that the probe-control beam detuning can be swept. For small phase modulation index , the optical signal fed into the FTW can be represented by
| (S3) |
After the cavity, which has a transmission transfer function , this becomes
| (S4) |
The transmitted signal is then photodetected, yielding a photocurrent proportional to . For sufficient sideband resolution, we may assume that , i.e., red sideband does not see the cavity. Disregarding terms proportional to and using the relation , where is the cavity reflection coefficient Safavi-Naeini et al. (2011), the photocurrent component at the modulation frequency is proportional to
| (S5) |
For , this becomes
| (S6) |
Under these conditions, the network analyzer parameter has amplitude proportional to and phase .
Optomechanical coupling rate estimate
The optomechanical cavity reflectivity coefficient can be cast as a function of the control-probe detuning as
| (S7) |
where is the optical cavity decay rate, cavity-control detuning, the mechanical frequency, the intrinsic mechanical damping and the cooperativity. This expression is used to fit the EIT reflectivity data shown in Fig.4(e) in the main text, with , and as fit parameters. The parameter is estimated by taking the full width at half maximum of the broad range reflectivity spectrum in Fig.4(e), GHz GHz. At the same time, the broad range reflectivity peak in Fig.4(e) has a FWHM of GHz, so we use GHz GHz. From the maximum of the mechanical mode spectrum (Fig. 1(b)), we obtain GHz. From the fit to the EIT curve (Fig. 1(c)), we obtain , GHz GHz and MHz 0.1 MHz. The uncertainties correspond to 95 % fit confidence intervals and are due to experimental noise in the collected data. Applying the same procedure to the EIA curve (Fig. 1(d)), we obtain , GHz GHz and MHz 0.1 MHz.
To estimate the zero-point optomechanical coupling rate , we recall that , where is the intracavity photon number:
| (S8) |
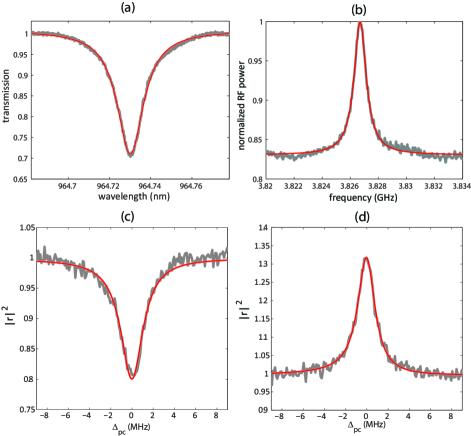
Here, ( is Planck’s constant), is the FTW coupling efficiency, is the depth of the optical resonance in the transmission spectrum (=1 at critical coupling), the intrinsic optical , and mW is the optical power at the FTW input. The intrinsic was obtained as . From the optical transmission spectrum (Fig. 1(a)), we obtained . Here, the uncertainty corresponds to twice the standard deviation of the 100 first transmission values at the short wavelength limit in Fig. 1(a). The mean transmission value for the same 100 samples was used to normalize the measured spectrum.
The FTW coupling efficiency models intrinsic losses that arise in the tapered fiber fabrication, as well as external factors that may reduce the probe transmission - e.g., dust particles on the FTW surface that may scatter the guided light before it reaches the cavity. A measurement of transmitted power through the FTW away from the resonance revealed a power transmission . Optical transmission spectra measured in the forwards and backwards directions (i.e., with the tunable laser coupled to either ports 1 or 2 of the FTW), however, revealed different bistable behaviors at high laser powers. Because bistable behavior is a function of the power dropped into the cavity, that observation suggested that the power coupled from the FTW into the cavity depended on whether cavity excitation was from port 1 or 2. We thus postulate that the total FTW transmission is , where is the transmission from port 1 or 2 of the FTW up to the cavity. If coupling into the the FTW is asymmetric from ports 1 or 2, we can write , so that . To determine in eq. (S8) for the direction in which the EIT and EIA curves were obtained (i.e., from port 1 to 2: ), a bistable transmission spectrum was measured in the forward direction, with a known laser power . The excitation was then switched to port 2, and transmission spectra were taken at varying powers until the same bistable behavior as observed in the forward direction was obtained. This happened at , so that . Using these parameters in eq. S8, we obtain . The uncertainty in was obtained by propagating the uncertainties for the different parameters.
Substituting all values in eq. S8, we are able to estimate the optomechanical coupling rate to be kHz kHz. Applying the same procedure to the EIA curve, we estimate and kHz kHz.
Pulsed pump measurements
In order to achieve higher intracavity photon population numbers, we repeated the EIT measurements described above with a pump signal consisting of a periodic sequence of short, rectangular optical pulses. The duty cycle and pulse width were chosen to minimize cavity heating by linear absorption of the pump, and thereby the thermo-optic cavity dispersion. The experimental setup is illustrated in Fig. 2. Light from a CW Ti:Sapph laser was initially passed through an electro-optic amplitude modulator (EOAM) to produce a 100 kHz periodic train of 1 s pulses with an extinction such that dB dB. The uncertainty here is due to noise in the high and low power intensities detected with the 1 MHz photoreceiver and observed in an oscilloscope trace. The amplitude-modulated signal was then phase modulated with an electro-optic phase modulator (EOPM) driven by port 1 of the Vector Network Analyzer (VNA), and was launched into the FTW, which was evanescently coupled to the nanobeam OMC. Output light from the FTW was detected with a 8 GHz photoreceiver, the RF output of which was connected to port 2 of the VNA. The VNA displayed the parameter for the system, which, as shown above, is proportional to the cavity reflectivity signal. The VNA IF filter bandwidth was set to 10 kHz, which removed the high frequency signal components due to the amplitude modulation. It is worth noting that pulses shorter than s had bandwidth comparable to the EIT linewidth, which led to a low-pass filter broadening of the EIT dip.
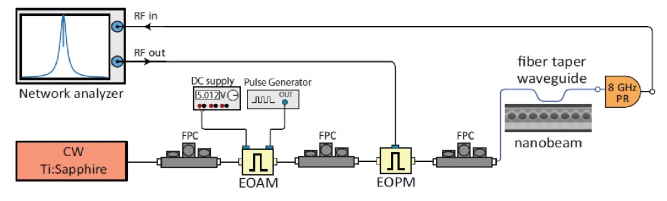
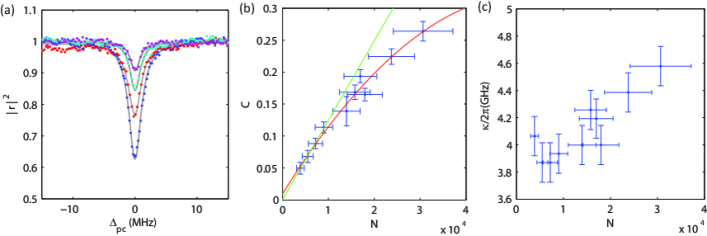
Figure 3(a) shows EIT dips obtained for various input pump powers, and pump-cavity detuning . The corresponding intracavity photon numbers are indicated in the figure. Fitting each EIT curve as detailed above allowed us to produce the curve in Fig. 3(b) for the cooperativity as a function of intracavity photon number. The highest intracavity photon of is achieved is limited by thermo-optic dispersion, which causes the cavity to become unstable for the desired detuning. We observe that the cooperativity increases linearly with from to , however the full data set is better fitted with a quadratic polynomial. At the same time, the FHWM of the broad cavity reflectivity spectra (Fig .3(c))) remains roughly at the same level (within measurement error) at the lower powers, going above it for all but the two highest powers. These results suggest that nonlinear absorption may be taking place for intracavity populations above .
References
- Eichenfield et al. (2009a) M. Eichenfield, R. Camacho, J. Chan, K. J. Vahala, and O. Painter, Nature 459, 550 (2009a), ISSN 0028-0836, 1476-4687.
- Quan and Loncar (2011) Q. Quan and M. Loncar, Opt. Express 19, 18529 (2011).
- Srinivasan and Painter (2002) K. Srinivasan and O. Painter, Opt. Express 10, 670 (2002).
- Eichenfield et al. (2009b) M. Eichenfield, J. Chan, R. M. Camacho, K. J. Vahala, and O. Painter, Nature 462, 78 (2009b), ISSN 0028-0836, 1476-4687.
- Safavi-Naeini and Painter (2011) A. H. Safavi-Naeini and O. Painter, New Journal of Physics 13, 013017 (2011).
- Safavi-Naeini et al. (2011) A. H. Safavi-Naeini, T. P. M. Alegre, J. Chan, M. Eichenfield, M. Winger, Q. Lin, J. T. Hill, D. E. Chang, and O. Painter, Nature (London) 472, 69 (2011).