Interplay between multiple scattering, emission, and absorption of light in the phosphor of a white light-emitting diode
Abstract
We study light transport in phosphor plates of white light-emitting diodes (LEDs). We measure the broadband diffuse transmission through phosphor plates of varying YAG:Ce3+ density. We distinguish the spectral ranges where absorption, scattering, and re-emission dominate. Using diffusion theory, we derive the transport and absorption mean free paths from first principles. We find that both transport and absorption mean free paths are on the order of the plate thickness. This means that phosphors in commercial LEDs operate well within an intriguing albedo range around 0.7. We discuss how salient parameters that can be derived from first principles control the optical properties of a white LED.
1Complex Photonic Systems (COPS), MESA+ Institute for Nanotechnology, University of Twente, P.O. Box 217, Enschede 7500 AE, The Netherlands \address2Philips Research, High Tech Campus 34, Eindhoven 5656 AE, The Netherlands \address3Philips Lighting, High Tech Campus 44, Eindhoven 5656 AE, The Netherlands \emaily.f.v.leung@utwente.nl \homepagehttp://cops.nano-cops.com/
(230.3670) Light-emitting diodes, (290.1990) Diffusion, (290.4210) Multiple scattering, (290.5850) Scattering, particles, (160.5690) Rare-earth doped materials, (330.1715) Color, rendering and metamerism.
References
- [1] E.F. Schubert, Light Emitting Diodes (Cambridge University, 2006).
- [2] M.R. Krames, O.B. Shchekin, R. Mueller-Mach, G.O. Mueller, L. Zhou, G. Harbers, and M.G. Craford, “Status and future of high-power light-emitting diodes for solid-state lighting”, J. Display Technology 3, 160 (2007).
- [3] H. Bechtel, P. Schmidt, W. Busselt, and B.S. Schreinemacher, “Lumiramic: a new phosphor technology for high performance solid state light sources”, Proc. SPIE 7058, 70580E (2008).
- [4] C. Gilray and I. Lewin, “Monte Carlo techniques for the design of illumination optics”, Illuminating Engineering Society North America (IESNA) Annual Conference Technical Papers, Paper no. 85, pp. 65 (July 1996).
- [5] P. Benit́ez, J.C. Miñano, J. Blen, R. Mohedano, J. Chaves, O. Dross, M. Hernańdez, and W. Falicoff, “Simultaneous multiple surface optical design method in three dimensions”, Opt. Eng. 43, 1489 (2004).
- [6] C. Sommer, J.R. Krenn, P. Hartmann, P. Pachler, M. Schweighart, S. Tasch, and F.P. Wenzl, “Effect of phosphor particle sizes on the angular homogeneity of phosphor-converted high-power white LED light sources”, IEEE J. Sel. Top. Quant. Elec. 15, 1181 (2009).
- [7] Z. Liu, S. Liu, K. Wang, and X. Luo, “Measurement and numerical studies of optical properties of YAG:Ce phosphor for white light-emitting diode packaging”, Appl. Opt. 49, 247 (2010).
- [8] T.W. Tukker, “Fluorescence modeling in remote and close LED illumination devices”, SPIE International Optical Design Conference 2010, Jackson Hole, WY, U.S.A., Paper no. ITuE2 (June 2010).
- [9] A. Lagendijk and B.A. van Tiggelen, “Resonant multiple scattering of light”, Phys. Rep. 270, 143 (1996).
- [10] M.C.W. van Rossum and T.M. Nieuwenhuizen, “Multiple scattering of classical waves: microscopy, mesoscopy, and diffusion”, Rev. Mod. Phys. 71, 313 (1999).
- [11] B.P.J. Bret, Multiple light scattering in porous gallium phosphide, Ph.D. thesis (University of Twente, 2005).
- [12] E. Akkermans and G. Montambaux, Mesoscopic Physics of Electrons and Photons (Cambridge University, 2007).
- [13] W.L. Vos, T.W. Tukker, A.P. Mosk, A. Lagendijk, and W.L. IJzerman, “Broadband mean free path of diffuse light in polydisperse ensembles of scatterers for white LED lighting”, Appl. Opt. 52, 2602 (2013).
- [14] D.J. Durian, “Influence of boundary reflection and refraction on diffusive photon transport”, Phys. Rev. E 50, 857 (1994).
- [15] N. Garcia, A.Z. Genack, and A.A. Lisyansky, “Measurement of the transport mean free path of diffusing photons”, Phys. Rev. B 46, 14475 (1992).
- [16] See catalog at: http://www.lighting.philips.co.uk/pwc_li/gb_en/subsites/oem/fortimo-led-catalogue, retrieved August, 2013.
- [17] P.D. García, R. Sapienza, J. Bertolotti, M.D. Martín, Á. Blanco, A. Altube, L. Viña, D.S. Wiersma, and C. López, ”Resonant light transport through Mie modes in photonic glasses”, Phys. Rev. A 78, 023823 (2008).
- [18] A. Ishimaru, Wave propagation and scattering in random media (Academic, 1978), Vols. I and II.
- [19] A. Lagendijk, R. Vreeker, and P. de Vries, “Influence of internal reflection on diffusive transport in strongly scattering media”, Phys. Lett. A 136, 81 (1989).
- [20] J.X. Zhu, D.J. Pine, and D.A. Weitz, “Internal reflection of diffusive light in random media”, Phys. Rev. A 44, 3948 (1991).
- [21] J. Gómez Rivas, R. Sprik, C.M. Soukoulis, K. Busch, and A. Lagendijk, “Optical transmission through strong scattering and highly polydisperse media”, Europhys. Lett. 48, 22 (1999).
- [22] O.L. Muskens and A. Lagendijk, “Broadband enhanced backscattering spectroscopy of strongly scattering media”, Opt. Express 16, 1222 (2008).
- [23] H.C. van de Hulst, Light scattering by small particles (Dover, 1957).
- [24] C.F. Bohren and D.R. Huffmann, Absorption and scattering of light by small particles (Wiley, 1983).
- [25] M.B. van der Mark, M.P. van Albada, and A. Lagendijk, “Light scattering in strongly scattering media: multiple scattering and weak localization”, Phys. Rev. B 37, 3575 (1988).
- [26] W. Meulebroeck, Y. Meuret, S. Heyvaert, H. Thienpont, “The experimental characterization of the absorption and scatter properties of photopolymers”, Proc. SPIE 8439, 84391Z (2012).
- [27] J. R. Nagel and M. A. Scarpulla, “Enhanced absorption in optically thin solar cells by scattering from embedded dielectric nanoparticles”, Opt. Express 18, A139 (2010).
- [28] D. Malacara, Color vision and colorimetry : theory and applications (SPIE 2011).
1 Introduction
White-light emitting diodes (LEDs) are rapidly replacing traditional lighting as an energy efficient form of illumination. The most common white LED today consists of a blue semiconductor diode combined with luminescent phosphors that partially convert the blue light to yellow and red [1, 2, 3]. This energy transfer occurs in a structurally complex environment. The phosphor layer is intentionally engineered to incorporate air inclusions and material scatterers. As a result light is scattered several times within the layer, making light transport a diffusive phenomenon. Broadband light diffusion contributes to the achievement of an even lighting without hot spots or angular color distribution, essential factors for many lighting applications. In addition, the recycling of photons by multiple scattering allows thinner phosphor layers to be used. This increases cost efficiency and reduces environmental impact.
The combination of diffusive light scattering and energy conversion in phosphor-converted LEDs is most often described by ray-tracing and Monte Carlo techniques [4, 5, 6, 7, 8]. Being numerical simulations, these are not capable of offering fundamental physical insights with predictive power, which could guide the evolution of efficient phosphor layers with improved optical properties. In addition, simulations can be computationally demanding and time-consuming, requiring a significant input of measured data in order to predict relevant optical parameters correctly [7, 8].
An improved description of multiple light scattering can be obtained by analytical theories originating from nanophotonics, wherein multiple scattering of light is described from first principles [9, 10, 11, 12]. The advantage of such ab initio models over ray tracing is that one obtains fundamental physical insight, starting from the detailed nanostructure of a sample. Moreover, calculating optical properties from a model is computationally much faster than performing a ray tracing simulation.
Recently, the transport mean free path was obtained for white LED diffusion plates by applying diffusion theory to diffuse transmission measurements [13]. To interpret the results, an ab initio model was made without adjustable parameters by using Mie theory. While the model was found to agree well with the experimental results, both the experiment and the model did not include absorption or emission, both of which are quintessential in the functioning of a white LED. The aim of our present paper is to close this gap and understand multiple scattering in a functional phosphor.
We examine the competitive interplay of multiple scattering and absorption, and elucidate the underlying physics of light transport. The roles of multiple light scattering and energy conversion are highly intertwined; in this paper we show how we can disentangle them with experimental measurements of diffuse intensity. We present the mean free paths of scattering and absorption, a set of characteristic diffusion parameters that encapsulates the underlying mechanisms from first principles. We compare their values to the thickness of the LEDs’ phosphor plate, which is an essential parameter in multiple light scattering [9, 10, 11]. This represents the first time white LEDs have been studied with a combined experimental and analytical approach from first principles based on diffusion theory. Our approach produces explicit physical parameters that allow for a non-phenomenological, physically motivated treatment. As such, this approach offers concrete physical insights, allowing comparison of phosphors of even vastly different structural and optical properties, such as particle shape or size distribution.
2 Light diffusion with energy conversion - observables and optical properties
Multiple light scattering in diffusive photonic media is often studied by total transmission - also known as diffuse transmission - which is the transmission integrated over all outgoing angles at which light exits from a medium. In general the total transmission contains information on the transport mean free path , a crucial parameter that describes multiple scattering of light [9, 10, 11, 12, 14, 13]. The transport mean free path is the distance it takes for the direction of light to become randomized while light performs a random walk in a scattering medium.
The measurement technique we have used is similar at first glance to a measurement of total transmission. We have made a measurement of the angularly integrated light intensity at the exit face of our phosphor plates. However in addition to multiple scattering, there is also energy transfer in a phosphor plate: light leaving the plate consists not only of light that is diffusely transmitted, but also of light that has been absorbed from one spectral band and re-emitted into another band. Hence the result of integrating the outgoing light intensity is a complex dispersive sum of total transmission, absorption, and emission. From here on we shall refer to this measured quantity of total transmission with energy transfer as the total relative intensity
| (1) |
where is the angular integrated light intensity at the exit face of the phosphor plate, and is the reference intensity. In our study the reference intensity is chosen to be the integrated incident intensity in the absence of the phosphor plate.
We can separate the outgoing intensity ratio into two constituent terms:
| (2) |
is the total transmission in the presence of absorption and is the ratio of re-emitted intensity to the reference intensity. We can lump multiple scattering with the first step of energy conversion, namely absorption, into one term , because in diffusion theory the combined behavior can be readily described simply as lossy diffusive scattering [15]. Thus the total transmission contains information on both the transport mean free path and the absorption mean free path . The absorption mean free path is the distance it takes for light to be absorbed to a fraction while light performs a random walk in a scattering medium. We note that remains an integrated measure of the incident light that is transmitted through the phosphor plate.
In the limit where there is negligible absorption, we define . In phosphor, is an experimentally accessible quantity if we remove the effects of absorption and emission by spectral filtering. From the transport mean free path can be deduced, as was studied in Ref. [13]. Once is known, we can use this information to deduce from . We assume there is no re-absorption, which is reasonable as the Stokes-shifted light emitted by the phosphor will no longer be in the phosphor absorption band. Therefore by a suitable combination of experiments in different wavelength ranges with excitation filters, we can distinguish the multiple light scattering from diffuse absorption properties in a white LED phosphor.
3 Experimental details
We present results obtained on polymer plates containing phosphorescent material, typical for white LED units of the Fortimo type [16]. The ceramic phosphor YAG:Ce3+ is the most commonly-used compound for remote phosphors and is also employed in Fortimo white LEDs. We investigated five polymer plates (polycarbonate, Lexan 143R) containing YAG:Ce3+ crystalline particles with weight densities ranging through and wt%, the typical densities of phosphor used in Fortimo white LEDs. These phosphor particles are known to have a broad size distribution centered around 10 m. The emission spectrum of the particles in powder form was measured at Philips Lighting. Plates were fabricated as follows: a powder of YAG:Ce3+ crystals is mixed with polymer by making a compound in the required weight ratio. Next, the compound is shaped into plates (60 mm x 2 mm) by industrial injection molding. The plates have a thickness mm.
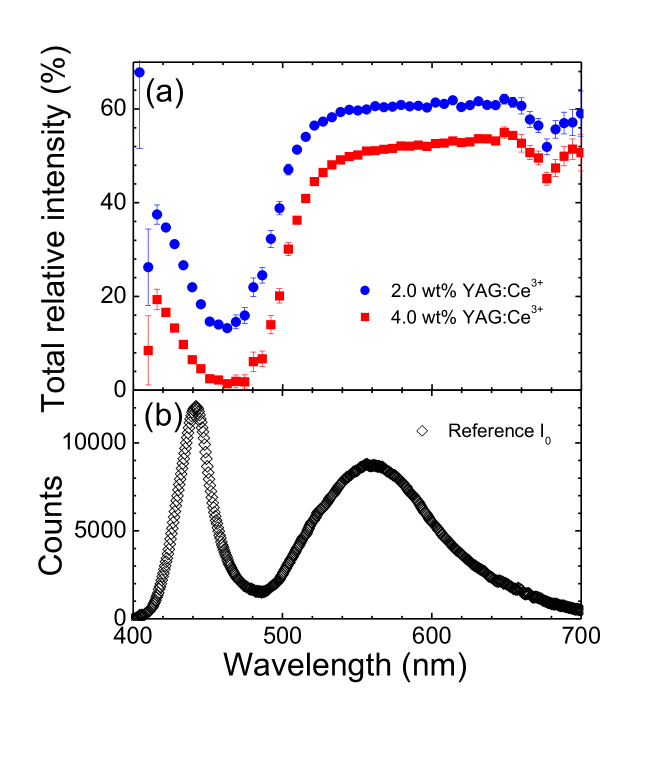
To measure broadband, spectrally-resolved, total relative intensity of light we implemented a setup with a white-light source, which in our case is a white LED (Luxeon LXHL-MW1D). The spectral range runs from nm to nm as shown in Fig. 1(b). The output of such a white LED light source has a spectral range identical to the range of interest, conveniently eliminating the need for additional spectral filters. To measure the total transmission in the absence of absorption , we use a broadband high-pass filter with a cut-off wavelength at nm that removes the blue component of the white-light source.
The beam was collimated and the diameter was set by several irises to 2 mm, and was incident at normal incidence on a plate that was vertically placed in front of the entrance port of an integrating sphere. Since the incident beam was not focused, we can safely neglect the dependence of total transmission on the angle of incidence. We verified that the entrance port of the integrating sphere was sufficiently large to accept the complete diffuse spot emanating from the strongest scattering sample. The diffuse output of the integrating sphere was monitored with a fiber-to-chip spectrometer (Avantes) with a spectral resolution of nm.
For all plates, we collected several spectra and repositioned a sample in between measurements to test the reproducibility and sample homogeneity; the measurements reproduced to within a few percent on different days. To calibrate the total relative intensity or total transmission values we collected reference spectra in absence of a sample, and determined the total relative intensity or the total transmission as the ratio of a sample spectrum and a reference spectrum. Reference spectra were frequently collected in between sample spectrum measurements to correct for possible time-dependent changes in the setup. The total relative error in the transmission is estimated to be about percent points, including systematic errors, based on the variations between different measurements.
4 Results and discussion
4.1 Total transmission
In Figure 1, we show total relative intensity spectra for phosphor plates with increasing phosphor content. For visual clarity we have only plotted of the lowest (2%) and highest (4%) weight percentages studied. Also for visual clarity we have binned into 6 nm-wide spectral intervals. The spectra are limited to the range 400 to 700 nm since this is the range where the white light source intensity is significant, see Fig. 1(b). In each spectrum, exhibits a broad trough between 400 and 510 nm, indicating a strong absorption of blue light by the phosphor.
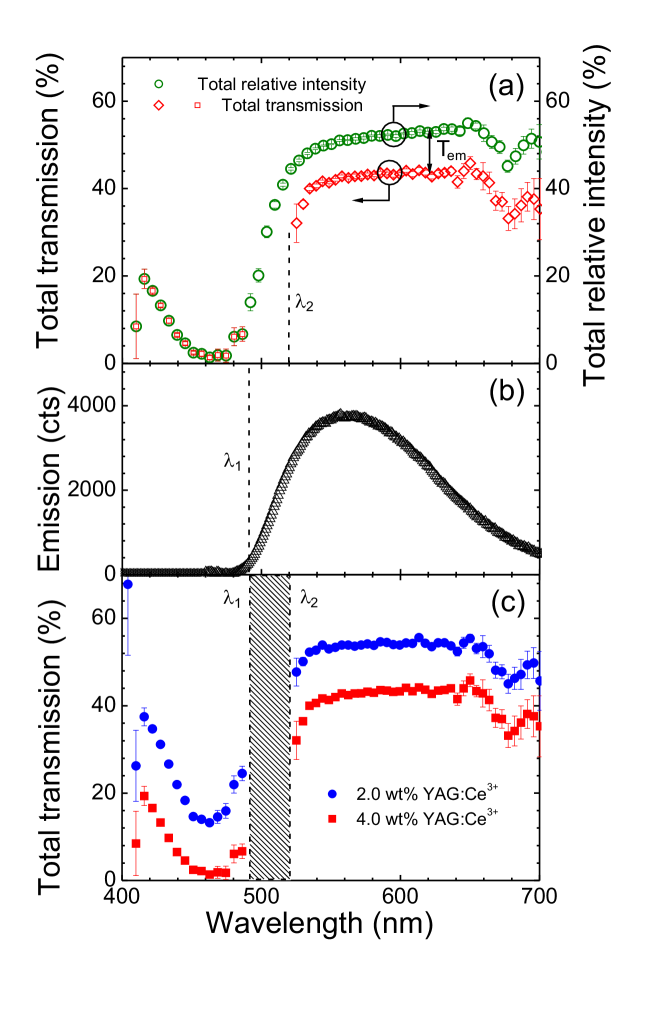
We know that due to the phosphorescence of YAG:Ce3+, includes light absorption and re-emission. To distinguish the contributions, we first measured the spectral range of YAG:Ce3+ emission, shown in Figure 2(b). We see that the emission has an onset at nm and extends to all longer wavelengths. Therefore we can already conclude with Eq. 2 that for short wavelengths , the total transmission is equal to the total relative intensity: . The equivalence of and is illustrated in Figure 2(a) by the overlap of the red and green symbols.
To identify the total transmission at long wavelengths in the range of the phosphor emission, we performed experiments with an optical filter with a cut-off wavelength at nm. Such a filter prevents blue light from exciting the phosphor, and thus corresponds to zero emitted intensity: . Hence at long wavelengths ( nm) the total transmission is equal to the total relative intensity: . The total relative intensity in the presence of the filter is shown as red diamonds in Figure 2(a) for the 4 wt% YAG:Ce3+ plate. Thus by combining the measurements of for and , we obtain the total transmission of a phosphor-containing diffuser plate for the entire visible spectral range, with the exception of the 30-nm interval between and as is shown in Figure 2(a).111We have chosen so that there is some overlap with the YAG:Ce3+ absorption band; in this way we monitor the onset of absorption in our measurement of .
Comparing the two curves and in Fig. 2(a), we see that is significantly higher than in the wavelength range nm as a result of emitted light. Apparently, the shape of the emitted spectrum agrees well with the input spectrum of the white source , resulting in a nearly wavelength-independent shown in Figure 2(a). We conclude that since the relative total intensity for in Fig. 1 is enhanced by the phosphor emission, only measuring the relative total intensity does not allow us to characterize light scattering in phosphors with emission.
In Figure 2(c), we compare total transmission spectra for samples with a YAG:Ce3+ content of 2 wt% and 4 wt%. We observe a decreasing with increasing phosphor density. In the range this behavior is intuitively reasonable as the scattering strength is expected to increase with the density of the phosphor particles that act as scatterers. In the range ( nm) the total transmission is affected by absorption of light in the YAG:Ce3+ phosphor; as is evident from the spectral shape with a minimum at nm.
4.2 Transport mean free path
From diffusion theory, the analytical solution of the diffusion equation in the presence of absorption is known [15, 17]. The total transmission is equal to:
| (3) |
The total transmission is a function of the thickness of the plate and the wavelength . is the specular reflectivity of the incident light from the front surface. As the phosphor density is relatively low, the specular reflectivity is mainly determined by the refractive index of the polymer matrix. Previous measurements show that in the visible regime, the specular reflectivity is low, between 4 and 5% [13]. Therefore in the present work we can safely neglect the specular reflectivity. The penetration depth is the distance within the medium at which a source of isotropically emitted light is taken to be positioned, and is for diffuse incident light and for collimated normal-incident light. The extrapolation length is the distance outside the boundary at which the diffuse intensity decreases to zero [18] and it equals
| (4) |
The reciprocal absorption mean free path is equal to , where is the diffuse absorption length. In the absence of absorption the extrapolation length is well-described by
| (5) |
where is the angle- and polarization-averaged reflectivity [19]. For a medium with an average refractive index of 1.5 typical of a polymer the average diffuse reflectivity is equal to 0.57 [20].
From the total transmission in Eq.(3), we wish to determine firstly the transport mean free path and secondly the absorption mean free path as a function of wavelength and phosphor density. Using the Taylor series expansion for , we first write Eq.(3) in the limit of low absorption () as
| (6) |
where we take , as the incident light is collimated.
From the total transmission results in the absence of absorption in Fig. 2 (), the transport mean free path can be found by applying Eq. (7). Plotting as a function of (Fig. 3), we see firstly that the mean free path decreases with increasing phosphor density. Thus, scattering increases with increasing density, as expected. We also see that there is generally more scattering for blue than red light, a trend consistent with that observed for ensembles of highly polydisperse non-absorbing nano-particle scatterers [13]. It has been shown that in highly polydisperse media, the transport mean free path is only weakly dependent on wavelength [21, 22]. We can thus well describe the behavior of as a linear function of from 450 to 700 nm, the most important spectral range for white LEDs . Such a linearity was also observed in the study of LED diffuser plates with highly polydisperse ensembles of scatterers reported in Ref. [13]. Therefore to obtain Fig. 3, the total transmission is linearly extrapolated into the absorption region of nm, and diffusion theory is used to find the transport mean free path . For the strongest scattering sample of 4 wt% YAG:Ce3+, the mean free path increases by a factor 1.4 in the spectral range between 450 and 650 nm. This reveals that the observed scattering is not in the Rayleigh regime, which has a scaling of the scattering cross section that would correspond to an increase by a factor of 4 [23, 24].
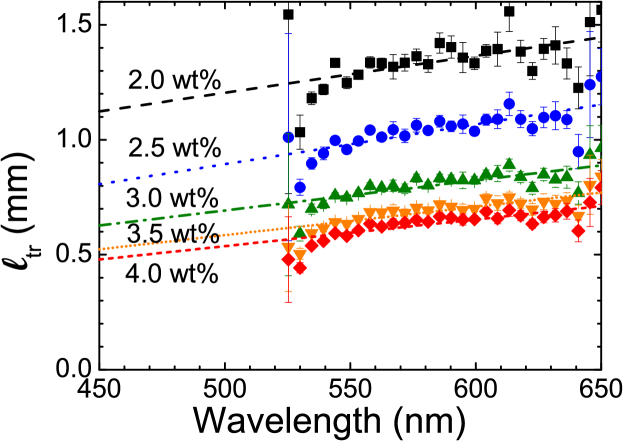
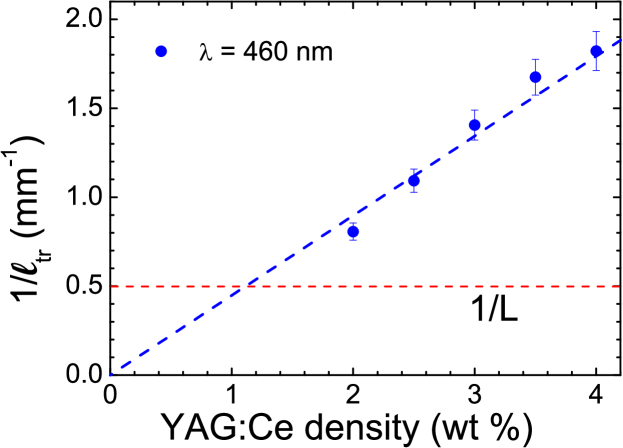
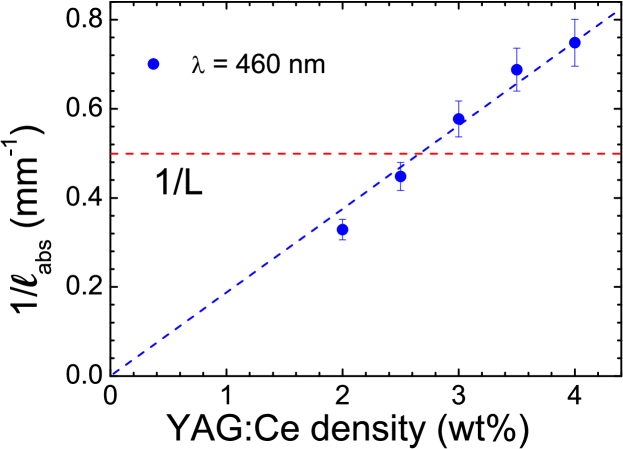
Fig. 4 shows the effect of increasing the density of phosphor on the scattering properties. To this end we have plotted the inverse transport mean free path for phosphor densities between 2 to 4%. We compare for a wavelength 460 nm at the absorption maximum of phosphor. First of all, we see that the sample thickness is 2 to 3 times that of the transport mean free path. We conclude that light is completely randomized as it traverses the thickness of the plate, and that the densities of phosphor optimized for use in white LED components are in a regime of moderate multiple scattering. Secondly, we find that has a linear dependence on phosphor density, i.e., phosphor is the main contributor to scattering in our samples. This is reasonable as our samples contain no added scatterers.
Since the mean free path of light in our samples are comparable to the sample thickness (), in other words the samples are moderately in the multiple scattering regime, it is relevant to wonder if it is justified to invoke diffusion theory. In Ref. [25], the enhanced backscattering cone, a quintessential multiple scattering phenomenon, was calculated both with exact theory and with diffusion theory. Even for low-order of scattering, i.e., for weak multiple scattering, the diffusion theory agrees very well - better than - with the exact results. In addition, simulations of the diffuse transmission of samples with widely varying thickness show that the diffusion approximation is in surprisingly good agreement with the exact results, even for a sample thickness of the order of the mean free path [14]. Therefore, we conclude that is justified to apply diffusion theory to our samples.
4.3 Absorption mean free path
To find the absorption mean free path of phosphor, we use the analytical expression for the total transmission with absorption Eq. (3). We know and for nm, and all other parameters in Eq. (3) are also known. Therefore we can deduce the absorption mean free path , using a procedure outlined in detail in the Appendix. The resulting inverse absorption lengths as a function of phosphor density are shown in Fig. 5. We see that increases linearly with phosphor density. This linearity confirms our expectation that phosphor is the main absorbing component in the sample. Comparing Figures 4 and 5, we see that for a given phosphor density the transport mean free path is less than the absorption mean free path, with a relation . This implies that the phosphor particles scatter light more strongly than they absorb light. This might seem counter-intuitive, as we normally think of phosphor only in terms of its function in color conversion. Our results show that physically, phosphor is in fact first and foremost a scattering material.
Fig. 6 shows the wavelength-dependence of the inverse absorption mean free path for the sample containing 4 wt% YAG:Ce3+. Both Figs. 5 and 6 indicate that across the absorption band, . From Fig. 5 we can clearly see that the optimal phosphor densities arrived at by trial-and-error coincides with a value of that ranges from being slightly less to slightly greater than the sample thickness . This is intuitively sensible, as luminaires are optimized for the generation of diffuse blue light and an optimal, but not total, conversion to yellow light. Therefore the optimal diffuse white illumination is best accomplished for comparable to .

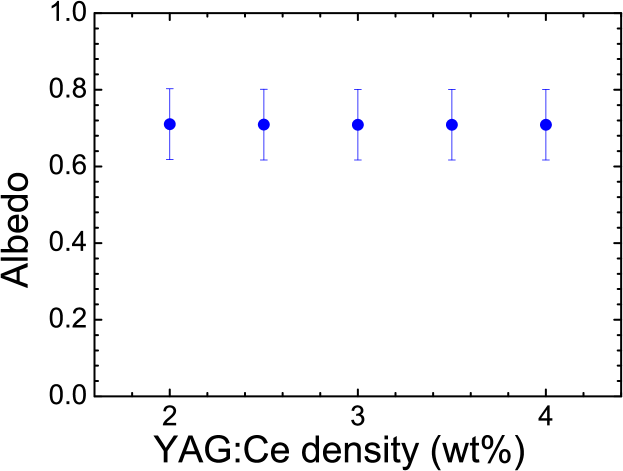
The interplay between scattering and absorption in phosphor is concisely described by the albedo that is defined as , where and are the scattering and absorption cross-sections [18]. We find that the albedo is 0.7 0.1 for nm. This result is independent of phosphor density, as we would expect in the case where scattering and absorption are single-particle properties (Fig. 7). The albedo allows us to place the optical behavior of phosphor doped polymers in relation to other complex photonic media. Traditionally, investigations of multiple light scattering have focused on systems with a high albedo of . A very low albedo, as observed here, is rarely encountered in light scattering, typically in systems of truly black particles [24]. The results we present here thus represent one of the few systems studied with low albedo. Besides the phosphor component of white LEDs, possible applications where this kind of low-albedo system is interesting include paint, printing [26], and solar fuel cells [27].
Since low albedo systems seem to be rarely studied, it is relevant to wonder how well systems with low albedo are described by diffusion theory. This was investigated by van der Mark et al. in the context of describing the scattering intensity in enhanced backscattering experiments from strongly scattering media [25]. The authors found that the bistatic scattering coefficient calculated by diffusion theory agrees remarkably well with exact calculations even for . Therefore we conclude that it is justified to apply diffusion theory to our samples.
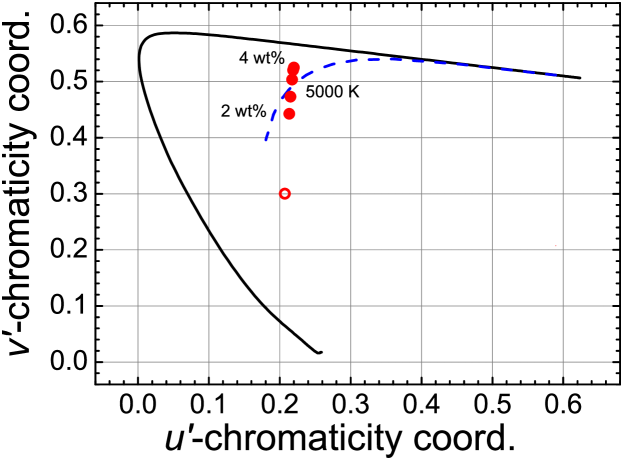
Finally let us place our approach in the context of the uniform chromaticity diagram commonly used in optical engineering (CIE, 1960) [28]. Our results can be translated into the coordinates in this color space, as shown in Fig. 8. Spectral data of a reference light source is used as the initial starting point . This is convolved with our total transmission data to give new final values as a function of phosphor density. In this way, we effectively describe a white LED with a remote phosphor in a simple way. Increasing phosphor density increases . For our choice of reference light source, increasing the density of phosphor in the phosphor plates creates a color point sequence which crosses the Planckian locus or black-body line at a color temperature of 5000 K. The color temperature of a white LED is of utmost importance to its application. Our work establishes a physics-based connection between a white LED with a certain color point, and its displacement in this color space with the addition of scatterers or absorbers. By disentangling the roles of absorption and scattering into fundamental physical parameters based on diffusion theory, we now have a way to predict shifts in due to changes in and . This offers a practical method to model changes in chromaticity in the phosphor of a white LED from a relatively straightforward measurement of the total transmission, and will be considered further in future research.
5 Summary and outlook
We have studied the optical properties of phosphorescent plates of YAG:Ce3+ in a polycarbonate matrix, a widely employed production method for white LED modules. We measured the total relative intensity over the visible wavelength range, and extracted from this measurement the total transmission. Employing photonic diffusion theory, we obtained from the total transmission the transport mean free path. The transport mean free path, which fundamentally characterizes the diffuse transport of light, is studied as a function of phosphor density. In addition we have experimentally differentiated the optical roles of phosphor in multiple scattering and absorption. This enabled us to obtain the absorption mean free path which characterizes the color conversion of light in the phosphor plates.
We find that the densities of phosphor optimized for use in white LED components exhibit transport and absorption mean free paths which are comparable to each other and also to the thickness of the sample. The optimized system is thus a system with weak scattering and low albedo. Our study opens the way to a purely physical description of color conversion in white LEDs based on diffusion. Our method is based on experimental and analytical tools that lead to a direct interpretation in terms of translational displacements in color space.
The application of our method is two-fold: as a stand-alone physical description with predictive power, and as a complement to numerical methods. Diffusion equation problems with analytical solutions are usually limited to simple sample geometries, such as a plate, a sphere, or a semi-infinite medium. Understanding of diffusion in these geometries will already provide physical insights with predictive potential, which could guide the evolution of efficient phosphor layers with improved optical properties. To model complex LED luminaires, we foresee the complementary use of our diffusion approach to augment ray-tracing techniques by providing physically motivated input parameters. Complementary use of our method to improve numerical simulations reduces the time demands currently required in measuring supplementary data in order to predict optical properties accurately.
6 Appendix: Finding the absorption mean free path
To deduce the absorption mean free path in the spectral region of significant absorption nm, we begin with the analytical solution for the total transmission Eq. (3). As a result of the analysis of Fig. 2 and the extrapolation of the transport mean free path into the absorption region, we know . From the initial experimental data presented in Fig. 1, we also know . Thus we are left with only one unknown quantity in Eq. (3): the absorption mean free path .
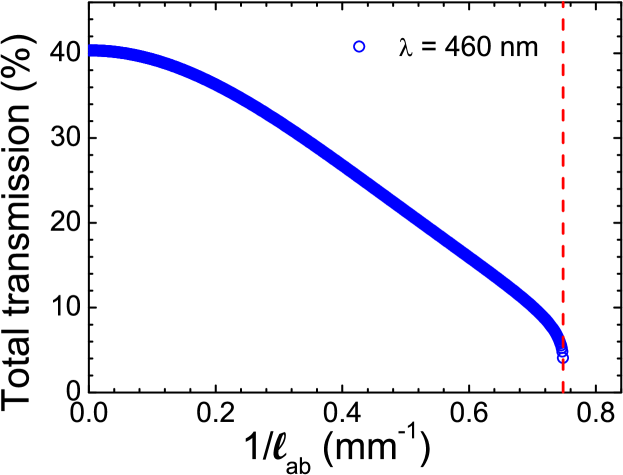
Fig. 9 is a plot of Eq. (3) as a function of the total transmission and the inverse absorption mean free path . In Fig. 9 we have fixed the transport mean free path in Eq. (3) to its experimental value at peak absorption, nm. We can therefore find the specific inverse absorption mean free path that corresponds to the experimentally obtained total transmission nm (Fig. 1). This procedure for extracting the absorption mean free path from total transmission data allows us to obtain inverse absorption mean free paths as a function of phosphor density, plotted in Fig. 5.
It can be seen from Fig. 9 that in Eq. (3), asymptotically approaches a limiting value of . The asymptotic behavior of stems from the extrapolation length in the presence of absorption , given in Eq. (4). The quantity diverges if the absorption mean free path becomes smaller than the extrapolation length without absorption . We can see that in Eq (5), when , the logarithmic part of Eq. (4) becomes divergent. In other words, Eq. (3) is unphysical for very strong absorption compared to scattering, or . For our samples we do not reach this regime; as we have shown, the optimal balance of scattering and absorption in white LED phosphors is when the two mean free paths are nearly commensurate. In our case, the asymptotic behavior of results in a small variation of with at regions of high absorption such as at nm, the absorption peak of our data. The broadband spectral dependence of the inverse absorption mean free path for is shown in Fig. 6.
7 Acknowledgments
VL would like to thank Cock Harteveld for technical advice, and Jochen Aulbach, Jacopo Bertolotti, Timmo van der Beek for discussions. This work was supported by the Dutch Technology Foundation STW (contract no. 11985), and by FOM and NWO, and the ERC.