Fermi Surface and Band Structure of (Ca,La)FeAs2 Superconductor from Angle-Resolved Photoemission Spectroscopy
Abstract
The (Ca,R)FeAs2 (R=La,Pr and etc.) superconductors with a signature of superconductivity transition above 40 K possess a new kind of block layers that consist of zig-zag As chains. In this paper, we report the electronic structure of the new (Ca,La)FeAs2 superconductor investigated by both band structure calculations and high resolution angle-resolved photoemission spectroscopy measurements. Band structure calculations indicate that there are four hole-like bands around the zone center (0,0) and two electron-like bands near the zone corner M(,) in CaFeAs2. In our angle-resolved photoemission measurements on (Ca0.9La0.1)FeAs2, we have observed three hole-like bands around the point and one electron-like Fermi surface near the M(,) point. These results provide important information to compare and contrast with the electronic structure of other iron-based compounds in understanding the superconductivity mechanism in the iron-based superconductors.
pacs:
74.70.-b, 74.25.Jb, 79.60.-i, 71.20.-bSince the first report of superconductivity in LaFeAsO1-xFxKamihara , several families of the iron-based superconductors have been discovered, including ReFeAs(O,F) (so-called 1111 system where Re represents rare earth elements like La,Ce,Pr,Nd,Sm and etc.)Kamihara ; XHChen43K ; GFChenCe ; ZARenNd ; ZARenPr ; ZARenSm , (A,K)Fe2As2 (122 system where A represents alkaline earth elements like Ba, Sr and Ca)RotterSC ; Sasmal , CFeAs (111 system where C represents alkali metal elements like Li and Na)WangXC ; JHTapp , and FeSe (11 system)FCHsu . All these iron-based superconductors share the same FeAs or FeSe layers which are believed to be essential for the occurrence of superconductivity in these compounds. Different families of the iron-based superconductors form because of the presence of various block layers that separate FeAs or FeSe layers, and various stacking sequences of the FeAs (FeSe) layers with these block layers. The latest report of superconductivity with a transition temperature Tc as high as 43 K in (Ca,R)FeAs2(where R=La and Pr)NKatayama ; HYakita ; KKudo is interesting because it has a new form of block layers in its structure. The crystal structure of (Ca1-xLax)FeAs2NKatayama consists of alternately stacked FeAs layers and arsenic layers that consist of arsenic zigzag chains with a formal electron count of As-HYakita ; NKatayama . It is important to first understand the electronic structure of this new class of iron-based superconductors.
In this paper, we report the electronic structure of the new (Ca,La)FeAs2 superconductor investigated by both band structure calculations and first high resolution angle-resolved photoemission spectroscopy (ARPES) measurements. Band structure calculations indicate that there are four hole-like bands around the zone center (0,0) and two electron-like bands near the zone corner M(,) in CaFeAs2. In our angle-resolved photoemission measurements, we have observed three hole-like bands around the point and one electron-like Fermi surface near the M(,) point. These results provide important information to compare and contrast with the electronic structure of the other iron-based compounds in understanding the superconductivity mechanism in the iron-based superconductors.
The (Ca1-xLax)FeAs2 single crystals were grown using flux method similar to that reported inNKatayama . The grown single crystals have a typical size up to 0.5 mm 0.5 mm 0.05 mm (The morphology of one single crystal is shown in the inset of Fig. 1b). The single crystals of (Ca1-xLax)FeAs2 (x=0.10, nominal composition) we grew were first characterized by X-ray diffraction (XRD) analysis. For this purpose, we selected two pieces of single crystals from the same grown ingot. Single crystal XRD analysis was performed on one piece and the obtained pattern is shown in Fig. 1b. All the observed peaks are sharp and can be indexed to (00l) reflections of the (Ca1-xLax)FeAs2 (x=0.10) crystal, indicating high purity of the crystal surface. The other piece of the single crystal was ground into powder and the obtained powder X-ray diffraction pattern is shown in Fig. 1c. It shows that the main peaks can be indexed to (Ca1-xLax)FeAs2 with a small amount of impurity phase from FeAs (marked by blank triangles) that is self-solvent during the crystal growth process. In addition, a trace of CaFe2As2 phase is also detected (marked by solid triangle). From the single crystal and powder XRD analyzes of our samples, we believe the presence of the tiny amount of CaFe2As2 phase will not affect our angle-resolved photoemission measurements on the (Ca1-xLax)FeAs2 phase. Fig. 1d shows the magnetic measurement result on the (Ca1-xLax)FeAs2 (x=0.10) single crystal. The onset superconducting transition temperature is 27.5 K for x=0.10 that is comparable to the result reported beforeNKatayama .
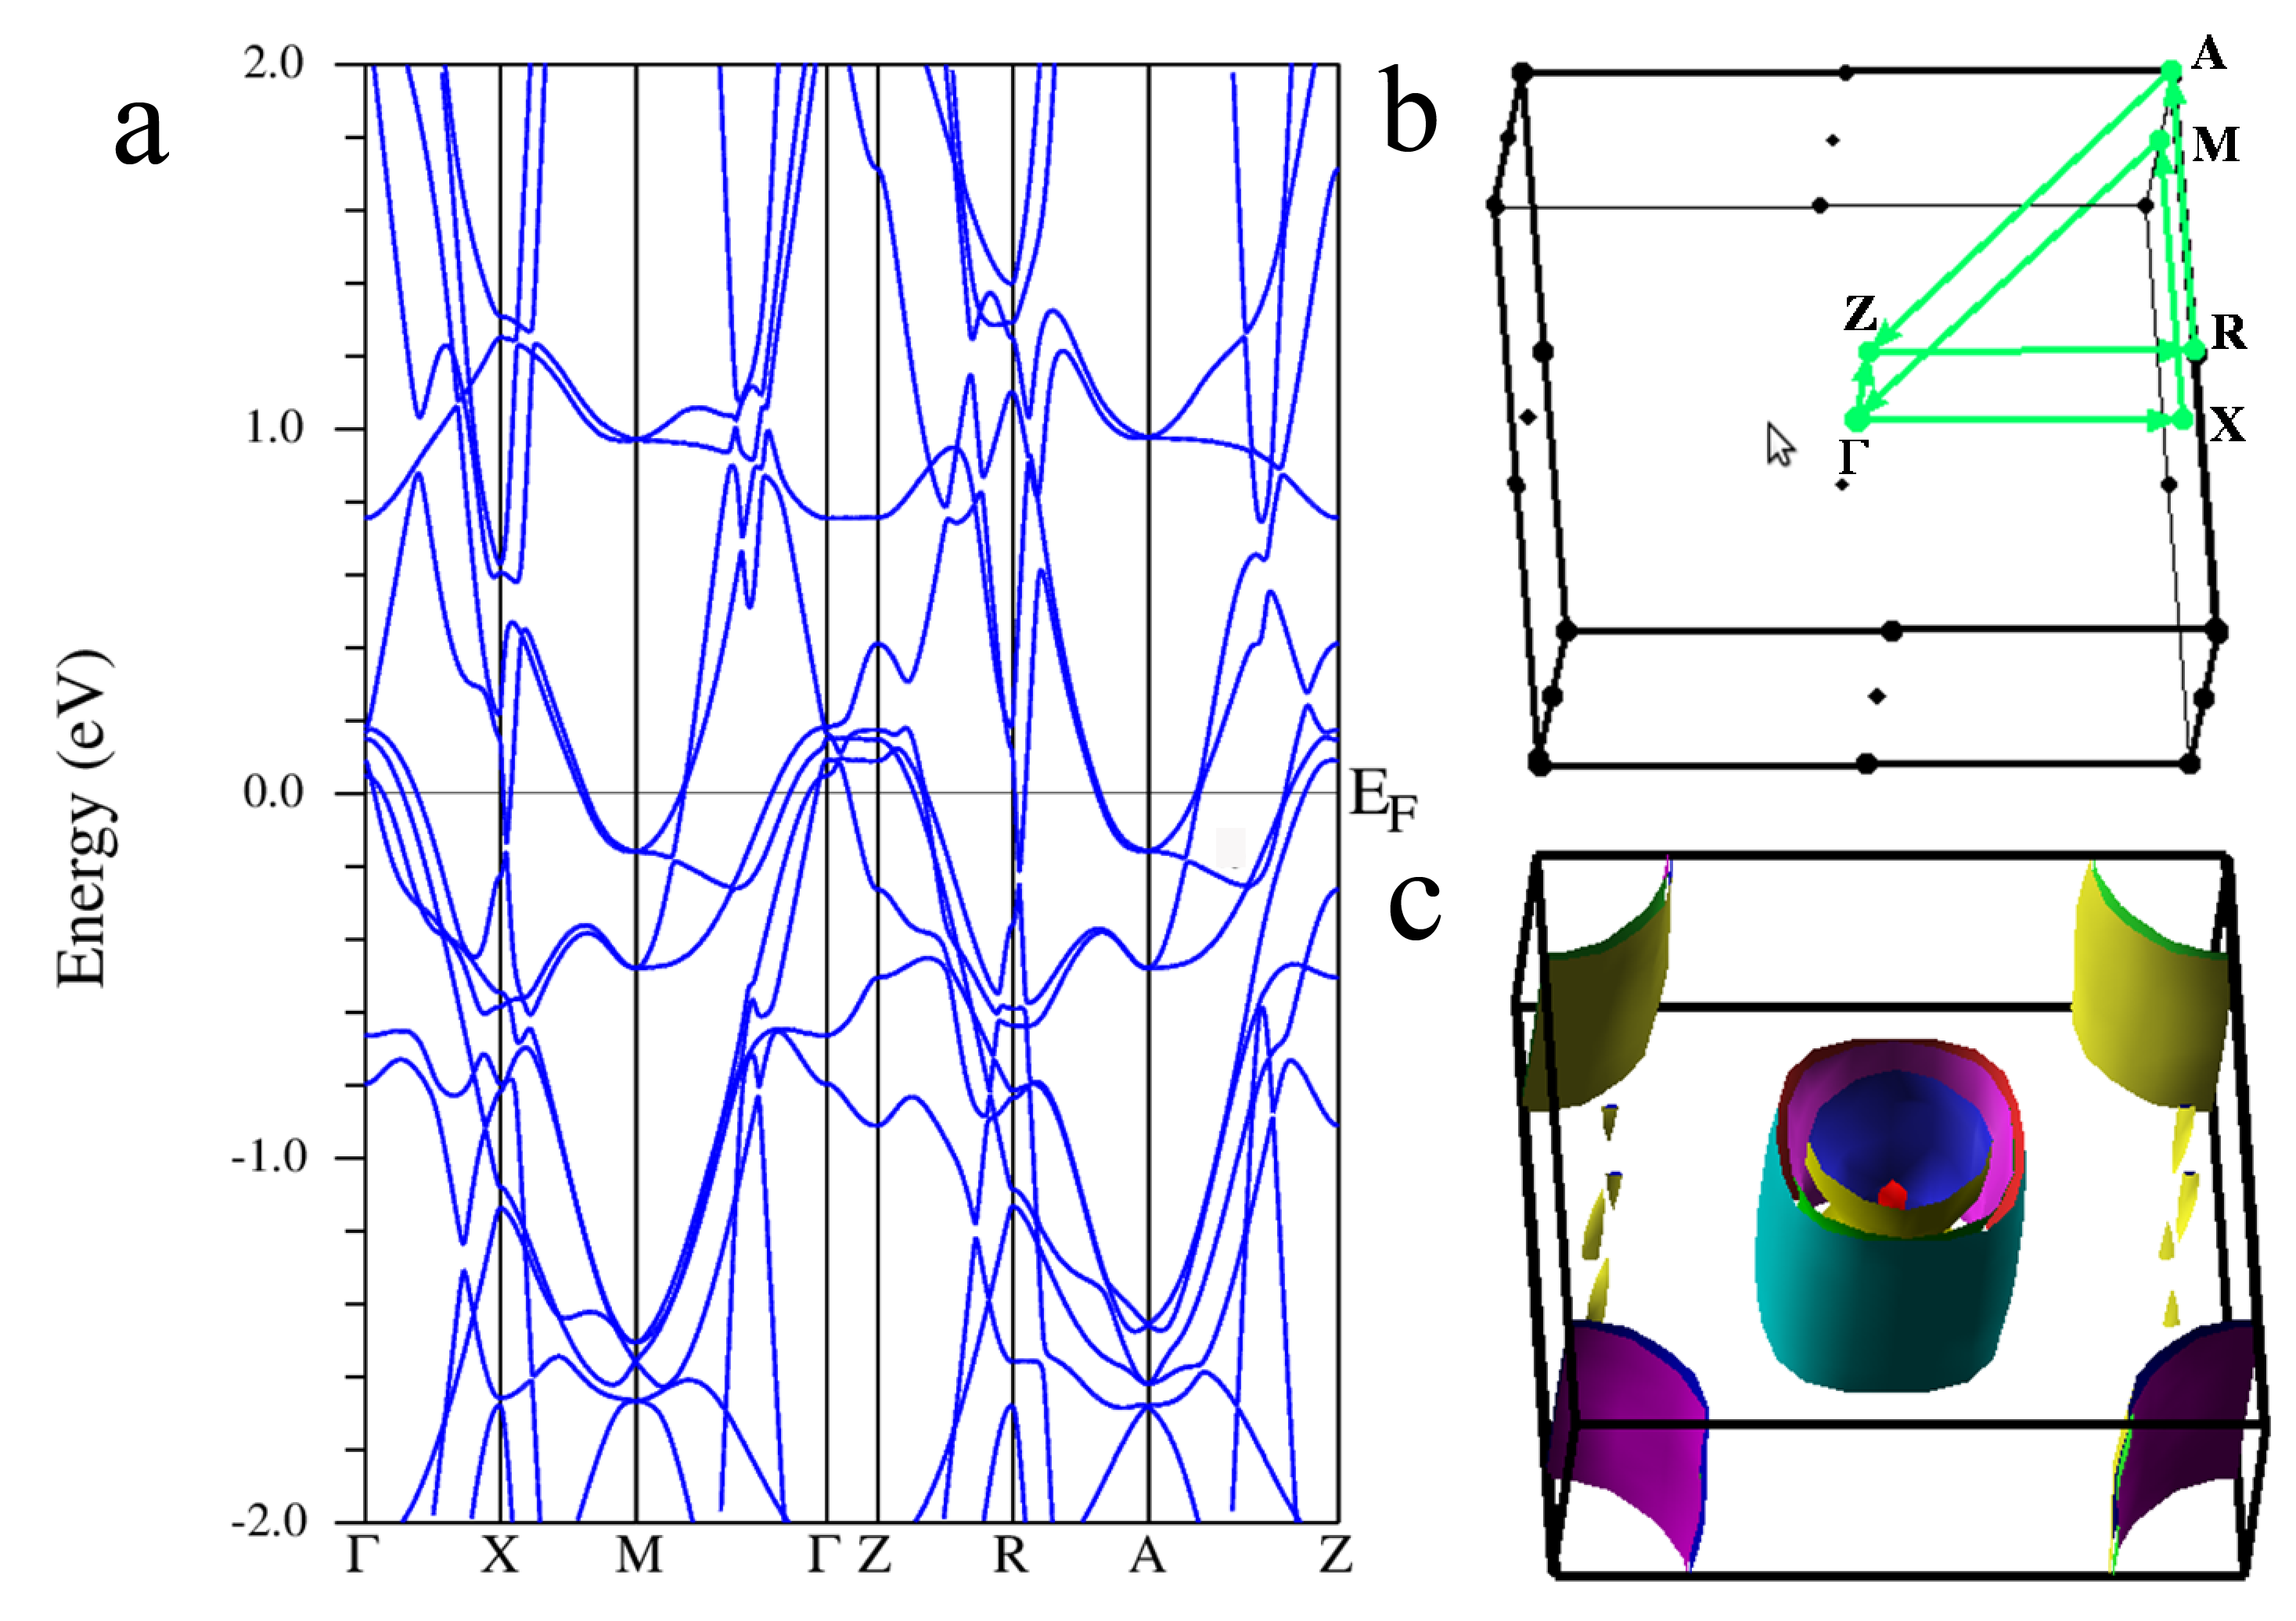
We carried out band structure calculations on CaFeAs2 using Wien2K software packageWien2K , as shown in Fig. 2. Since pure CaFeAs2 is not synthesized yet, the crystal structure, lattice constants, and atomic positions of CaFeAs2 are taken from La-doped CaFeAs2 in NKatayama . The lattice constants used are a=3.9471 , b=3.8724 and c=10.3210 taking a space group of P21NKatayama . For comparison, we also did calculations on BaFeAs2 and the obtained band structure is in complete agreement with that reported in JHShim . Our calculated Fermi surface of CaFeAs2 (Fig. 2c) is consistent with that calculated before in NKatayama . As seen from Fig. 2a, the calculated band structure near (0,0) consists of four hole-like bands, corresponding to four hole-like Fermi surface sheets shown in Fig. 2c. This is different from that of previous iron-based compounds like BaFe2As2 where three hole-like bands are present near the pointDJSingh . On the other hand, near the M(,) point, two electron-like bands are present (Fig. 2a) giving rise to two electron-like Fermi surface sheets near the M point (Fig. 2c). This is similar to that in other iron-based compounds like in BaFe2As2DJSingh . As in other iron-based superconductors, the electronic structure in CaFeAs2 is also mainly dictated by the FeAs-layers. We note that except for the small Fermi surface pocket and another inner Fermi surface sheet around , the band structure of CaFeAs2 is quite two-dimensional.
The angle-resolved photoemission measurements were carried out using our lab system equipped with Scienta R4000 electron energy analyzerGDLiu . We use Helium I resonance line as the light source which gives a photon energy of h=21.218 eV. The light on the sample is partially polarized with the electric field vector mainly in the plane of the sample surface. The energy resolution was set at 20 meV and the angular resolution is 0.3 degree. The Fermi level is referenced by measuring the Fermi edge of a clean polycrystalline gold that is electrically connected to the sample. The crystal was cleaved in situ and measured in vacuum with a base pressure better than 610-11 Torr.
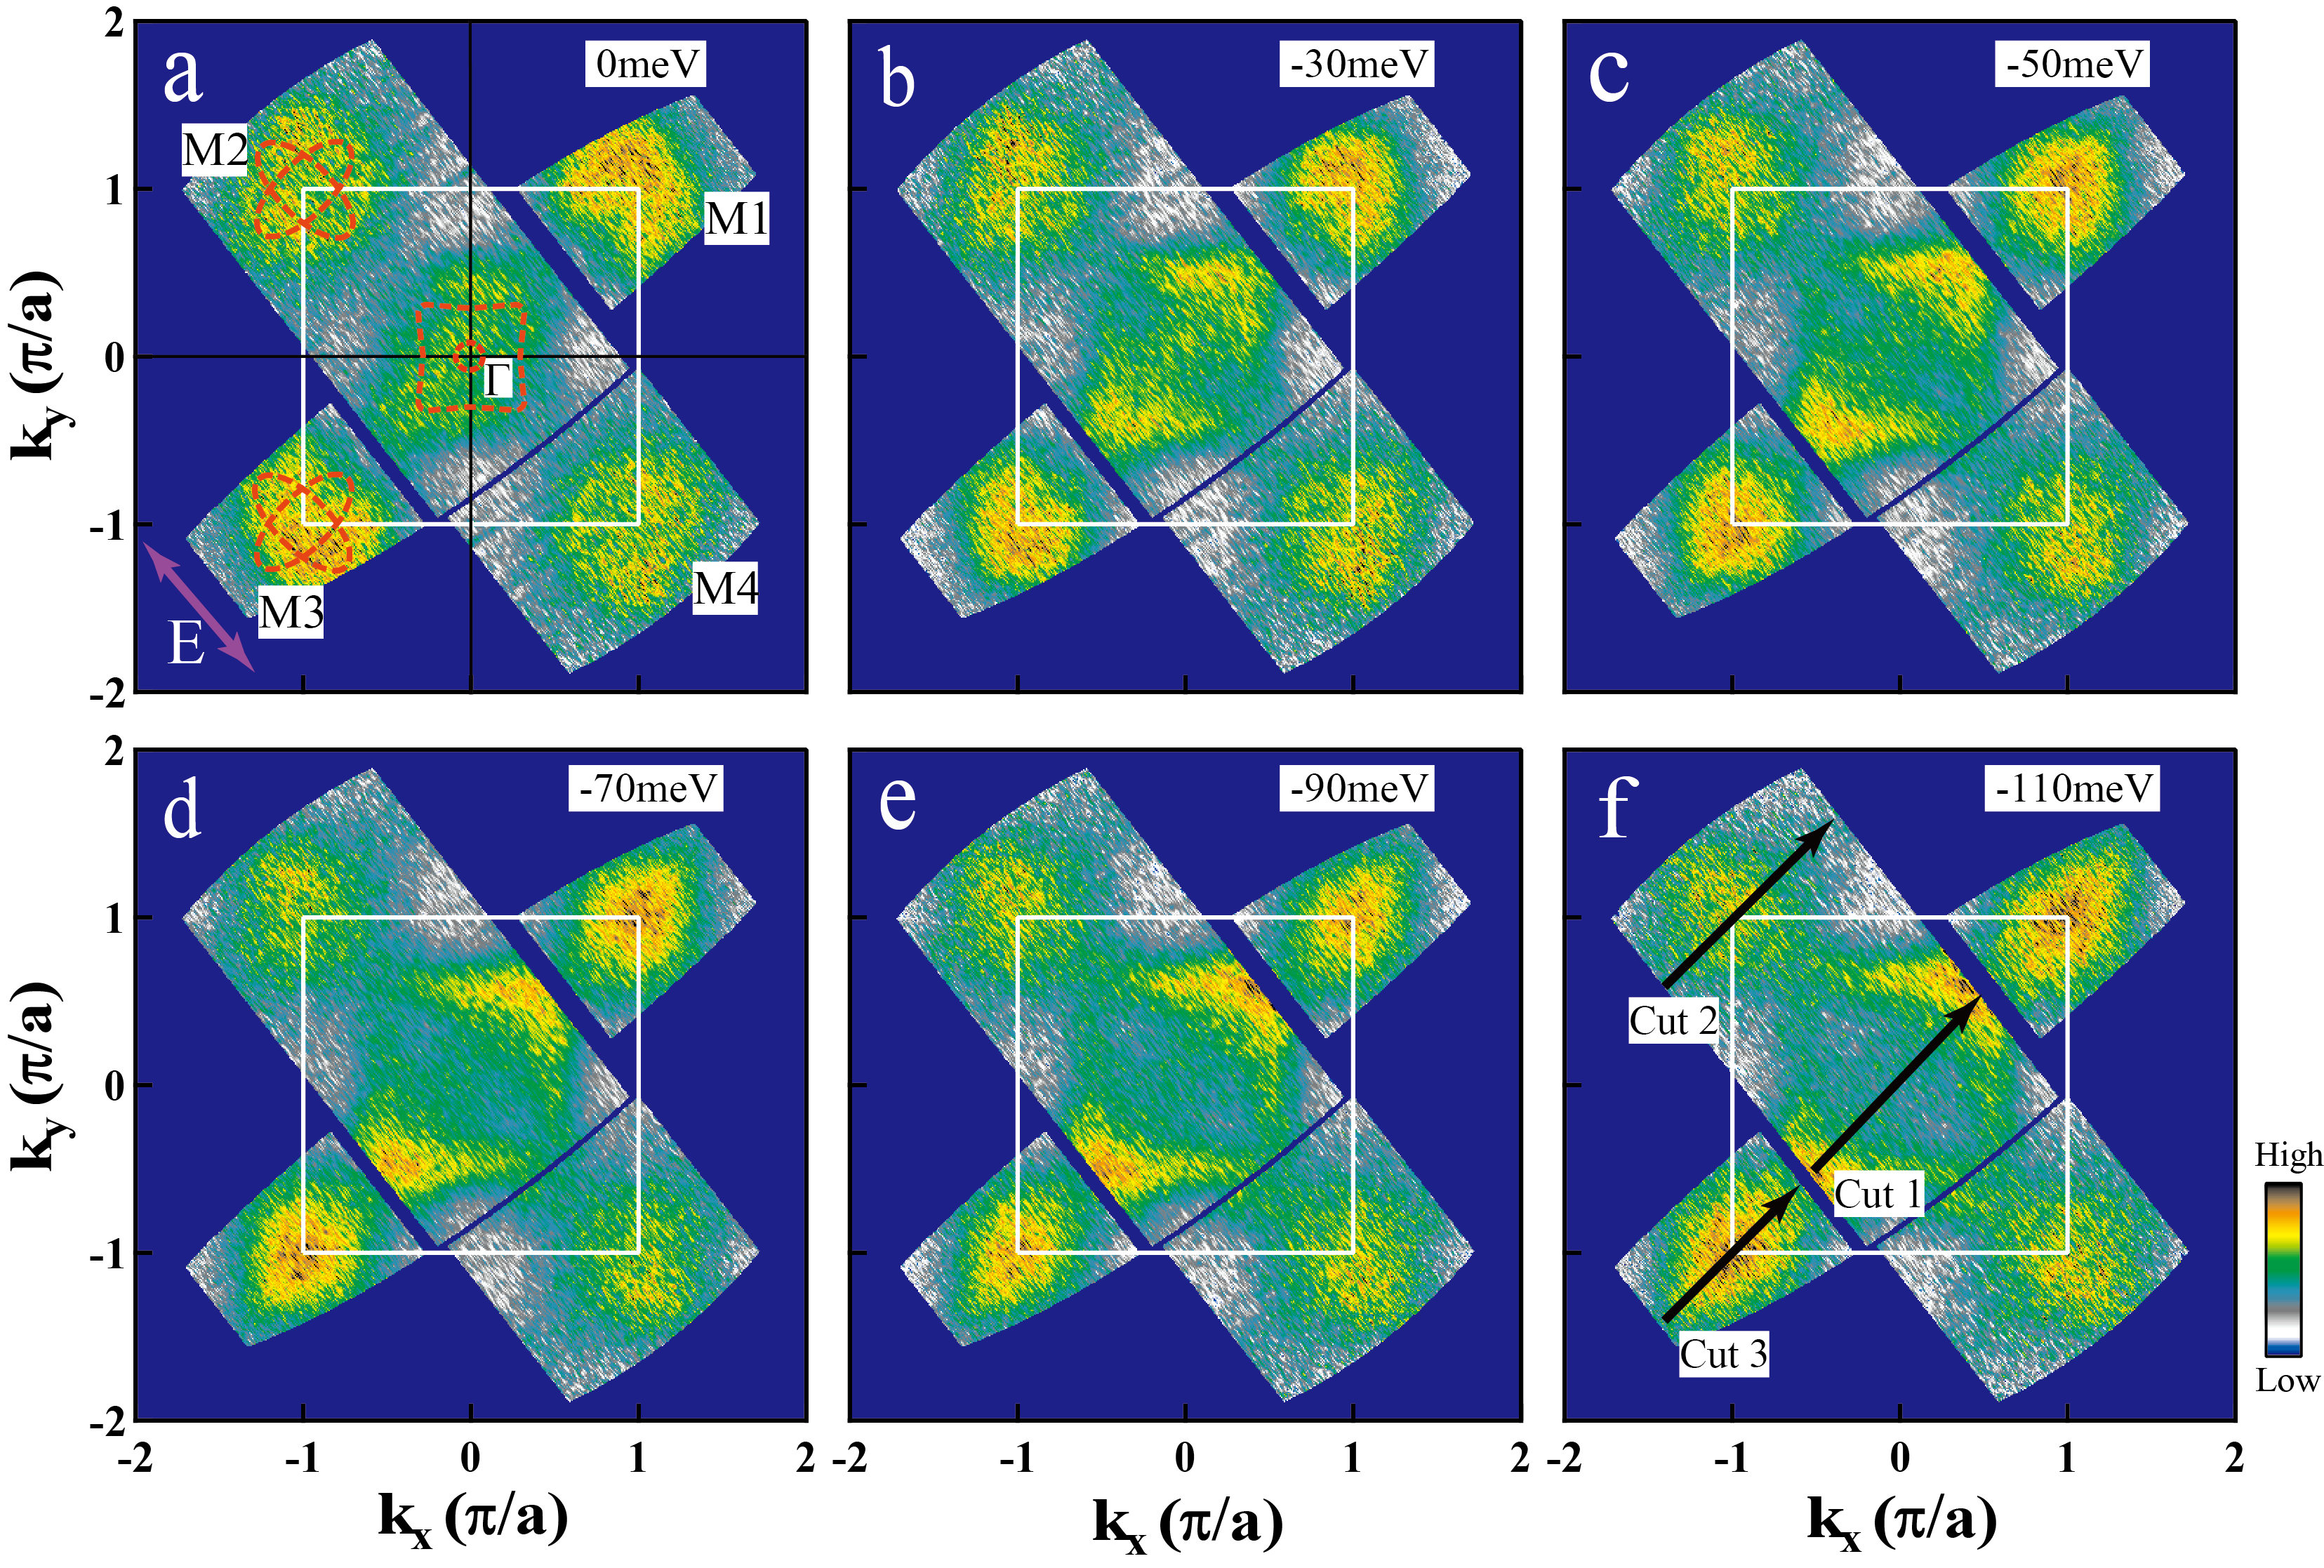
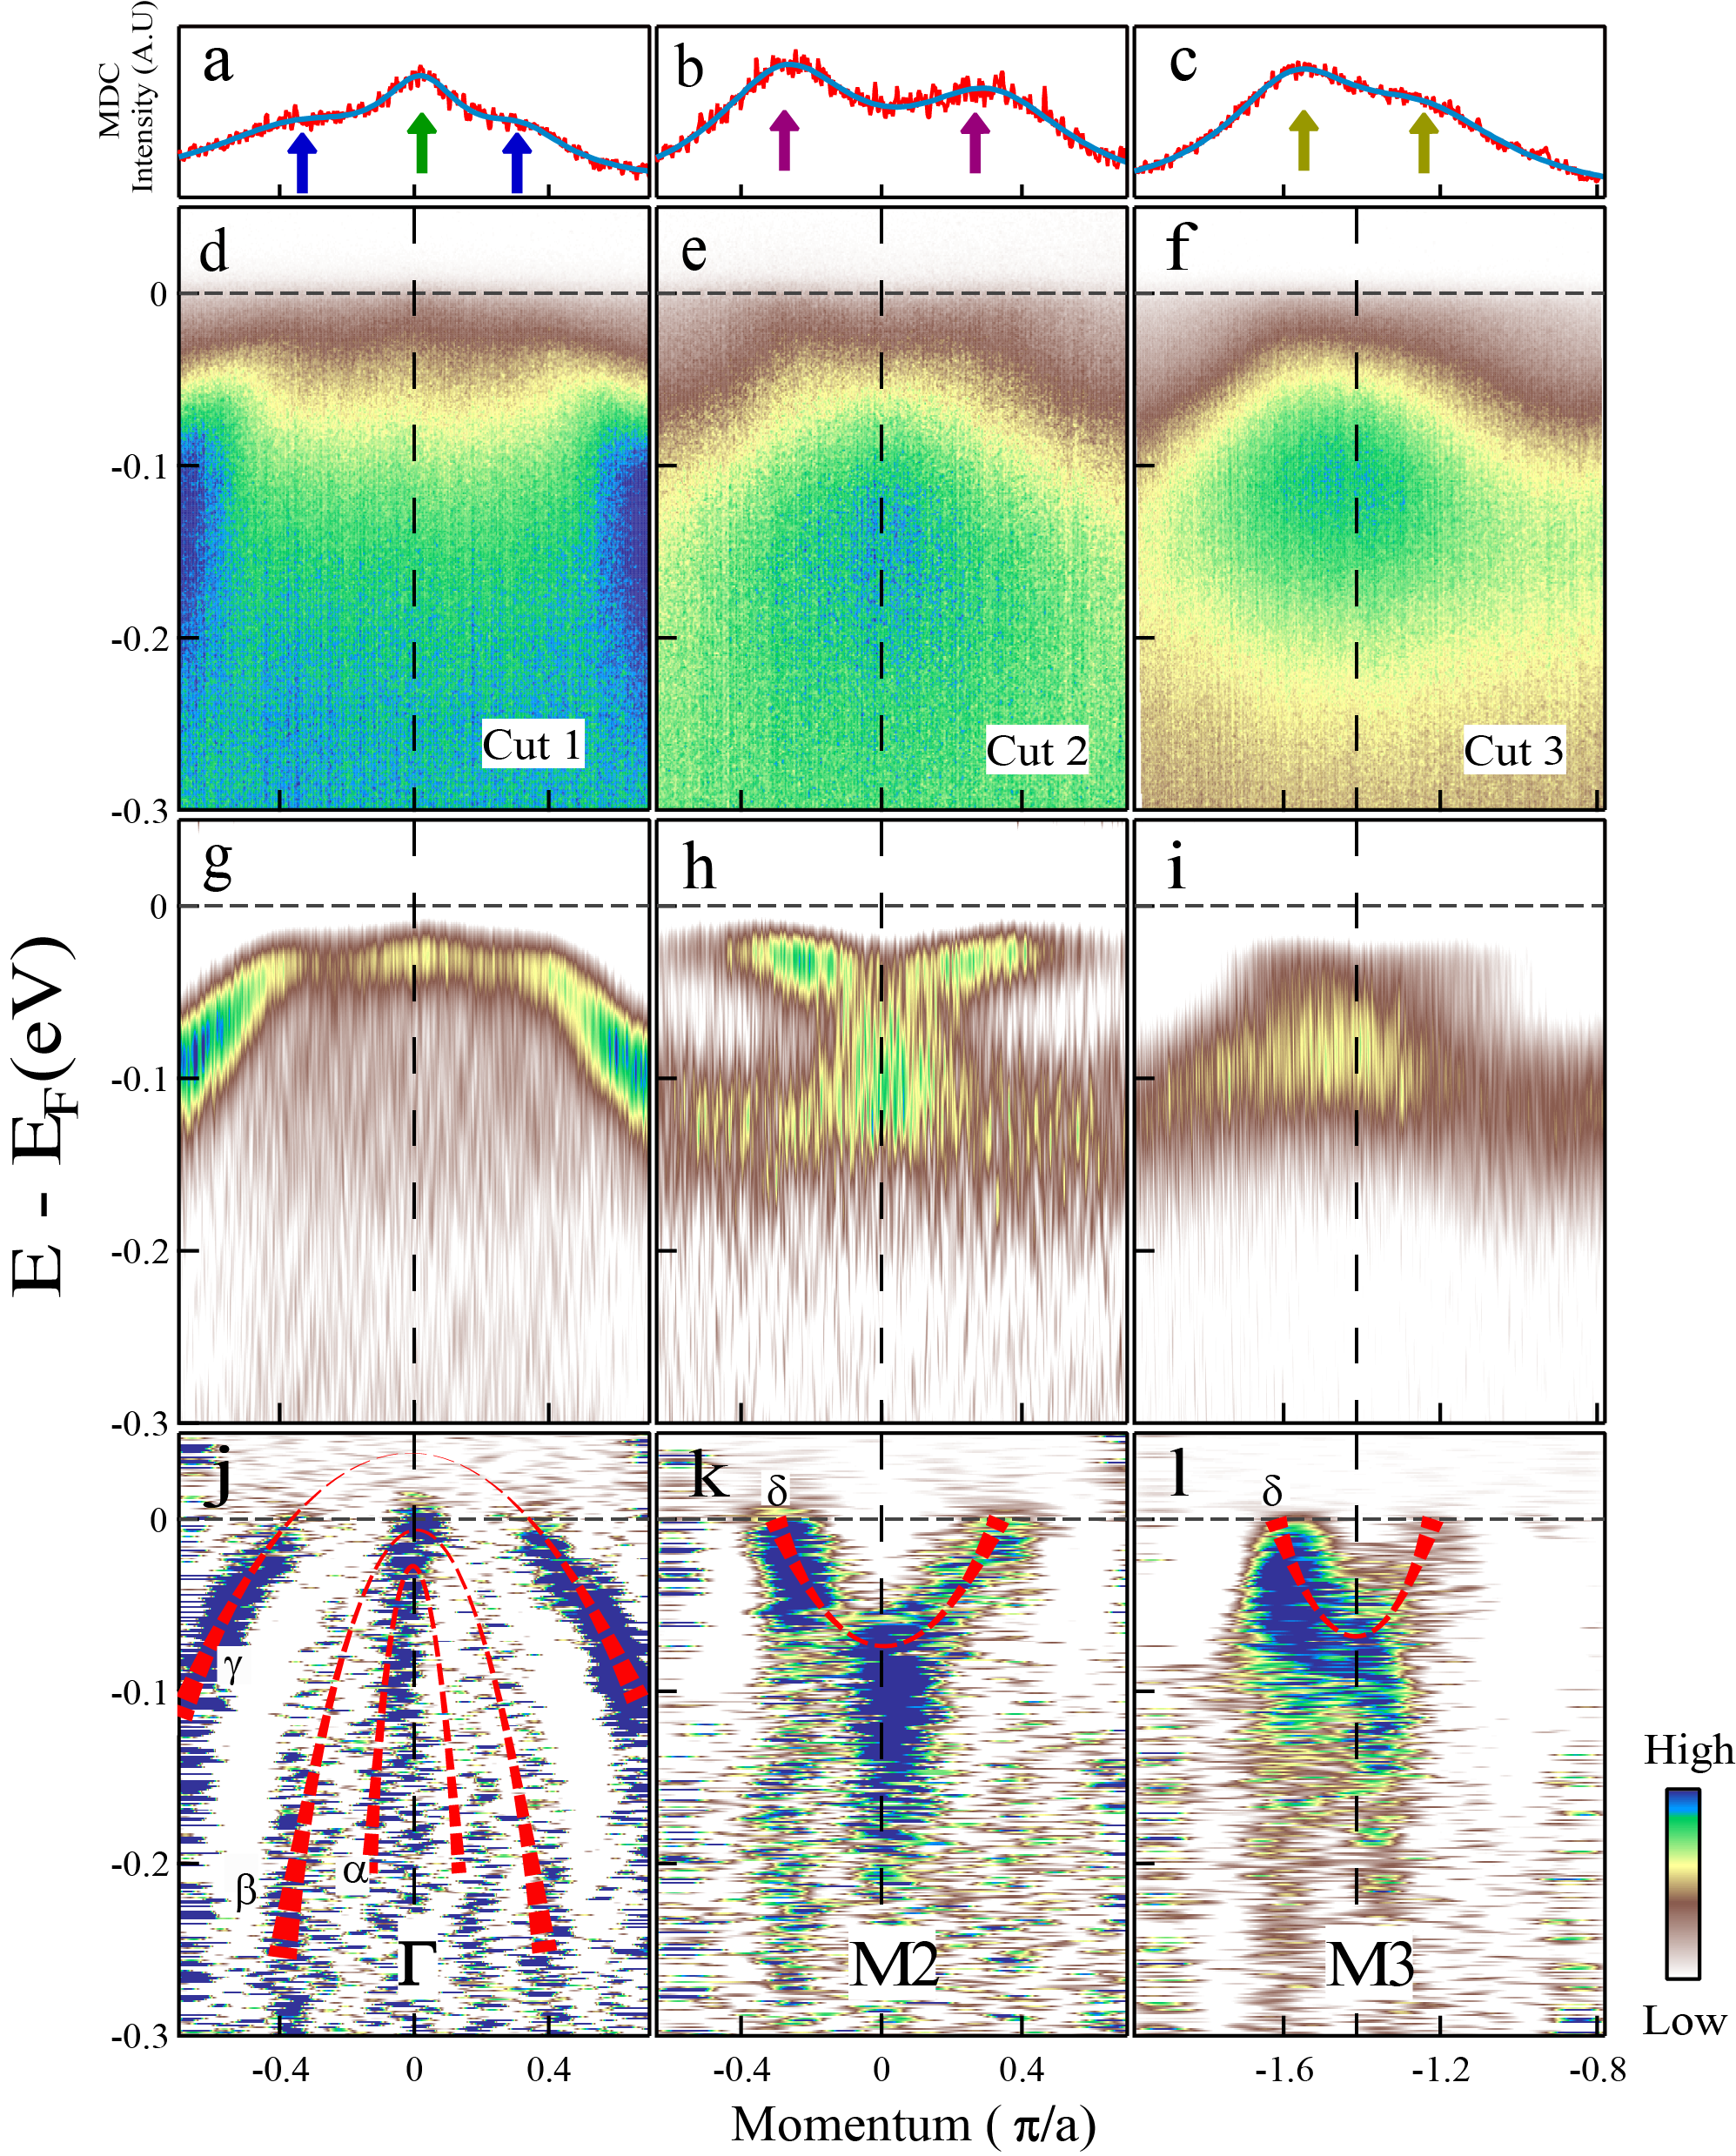
Figure 3 presents Fermi surface and constant energy contours at different binding energies of (Ca0.9La0.1)FeAs2 measured at a temperature of 30 K. The corresponding band structures along several typical high symmetry cuts are shown in Fig. 4. Around the point, two clear features can be identified. The first is a small strong-intensity patch confined near the point that is marked by red dashed line in Fig. 3a. The second obvious feature is the large Fermi surface that is nearly square-like. The spectral weight suppression along the -M2(-,) direction of this square-shaped Fermi surface is likely due to photoemission matrix element effect. With increasing binding energy, the area of the square-shaped sheet grows indicating its hole-like nature that can be directly seen from the band structure measured along a momentum cut across the point in Fig. 4(d,g,j). Around the M2(-,) and M3(-,-) points at the corners of the first Brillouin zone, one Fermi surface sheet can be discerned. The corresponding band structure measurements (Fig. 4(e,h,k) and Fig. 4(f,i,l) for M2 and M3 cuts, respectively) indicate that the Fermi surface sheet is electron-like around the M points. The slight Fermi momentum difference seen between the M2 and M3 cuts (Figs. 4k and 4l) suggests that its shape is elliptical.
From the measured band structure around the point (Cut 1, Fig. 4(d,f,j)), we can identify three hole-like bands. The outer one with large Fermi momentum, denoted as band, is most obvious. It has a Fermi momentum at 0.27 -1 and a Fermi velocity of 0.27 eV; the corresponding effective mass of this band is 7.6 me. The second hole-like band around is denoted as in Fig. 4j. Its top nearly touches the Fermi level. The third hole-like band around the point is weak but discernable, and is denoted as band in Fig. 4j. The top of the band also nearly touches the Fermi level. Around the M points, we can see only electron-like band denoted as band (Fig. 4k and 4l). From the band structure near M2 (Fig. 4k), we obtain a Fermi momentum of this band as 0.22 -1, its Fermi velocity and corresponding effective mass are 0.55 eV and 3.1 me, respectively. From the band structure near M3 (Fig. 4l), the obtained Fermi momentum, Fermi velocity and effective mass are 0.13 -1, 0.74 eV and 1.4 me, respectively.
The measured electronic structure of (Ca0.9La0.1)FeAs2 superconductor is reminiscent of that for the other iron-based superconductors like (Ba,K)Fe2As2DJSingh ; LZhao1 ; HDing . When compared with the band structure calculations (Fig. 2), the measured Fermi surface (Fig. 3) and band structure (Fig. 4) show an overall agreement but with some differences. Among the four hole-like Fermi surfaces expected from the band structure calculations around (Fig. 2a), three are observed in the measured band structure (Fig. 4j). The observed strong intensity patch near is likely due to the top of the and bands, and more probably due to the bottom of the existence of an electron-like band at , as seen from Fig. 2a. Its exact origin needs further investigation. The observation of an electron-like Fermi surface sheet near M is consistent with the band structure calculations although one would expect to see two electron-like Fermi surface sheets near M. Taking two electron-like Fermi surface sheets near M, the Fermi surface area of the electron-like sheets around M is larger than the hole-like sheet around , consistent with the expectation that the sample is electron-doped. As seen from Fig. 3a, the nesting between the electron-like Fermi surface near M and the hole-like Fermi surface sheets near looks poor for this superconductor with a Tc of 27.5 K. This suggests that Fermi surface nesting may not play a major role in dictating the superconductivity mechanism in this new iron-based superconductorNesting .
In summary, we have carried out band structure calculations and high resolution angle-resolved photoemission measurements to study the electronic structure of the new iron-based superconductor (Ca0.9La0.1)FeAs2. We have revealed hole-like Fermi surface sheets near the point and electron-like Fermi surface sheet near the M points. The measured electronic structure of (Ca0.9La0.1)FeAs2 shows agreement with band structure calculations and exhibits similarities with that of other iron-based superconductors. But there are unique features related with this new iron-based superconductors like the expected existence of four hole-like bands around the point, and the possible involvement of As states in the low-energy states near the Fermi level. These results will provide information to compare and contrast with the electronic structures of other iron-based compounds in sorting out the key factors to understand the superconductivity mechanism of the iron-based superconductors. Further improvement of the single crystal sample quality is needed in order to further study the electronic structure details and the superconducting gap by ARPES in (Ca,R)FeAs2 superconductors.
We thank financial support from the NSFC (10734120) and the MOST of China (973 program No: 2011CB921703 and 2011CB605903).
♯These people contribute equally to the present work.
∗Corresponding author: XJZhou@iphy.ac.cn, renzhian@iphy.ac.cn, and lzhao@iphy.ac.cn
References
- (1) Y. Kamihara et al., J. Am. Chem. Soc. 130, 3296 (2008).
- (2) X. H. Chen et al., Nature 453, 761 (2008).
- (3) G. F. Chen et al., Phys. Rev. Lett. 100, 247002 (2008).
- (4) Z. A. Ren et al., Europhys. Lett. 82, 57002 (2008).
- (5) Z. A. Ren et al., Materials Research Innovations 12, 105 (2008).
- (6) Z. A. Ren et al., Chin. Phys. Lett. 25, 2215 (2008).
- (7) M. Rotter et al., Phys. Rev. Lett. 101, 107006 (2008).
- (8) K. Sasmal et al., Phys. Rev. Lett. 101, 107007 (2008).
- (9) X. C. Wang et al., Solid State Commun. 148, 538 (2008).
- (10) J. H. Tapp et al., Phys. Rev. B 78, 060505(R) (2008).
- (11) F. C. Hsu et al., Proc. Natl. Acad. Sci. U.S.A. 105, 14262 (2008).
- (12) N. Katayama et al., arXiv:cod-mat/1311.1303.
- (13) H. Yakita et al., arXiv:cod-mat/1311.1302.
- (14) K. Kudo et al., arXiv:cod-mat/1311.1269.
- (15) P. Blaha et al., in An Augmented Plane Wave Plus Local Orbitals Program for Calculating Crystal Properties, edited by K. Schwarz (Technical University of Vienna, Vienna, 2001).
- (16) J. H. Shim et al., Phys. Rev. B 79, 060501 (2009).
- (17) D. J. Singh and M.-H. Du, Phys. Rev. Lett. 100, 237003 (2008)
- (18) G. D Liu et al., Rev. Sci. Instruments 79, 023105 (2008).
- (19) L. Zhao et al., Chin. Phys. Lett. 25, 4402 (2008).
- (20) H. Ding et al., EuroPhys. Lett. 83, 47001 (2008).
- (21) I. I. Mazin et al., Phys. Rev. Lett. 101, 057003 (2008); K. Kuroki et al., Phys. Rev. Lett. 101, 087004 (2008).